

Abstract
We address how feedback to a bursting biological pacemaker with intrinsic variability in cycle length can affect that variability. Specifically, we examine a hybrid circuit constructed of an isolated crab anterior burster (AB)/pyloric dilator (PD) pyloric pacemaker receiving virtual feedback via dynamic clamp. This virtual feedback generates artificial synaptic input to PD with timing determined by adjustable phase response dynamics that mimic average burst intervals generated by the lateral pyloric neuron (LP) in the intact pyloric network. Using this system, we measure network period variability dependence on the feedback element's phase response dynamics and find that a constant response interval confers minimum variability. We further find that these optimal dynamics are characteristic of the biological pyloric network. Building upon our previous theoretical work mapping the firing intervals in one cycle onto the firing intervals in the next cycle, we create a theoretical map of the distribution of all firing intervals in one cycle to the distribution of firing intervals in the next cycle. We then obtain an integral equation for a stationary self-consistent distribution of the network periods of the hybrid circuit, which can be solved numerically given the uncoupled pacemaker's distribution of intrinsic periods, the nature of the network's feedback, and the phase resetting characteristics of the pacemaker. The stationary distributions obtained in this manner are strongly predictive of the experimentally observed distributions of hybrid network period. This theoretical framework can provide insight into optimal feedback schemes for minimizing variability to increase reliability or maximizing variability to increase flexibility in central pattern generators driven by pacemakers with feedback.
Keywords: feedback, oscillation, phase response curve, pyloric network, variability
central pattern generators (CPGs) drive repetitive motor activity, and both reliability and variability in these networks have been widely studied. Here we study how feedback within circuits mediating the pyloric rhythm of the Cancer borealis stomatogastric ganglion (STG) affects variability. The pyloric rhythm is driven by a pacemaker kernel consisting of the anterior burster (AB) neuron electrically coupled to two pyloric dilator (PD) neurons; this electrically coupled group of cells exhibits spontaneous bursting that is driven by AB (for simplicity throughout this report we refer to this combined AB/PD complex as the PD). There is a single chemical feedback synapse onto the pacemaker kernel, an inhibitory synapse from the lateral pyloric (LP) neuron onto the PD neurons (Selverston and Moulins 1987). Previous work (Nadim et al. 2011) used phase-plane analyses of the oscillator kernel to show that the feedback from LP decreases the variability in the oscillation cycle period of the pyloric rhythm. Another study demonstrated that knowledge of phase resetting information can be used to control periodicity of rhythmic neurons (Stigen et al. 2011), providing a clue that perhaps biological networks utilize phase resetting in some way to govern their rhythmic variability.
The LP neuron is not an intrinsic burster but rather emits a postinhibitory rebound (PIR) burst after receiving a burst of inhibitory input from the PD, so it is a conditional burster (see Fig. 1A2). In a previous study we showed how the PIR burst can be employed to adapt phase response analysis to such conditional bursters (Sieling et al. 2012), which means that it is now possible to examine the consequences of the interaction between the pyloric network's PD and LP with phase response theory.
Fig. 1.

Measurement of recovery interval (tr)/stimulus time (ts) curves and firing intervals in the pyloric network. A1: tr/ts curve measurement from intracellular pyloric dilator neuron (PD) proceeds by repeatedly stimulating with an artificial synaptic input generated with dynamic clamp at a given ts, then repeating for each ts to be measured. A2: tr/ts measurement in nonbursting lateral pyloric neuron (LP). B1: resulting response intervals are tabulated into the tr/ts curve for PD, exhibiting typical tr/ts curve shape for PD (green points are mean ± SD for each ts; black dots are the first response intervals recorded at each new stimulus interval whose similarity to average values are indicative of negligible second-order resetting). B2: tr/ts curve tabulated from LP (red points are mean ± SD for each ts; black dots are the first response intervals recorded for each new stimulus interval, suggesting that LP also exhibits negligible second-order “resetting”). B3: LP exhibits a flat tr/ts curve, corresponding to a constant response interval independent of stimulus interval (N = 5 animals). Thin black lines show individual tr/ts curves as linearly interpolated means, normalized by each pyloric network's intrinsic period P0. Red points show the mean tr/ts curve (mean ± SE, adjusted for pairwise comparisons). C: extracellular voltage trace showing stereotypical activity of the pyloric pacemaker unit anterior burster (AB)/PD (light green, 1 AB and 2 PDs) and follower neurons LP (red), which are connected with reciprocal inhibitory synapses and burst in a periodic firing pattern lead by AB/PD. PY follower neurons (blue spikes) are also present in the pyloric circuit, but their effect on LP is ignored. LP stimulus intervals (ts[i]) measure timing of synaptic input from AB/PD relative to the start of each cycle period P[i], and response intervals (tr[i]) measure the corresponding timing of LP's next burst relative to synaptic input from AB/PD. Because LP's tr/ts curve was found to be flat in B, the mean LP response interval measured in extracellular activity is an estimate of LP's tr/ts curve. Periods, firing intervals, and LP burst durations BLPi were also measured and averaged to inform our hybrid networks such that they operate with pyloric-like activity.
In this study, we explore the phase response properties of LP and then provide a general theory of how a feedback element such as LP affects variability in the cycle period of a pacemaker, with the intrinsic period of the pacemaker characterized as a random process. Because some of the variability in pyloric rhythmic activity is often not random but rather is attributable to other processes such as interactions with other CPGs within the stomatogastric nervous system including the gastric mill network (Bartos et al. 1999; Bucher et al. 2006; Clemens et al. 1998; Dando et al. 1973; Dickinson 1995; Mulloney 1977; Thuma and Hooper 2002), we assessed the suitability of this assumption that the pacemaker period is a randomized process by examining the autocorrelation of the pacemaker's intrinsic period. We then used a reduced, hybrid circuit, consisting of an isolated, biological PD pacemaker receiving virtual feedback applied with the dynamic clamp, in order to both test the predictions of this theory and examine the effect of phase response properties of the feedback element on network period variability. The virtual feedback was formulated simply as a latency (tr, or recovery interval) to a burst in the dynamic clamp virtual feedback unit (VFU) as a function of the time elapsed (ts, or stimulus time) since the last burst in the VFU. The tr/ts plot is closely related to the phase response curve (PRC) but has some advantages for hybrid network construction, since it retains temporal information discarded by the PRC and can be defined for neurons that are not endogenous oscillators such as LP (Sieling et al. 2012). Moreover, under certain assumptions it lends itself easily to a map of the firing intervals from one cycle to the next (Canavier 2014; Oprisan et al. 2004; Sieling et al. 2009). Our VFU utilizes tr/ts plots that are based on those observed in the biological LP as well as simple variants in shape to examine the effect of the LP's tr/ts curve on network variability.
We were able to predict the distribution of network periods and firing intervals in the PD with feedback, using only 1) the distribution of periods in the isolated PD kernel prior to coupling with the feedback element, 2) the measured recovery intervals for the isolated PD kernel using the VFU, and 3) the latency of the virtual feedback. These results in general were computed numerically. However, we were able to find an analytical solution for one special case; this enabled us to provide an explanation of the effect of feedback on the variability in that case.
METHODS
General experimental methods.
Adult C. borealis crabs were obtained via overnight shipping from The Fresh Lobster Company (Gloucester, MA) and maintained in artificial seawater at 10°C. Crabs were anesthetized in ice for 30 min prior to dissection. The STG was dissected as described previously (Gutierrez and Grashow 2009) and pinned out in a Sylgard-lined dish containing chilled physiological saline (in mM: 440 NaCl, 11 KCl, 13 CaCl2, 26 MgCl2, 12.4 Trizma base, 5.3 maleic acid, pH 7.45 at 13°C). The STG was desheathed, and Vaseline wells were formed around the lateral ventricular nerves. All preparations were perfused with physiological saline maintained at 12–14°C. All electrophysiological data were digitized on a Digidata 1322A (Axon Instruments) with an 84-μs sampling interval and recorded with Clampex 9 software (Axon Instruments). Extracellular recordings were made from the wells with stainless steel electrodes inserted into the Sylgard, and signals were filtered and amplified by an A-M Systems model 1800. Intracellular recordings were made with an Axoclamp 2B amplifier (Axon Instruments) in discontinuous current-clamp mode with glass microelectrodes (10–20 MΩ) filled with a solution of 0.6 M K2SO4 and 20 mM KCl. PD neurons were identified with standard procedures for C. borealis (Harris-Warrick 1992; Selverston and Moulins 1976) and then pharmacologically isolated from glutamatergic synaptic input from LP with physiological saline containing 10−5 M picrotoxin (PTX; Sigma-Aldrich) (Bidaut 1980). LP neurons were isolated from synaptic input with a combination of PTX and photoinactivation of both identified PD neurons to eliminate their cholinergic input onto LP (Miller and Selverston 1979). This was accomplished with glass microelectrodes backfilled with Alexa Fluor 568 hydrazide (10 mM in 200 mM KCl; Invitrogen) to inject −5-nA DC current into a PD soma for 20–30 min. The filled cell was then illuminated with a Leica EL6000 and MZFLIII using a TXR filter set for 10–15 min. Dynamic clamp (Dorval et al. 2001) protocols were programmed in house and run with an update rate of 50 μs on a computer with an NI PCI-6052E data acquisition card (National Instruments). Within these dynamic clamp protocols, we defined burst onset of all rhythmic biological membrane voltage traces to occur when the rising phase of the slow oscillation crossed a voltage threshold. This threshold was chosen so that it would be crossed as the rising slow oscillation was steepest to give maximum tolerance to baseline drift, and the slow oscillation trace was isolated from spikes by filtering the membrane voltage trace according to Vfilt(t + Δt) = Vfilt(t) + [Vm(t + Δt) − Vfilt(t)]Δt/τfilt, where Vfilt is the filtered membrane voltage, Vm is the unfiltered membrane voltage, Δt is the dynamic clamp time step of 50 μs, and τfilt = 50 ms. Analysis of all recordings was performed off-line in Spike2 (Cambridge Electronic Design).
tr/ts curve measurement and estimation.
The interval between the burst onset of a neuron and the onset of synaptic input from another neuron is the stimulus interval (tsx) for each neuron, where x = AB/PD or LP. The corresponding interval between input onset and the next burst is defined as the recovery interval (trx). We define the functions trx = gx(tsx) to quantify the dependence of trx on tsx. With dynamic clamp, these relations are measured experimentally with a multiple-pulse PRC protocol based on the functional PRC (fPRC) (Cui et al. 2009; Sieling et al. 2012) but performed assuming no adaptation or second-order resetting, such that tr/ts curves obtained are equivalent to those obtained from a PRC protocol (which we refer to as a single-pulse PRC). These assumptions are reasonable given results from previous studies that showed negligible second-order resetting in PD for artificial inhibitory inputs within a biologically plausible parameter range, except for very early or late stimulus intervals that are not important to the alternating firing patterns of our networks (Maran et al. 2011; Oprisan et al. 2004). For oscillatory neurons our protocol proceeds by first applying an initial hyperpolarizing stimulus to more closely simulate the oscillation observed in the coupled network, and discarding the initial recovery interval tr[0], then repeatedly presenting a sequence of artificial synaptic inputs at a given stimulus interval (N = 10–13 repetitions). Stimulus intervals of 20 equally spaced increments of the estimated intrinsic network period were measured in random order (Fig. 1A1). Measurement of tr/ts curves for LP proceeds in the same way (Fig. 1A2), but since LP is not an endogenous bursting oscillator, the initial hyperpolarizing stimulus serves to evoke a rebound burst, which can then be used to determine the proper stimulus interval for the next burst cycle (Sieling et al. 2012). The resulting response intervals tr[1]–tr[N] were analyzed for mean and standard deviation at each stimulus interval and the results sorted by stimulus interval for plotting as a tr/ts curve (Fig. 1, B1 and B2). Finally, these 20 points were fit with smoothing splines under tension (with weights inversely proportional to standard deviation as in Reinsch 1967) for use by theoretical methods.
The values of the parameter of the artificial synaptic input used to measure the tr/ts curve of PD neurons including conductance, duration, and reversal potential were identical in each preparation to the parameter values selected for use in the hybrid networks (see Hybrid networks). For LP, the applied artificial synaptic input had conductance set to 100–150 nS, a fixed duration proportional to each preparation's average PD burst width as measured prior to intracellular impalement in 40 cycles of the extracellular recording of intact pyloric network activity, and a reversal potential of −90 mV.
Hybrid networks.
We constructed hybrid networks by coupling a biological PD to a dynamic clamp element that serves to replace feedback from LP to PD [Fig. 2A; we refer to this dynamic clamp element as a virtual feedback unit (VFU) to avoid confusion with a biological LP]. The feedback from the VFU was simulated in the simplest form possible, as a linear tr/ts curve of arbitrary slope that responds to burst onset of PD, where the VFU's output burst duration and average activity phase when coupled to PD are chosen to approximate LP activity.
Fig. 2.
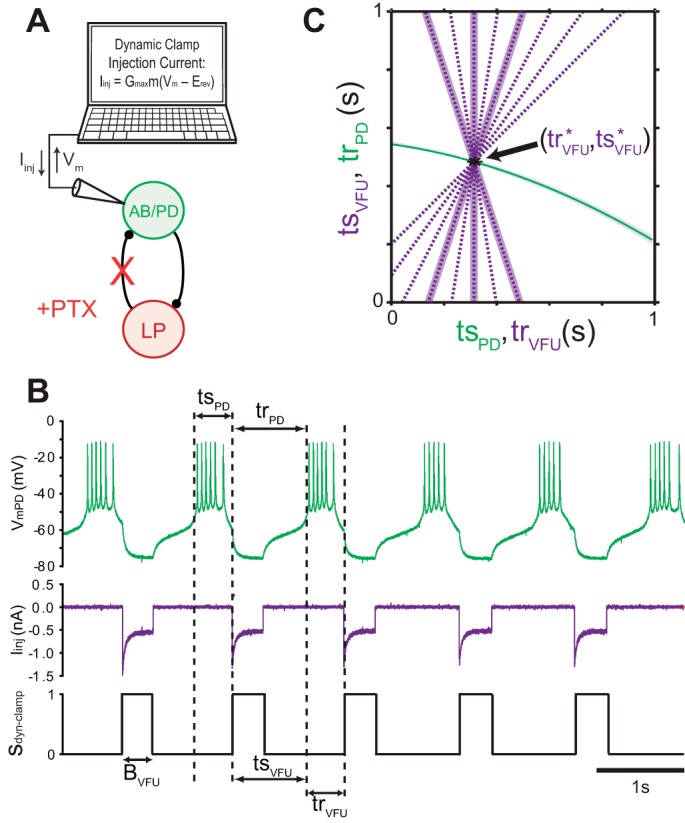
Hybrid network protocol for a biological PD and a virtual feedback unit (VFU) that replaces LP. Hybrid networks are established by interfacing a pharmacologically isolated PD with the dynamic clamp (A). The dynamic clamp simulates an LP-like VFU and its synaptic feedback to PD, where the response interval trVFU is a delay indexed from the beginning of the burst in PD (B) and a function of the elapsed stimulus interval tsVFU, implemented explicitly as a tr/ts curve (purple dashed curves, C). Once trVFU has elapsed, the dynamic clamp initiates an inhibitory square conductance pulse of fixed duration BVFU, set to mimic LP's burst duration as was measured from the intact pyloric network (see Fig. 1C). The VFU tr/ts curves are linear models with slopes m (tested from −0.4 to +1.0 by increments of 0.2) that are set to maintain a consistent fixed point (tr*VFU,ts*VFU) across slopes and approximate pyloric activity phases (see text). Highlighted tr/ts curves: m = −0.4, 0, and +0.4. PTX, picrotoxin.
We determined LP's mean activity as follows: prior to intracellular impalement, 40 extracellularly recorded cycles of the intact pyloric network were analyzed to obtain measures of mean LP stimulus and response intervals and mean LP burst duration and mean network period (Fig. 1C). So that these parameters could be scaled to a hybrid network of any period to mimic the phase maintenance present in the intact pyloric network (Bucher et al. 2005; Hooper 1997a, 1997b; Soofi et al. 2012), corresponding phase intervals were then calculated as , and LP duty cycle
We then set the VFU's burst width interval to a fixed value based upon the observed LP burst duty cycle, where P0 is the mean period of the isolated PD prior to the formation of a hybrid network.
We then determined the parameters of each VFU tr/ts curve equation necessary to reproduce average phasing of LP across all tested tr/ts curve slopes. This maintenance of average phasing is necessary in order to study variability separately from effects on the average period. For phase-locked networks, the cycle period is the sum of the mean stimulus intervals in the two neurons or the sum of the mean stimulus and response intervals in a single neuron (Mamiya and Nadim 2004; Weaver and Hooper 2003), and as a result our hybrid network average period will be dependent upon the corresponding intervals tsPD* = trVFU* and trPD* = tsVFU*, where an asterisk indicates a steady-state fixed point. Graphically this fixed point is located at the intersection of the plots of the tr/ts curve for the PD and the inverse of the tr/ts curve for the VFU at (ts*PD,tr*PD) = (tr*VFU,ts*VFU) (Fig. 2C). To keep this fixed point independent of VFU tr/ts curve slope we modeled the VFU's tr/ts curve as a family of linear functions in point-slope form that each contain the fixed point (tr*VFU,ts*VFU), so obtaining trVFU = gVFU(tsVFU) = m·(tsVFU − ts*VFU) + tr*VFU, where m is the slope. The system's fixed point (tr*VFU,ts*VFU) was estimated as by recognizing that Pnet = tsVFU + trVFU and substituting the observed LP response phase scaled by P0 for tr*VFU, where P0 is used as an estimate of Pnet. We varied the slope (presented in randomized order) from −0.4 to +1.0 by increments of 0.2 (Fig. 2C).
Finally, we neglect synaptic plasticity and assume that all maximal synaptic conductances in the hybrid network are constant. The VFU to biological PD synapse is constituted by a 50-nS virtual conductance with instantaneous activation injected into PD with a reversal potential of −90 mV. Both selected values of conductance and reversal potential were based upon previous voltage-clamp measurements from this synapse (Archila 2013; Archila and Prinz 2012; Thirumalai 2002). The PRC of the AB/PD complex is not very sensitive to changes in the strength of synaptic input (Prinz et al. 2003b) above 50 nS. The PD-to-VFU synapse is implicit in the tr/ts curve for the VFU and was calibrated by the biological PD-to-LP synapse of the intact pyloric network.
Statistics.
Inferential statistics were performed with the analytics software package SPSS 21 (IBM). In all statistical tests the same rhythm features (period and SD) were measured under all conditions of tr/ts curve slope from the same experimental preparation, so they were analyzed as repeated-measures data sets. One-way repeated-measures analysis of variance (rANOVA) was performed on experimental data to determine whether slope had an effect, and if an effect was present planned comparisons were performed to test the significance of the VFU's tr/ts curve with m = 0. Standard errors were calculated as for repeated-measures designs (O'Brien and Cousineau 2014). Autocorrelation functions were analyzed in MATLAB using 20 lags and a sequence of 200 cycle periods of each isolated PD; 95% confidence intervals for the autocorrelation functions were estimated in the standard manner as , where n is the number of cycle periods in each sequence.
Theoretical methods.
The theoretical methods are based on the following assumptions. 1) The oscillator and the feedback element fire in an alternating pattern when coupled. This is a strong assumption that requires there never be consecutive bursts in one cell before the other has a chance to fire. 2) The response of each cell to an input from the other cell is characterized by measuring the time between the receipt of an input until the cell fires next (the recovery interval tr) as a function of the time elapsed since the cell fired last (the stimulus interval): trx = gx(tsx). Using this curve requires three assumptions: 2a) When coupled in the circuit each network element has the same response to input from its partner as it does in isolation when the tr/ts curve is measured. This assumes that burst duration is constant, and changes in burst duration are ignored in our analysis. 2b) The coupling is pulsatile, so that the effects of an input are complete within one cycle and are not cumulative (no adaptation). 2c) Second-order phase resetting is assumed to be zero, meaning that only the length of the cycle that contains the input is affected, and not any subsequent cycles.
Figure 3A shows how a map can be constructed for subsequent intervals given an initial condition, for example, a PD recovery interval for hybrid network cycle n, trPD[n]. Under the assumption of an alternating firing pattern, the stimulus interval in one neuron is equal to the recovery interval in the other, so we can get the next stimulus interval in the VFU using tsVFU[n + 1] = trPD[n]. We can then obtain the next recovery interval in the VFU using the tr/ts curve for the VFU trVFU[n + 1] = gVFU(tsVFU[n + 1]). To visualize these steps, we can plot the tr/ts curve information for the two neurons with gPD(tsPD) and gVFU−1(trVFU) on the y-axis. The inverse is used in order to get equal quantities—stimulus and recovery interval pairs in partner cells—on the same axis. The map described so far can be visualized in the plane shown in Fig. 3B as the horizontal arrow leading from the point (tsPD[n],trPD[n]) to the point (trVFU[n + 1],tsVFU[n + 1]). Finally, we apply the alternating firing criterion tsPD[n + 1] = trVFU[n + 1] and use the tr/ts curve for PD to get trPD[n + 1] = gPD(tsPD[n + 1]). These final steps can be visualized as the vertical arrow leading from the point (trVFU[n + 1],tsVFU[n + 1]) to the point (trPD[n + 1],tsPD[n + 1]) in Fig. 3B. Substitution of the results from the previous steps into the final step allows each recovery interval in PD to be calculated from the previous interval as follows:
| (1) |
Fig. 3.

Map of the firing intervals. A: the schematic shows the sequential prediction (arrows) of subsequent firing intervals in an alternating firing pattern given an arbitrary initial condition. Given that we have knowledge of the tr/ts relationship gx for both neurons, the recovery interval in one neuron becomes the stimulus interval for the partner neuron. B: the dependence of trPD on tsPD (purple curve) and of trVFU on tsVFU (green curve) are plotted with the axes swapped for the purple curve in order to plot stimulus intervals from one neuron on the same axis as recovery intervals from the other neuron. In this space, horizontal arrows in B correspond to downward arrows in A and vertical arrows in B correspond to upward arrows in A. The small dots indicate iterations of the firing interval, and the large dot indicates a stable attracting fixed point. C: a representative distribution of the dependence of trPD on tsPD (green curves) at different intrinsic periods, with the probability of exhibiting a period increasing with the thickness of the curve. D: same map as in B except that the intrinsic period of PD changes randomly in each cycle.
We now introduce assumptions 3 and 4 in addition to the other assumptions described above. 3) We assume that the intrinsic period of the PD neuron is not constant but rather is drawn from a smooth and continuous stationary distribution ρPPD(PPD) that can be measured. To keep the theoretical result as general as possible, we do not assume any specific distribution for ρPPD(PPD), but instead the assumption of a constant distribution allows us to estimate ρPPD(PPD) from a recording just prior to hybrid network coupling. The measured histogram is used to solve integral Eq. 7 numerically. We assume that the period is a random process that draws from this distribution with no dependence on previous values (history independent or memoryless). We therefore redefine the map by incorporating a random process PPD[n] for the intrinsic period of PD sampled once per cycle.
| (2) |
4) We further assume that the tr/ts curve scales with changes in period (this assumes that the PRC is invariant with respect to frequency). Thus both tsPD and trPD are scaled by the factor PPD[n]/P0, where PPD[n] is the period of the present cycle and P0 is the estimated mean period at the time the curve was generated, such that:
| (3) |
We checked this strong assumption in a direct experiment described in Experimental verification and Fig. 5.
Fig. 5.

Experimental test of the assumed invariance of the tr/ts curve. A: the tr/ts curve of 1 PD was measured 4 different times over multiple hours, during which an increase in intrinsic period occurred. B: plots of the normalized curves show that tr/ts curve shape is largely invariant with the observed changes in intrinsic PD period.
The distribution of intrinsic periods produces a continuous family of tr/ts curves, shown in Fig. 3C for a representative neuron with the thickness of line proportional to the probability of a given period and its associated tr/ts curve. Note that in the hybrid circuit constructed with the dynamic clamp (see General experimental methods), the tr/ts curve for the VFU is held constant. Therefore any given point on the tr/ts curve of the VFU will map onto different tr/ts curves for PD on different cycles if the period is variable (Fig. 3D).
RESULTS
Theoretical results.
Our objective is to predict the distribution of the network periods ρPnet(Pnet) in the hybrid circuit consisting of a pacemaker with feedback, using the known distribution of intrinsic periods ρPPD(PPD) measured in an uncoupled PD neuron and the known functions gPD and gVFU (see methods). If the theoretically stationary distribution of the recovery intervals in PD is found, the distribution of the network periods can then be obtained by finding each independent way of arriving at a given Pnet. These independent ways are found by plugging each possible pair of τ = trPD and p = PPD[n] within the range of these values [Ω(trPD) and Ω(PPD), respectively] into the expression Pnet − gPD(gVFU(τ),p) − gVFU(τ) that is inside the delta function in Eq. 4. Then the probability of each Pnet is found by summing the probabilities of each independent way to arrive at that Pnet.
| (4) |
Therefore, as an intermediate step, we attempted to determine the theoretical stationary distribution of the recovery intervals in PD, . We took advantage of a trivial fact that for any set of initial conditions and any time series of intrinsic period for PD the observation that in the experimentally recorded time series the distribution of trPD[n + 1] is approximately equal to that of trPD[n] for large n, because those distributions are obtained from sets that consist of n − 1 identical elements.
The arrows indicate that as n goes to infinity the distribution of the sample values approaches the theoretical distribution from which the sample was drawn. In the case of a stationary or quasi-stationary distribution, this gives us a self-consistency criterion for the distribution of recovery intervals in PD:
| (5) |
Since we know the dependence of each recovery interval in PD upon the previous one, we need to find the distribution of which maps to itself by finding each independent way of arriving at a given trPD. These independent ways are found by plugging each possible pair of τ = trPD[n] and p = PPD[n] within the range of these values [Ω(trPD) and Ω(PPD), respectively] into the expression gPD(gVFU(τ),p) that is inside the delta function in Eq. 6. Then the probability of each arriving at a given trPD is found by summing the probabilities of each independent way to arrive at that trPD[n + 1].
| (6) |
Note that the use of on the right-hand side of Eq. 6 implies that we need to know the distribution of recovery intervals over the space Ω(trPD) of possible trPD values in order to find the distribution. However, we do not actually need to know this distribution a priori because we can resolve the integrative Eq. 6 iteratively, starting from a random distribution (Fig. 4A) in the right-hand side of Eq. 6. We then obtain (Fig. 4B) on the left-hand side of Eq. 6, and repeat for k iterations until converges to the desired steady-state distribution (Fig. 4D) that satisfies the self-consistency criterion 4 above. The distribution converges if gPD(gVFU(τ),p) is smooth and monotonic (Press et al. 2007). The integral was approximated by binning the trPD values into equally spaced bins, and recalculating the bins after each iteration, so that we obtain a histogram that approximates the theoretical distribution. In Fig. 4 we illustrate this process, but instead of plotting tr directly, we plot the associated network period using Pnet = gPD(gVFU(τ),p) + gVFU(τ) for direct comparison with the experimental data (see Fig. 4D).
Fig. 4.

Convergence of the distribution of the recovery intervals yields iterative convergence for periods in PD. A: the map was randomly initialized at k = 0 and used to produce the random distribution of network periods shown here. B: after a single iteration (k = 1) the distribution shows a distinct peak. C: at k = 7, the distribution reaches steady state. D: the histogram for k = 8 is indistinguishable from that for k = 7 in C, indicating that the algorithm has converged to a steady-state distribution. Moreover, there is a strong resemblance between the calculated histogram (solid curve) and the actual experimentally observed histogram (dashed curve).
Experimental verification.
Using hybrid networks constructed based on the rhythmic crustacean pyloric network, we explored how the distribution of the network period responds to simple changes in phase response properties of a VFU, which serves the same role in providing feedback to the pacemaker PD as LP does in the intact pyloric network. This hybrid system then provides rhythmic activity against which our theoretical predictions can be compared. Prior to pharmacological isolation of PD, the intact pyloric network preparations used for these purposes displayed mean periods of 887 ± 196 ms (mean ± SD; n = 9 preparations) and were all within the 0.5–2.0 Hz cycle frequency range typically observed in this system. The average dispersion of period in each intact preparation as measured by standard deviation was 15 ± 4 ms. Average LP burst duration was 217 ± 66 ms, representing a burst duty cycle of 0.243 ± 0.040. After pharmacological isolation of PD, the PD neurons then displayed mean periods of 758 ± 116 ms and dispersion of 39 ± 19 ms.
We first tested the assumption that the tr/ts curve shape was relatively preserved as the period varied in our system. We began by repeatedly measuring the tr/ts curve over time of a PD neuron that displayed drift in intrinsic period (Fig. 5A) and then normalized each resulting curve by the average intrinsic period P0 observed immediately prior to tr/ts measurement (Fig. 5B), revealing that the tr/ts curve shape is relatively conserved as period changes. Similar conservation of tr/ts curve shape was observed when we altered the PD period over a 3× range by sweeping preparation temperature (Soofi et al. 2014; Tang et al. 2010) between 10°C and 20°C (data not shown). Then we verified that second-order resetting was negligible in both PD and LP by comparing the first recovery interval tr[1] with the average of the train tr[1]–tr[N] in Fig. 1B and found them to be indistinguishable.
Next we tested our assumption that the PD oscillation periods do not depend on previous values (are memoryless), using autocorrelation analysis (Fig. 6A) of 200 consecutive unperturbed oscillation cycles of the isolated PD (Fig. 6B). Of n = 33 separate preparations analyzed, we found that the presence of autocorrelation varied between animals. Roughly half (16/33 = 48.5%) of preparations displayed no statistically significant autocorrelation (Fig. 6A1), while half (17/33 = 51.5%) displayed statistically significant autocorrelation (Fig. 6A2), including one preparation that showed a strikingly regular cycle-to-cycle alteration between two different period values (pink in Fig. 6, A2 and B2). Consequently we only consider preparations for which there is no significant autocorrelation for use in theoretical predictions, because only those preparations fulfill the assumptions of our theoretical prediction method.
Fig. 6.

Experimental test for the presence of memory in the intrinsic period of PD. A: Pearson's autocorrelation function (ACF) for 33 different preparations (N = 200 cycle periods each) indicates lack of significance autocorrelation in 16 preparations (A1) but significant autocorrelation of varying strengths present in 17 preparations (A2); 95% confidence intervals marked by black horizontal bars. B: individual recordings underlying these autocorrelations are summarized in plots of their cycle period progression over time beneath their respective autocorrelation plots.
In the intact pyloric network, PD receives synaptic feedback from LP. In the hybrid networks, we implemented an approximation of this feedback using an explicit dynamic clamp implementation of the linear tr/ts curves exhibited by LP in response to synaptic input: trVFU = gVFU(tsVFU) = m·(tsVFU − tsVFU*) + trVFU*; where m is the slope and (trVFU*,tsVFU*) is the system's estimated fixed point (see General experimental methods). This approximation allowed us to easily manipulate the parameters of the feedback. For these networks, the integral Eq. 6 can be rewritten as follows:
| (7) |
The resulting hybrid networks allow us to validate our theoretical methods in networks with a variety of tr/ts curves for which the resulting distribution of periods may vary systematically. The stability criterion for a network of two neurons described by tr/ts curves coupled with fixed delays is −1 < g′PD (tsPD*)·gVFU′(tsVFU*) < 1, as derived by calculating the eigenvalues of the map in Eq. 1 when a small perturbation is applied to the firing times as in Cui et al. (2009), where a prime indicates the slope of the tr/ts curve and asterisks indicate values at the fixed point. In the map we have plotted in Fig. 2C and Fig. 3, B–D, gPD(tsPD*) is plotted vs. the inverse function gVFU−1(tsVFU*). An inverted tr/ts curve with a slope of 0 is plotted as a vertical line. Using the coordinates at the intersection of the curves, this fixed point is stable if the absolute value of the slope of the purple curve gVFU−1′(tsVFU*) is greater than that of the green curve gPD′ (tsPD*) (see derivation in section 2 of supporting information text in Thounaojam et al. 2014).
Measuring the biological LP's tr/ts curve in n = 5 preparations (Fig. 1B3) indicated that the biological LP has a tr/ts curve with a slope of ∼0, similar to those in lobster (Homarus americanus) (Sieling et al. 2012).
We then constructed hybrid networks experimentally and assessed the impact of VFU tr/ts curve slope on the distribution of network period with inferential statistics. The effect of slope on mean period of the distributions was assessed with a one-way rANOVA and not significant [F(7,56) = 2.28, P = 0.12; Fig. 7A]. However, there was a significant effect of slope on variability as assessed by a one-way rANOVA of the standard deviation of the distributions of period [F(7,56) = 6.83, P < 0.001]. Further analysis by planned comparisons reveals that the hybrid network with a VFU of slope 0 (m = 0) had significantly lower variability compared with all other nonzero slopes tested (Fig. 7B), each representing a large effect size [m = −0.4: t(8) = −3.49, P = 0.008, r = 0.78; m = −0.2: t(8) = −2.62, P = 0.031, r = 0.68; m = +0.2: t(8) = −2.43, P = 0.041, r = 0.65; m = +0.4: t(8) = −2.69, P = 0.028, r = 0.69; m = +0.6: t(8) = −2.34, P = 0.048, r = 0.64; m = +0.8: t(8) = −3.11, P = 0.014, r = 0.74; m = +1.0: t(8) = −4.22, P = 0.003, r = 0.83].
Fig. 7.

Experimental change in hybrid network variability with change in tr/ts curve slope. Hybrid network period (A) and variability (B, as SD) were assessed across VFU tr/ts curve slopes (n = 9 experiments). Individual experiments (blue symbols) were averaged to give overall results (large blue circles), and statistical tests were run on both period and SD. Repeated-measures ANOVA indicated that the effect of slope on period was not significant (P > 0.05) but the effect on SD was significant (P < 0.001). Planned comparisons were used to further test the SD of network period for the m = 0 case against the SD at nonzero slopes, as this slope gives a minimum stability criterion, and results indicated that variability at m = 0 was less than at all other slopes. Error bars: ±1 SE adjusted for repeated-measures data (O'Brien and Cousineau 2014).
For the subset of hybrid networks constructed from a PD without significant autocorrelation in the uncoupled intrinsic cycle periods, we assessed how well the predicted distributions of hybrid network period matched the corresponding distributions of period observed in the hybrid networks across VFU tr/ts curve slopes. Prediction of the mean period of the distribution was highly accurate across VFU slopes, with an average error of 1.69% (Fig. 8A) between predicted and observed values. The average error between the predicted and observed standard deviation of the distributions had an average magnitude of prediction error of 16.63% (Fig. 8B). Most of the observed prediction error for variability in network period appears to be relatively independent of VFU tr/ts curve slope, such that the relationship of variability to slope is accurately predicted. Both the prediction and observation of average network period variability were at a minimum when the slope of the VFU tr/ts curve was 0.
Fig. 8.

Comparison of predicted to observed network period and variability. Experiments for which predictions and observations of period and variability were made and no strong autocorrelation was present are compared (n = 4). Individual measurements of both observed hybrid network activity (blue) and predicted activity (black) were plotted (using the same symbols for results from the same preparation) and averaged (large circles), showing good correspondence between predictions and observed hybrid network activity. Error bars: ±1 SE for repeated-measures data.
An analytic solution for a constant recovery interval in VFU.
Our theoretical and experimental results indicate that the VFU utilizing a zero-slope tr/ts curve produces minimum variability in network period. We examined this special case and obtained a simple analytical solution. If the slope is equal to 0, the recovery interval in the VFU is constant: trVFU = gVFU(tsVFU) = tr*VFU, and the map would converge to steady state in one cycle by a single vertical step without need of any horizontal paths in Fig. 3B. Consequently the recovery interval in PD depends only upon the random intrinsic period of PD, with no dependence on previous recovery intervals or their distribution . In this case the recovery interval in PD may be represented as a function of one variable: and the integral in Eq. 7 takes a very simple form that can be solved analytically for the distribution and tr/ts curve by changing variables and :
| (8) |
Using Eq. 8, we can find the distribution of PD's periods when it is coupled with the VFU with zero slope.
| (9) |
Equation 9 is similar to the distribution of periods in a feedforward network with a stochastic element (Tikidji-Hamburyan et al. 2014) and has a simple intuitive explanation. Pnet is a function of PPD, and there is a simple rule for scaling the probability density of a function of a variable when the probability function of the original variable is known (Larson and Shubert 1979). Equation 9 uses this rule directly to make the area under the curve for for a given ΔPPD equal to the area under the curve for for a given ΔPnet (and shows that for the special case given above the result agrees with known theory). If (and only if) the tr/ts curve is flat, the recovery interval in LP/VFU is constant, which removes one source of variability by making the stimulus interval in AB/PD constant except for the remaining source of variability, the stochastic period. This intuitively explains the minimum variability associated with a zero slope.
DISCUSSION
Relevance to pyloric circuit.
A recent review (Lamb and Calabrese 2012) summarized previous work (Nadim et al. 2011) on the role of the LP-to-PD synapse in stabilizing the AB/PD pacemaker as “overriding the influence of perturbations—either slowing down incipient advances or speeding up incipient delays.” In other words, the LP-to-PD synapse is thought to stabilize the mean value of the network period. In this study, using a combination of experimental and theoretical methods we have extended the role of the LP-to-PD synaptic feedback to reducing the variability of the network period with dependence upon the tr/ts dynamics of LP and suggest that the constant rebound response characteristic of the tr/ts dynamics of LP is optimized to minimize variability in the biological pyloric circuit.
The pyloric network has been the focus of much experimental and modeling work that has explored the enticing question of how similar stereotypical rhythmic activity can arise from neurons and networks of neurons with different combinations of underlying properties such as intrinsic membrane conductances and synaptic weights. This nonuniqueness in activity pattern generation is found at the single neuron level (Golowasch and Marder 1992; Liu et al. 1998; Prinz et al. 2003a; Taylor et al. 2009; Turrigiano et al. 1995;), extends through the network level (Daur et al. 2012; Grashow et al. 2010; Gutierrez et al. 2013; Prinz et al. 2004), and is likely to involve the coordinated regulation of ionic currents and membrane channels (Goaillard et al. 2009; Hudson and Prinz 2010; MacLean et al. 2003; Schulz et al. 2006, 2007; Zhao and Golowasch 2012). A frequently used strategy to evaluate the presence of such nonuniqueness of neuron or network configurations that produce similar functional activity proceeds by first obtaining steady-state estimates of the activity characteristics of a given population of neurons or networks and then assessing whether these estimates of activity characteristics conform to some stereotypical pattern or outcome. For biological experiments, this is accomplished by averaging variable network output to obtain estimates of steady-state network function. For model data, steady-state network activity intervals of simulated activity are typically obtained directly, without averaging, as simulated activity will lack the variability present in a biological neuronal system (Faisal et al. 2008) unless such variability is programmed into the model, which is an uncommon practice. Our results indicate that if insights into how networks are adapted to variability are not integrated into such studies—particularly in modeling studies—it is possible that the examination of steady-state output alone may result in false positives when classifying what constitutes a biologically plausible network configuration. In other words, network configurations that are both adapted to produce a stereotypical activity pattern and optimized for variability may be a subset of all network configurations that produce a stereotypical activity pattern.
This point is especially compelling in light of one recent study that has found that relationships can exist between individual cellular conductances and neuronal phase response dynamics (Soofi and Prinz 2015), which implies that it may be possible to trace the locus of network adaptations for rhythmic variability back to ionic current expression. This insight makes it tempting to speculate, for instance, that a zero-slope tr/ts curve in LP might depend upon an association similar to that shown in another study to occur between animal-to-animal preservation of PD rebound response following inhibition and correlation of the ionic currents transient A-type current IA and hyperpolarization-activated current IH (Zhao and Golowasch 2012). However, future studies will be required to address these kinds of questions and may not prove trivial, as ionic current correlations have not always proven intuitive and at least two studies have demonstrated that there are likely to be other ionic currents involved in a pyloric neuron's rebound interval in addition to IA and IH (Taylor et al. 2009; Zhao and Golowasch 2012).
One further question that remains unanswered is whether the pyloric circuit utilizes variability as a beneficial feature to provide flexibility to some behavioral goal in digestion, as has been suggested for the circuit underlying Aplysia feeding (Horn et al. 2004), or whether variability in pyloric pattern generation is simply a “good enough” solution that generates sufficiently functional patterned activity with a neuronal network of minimal complexity and associated metabolic cost (Hooper 2004; Selverston et al. 2000). Addressing this question directly is beyond the scope of this article, but it is interesting that our results, combined with previous findings, imply that in at least two respects the pyloric circuit is configured in a manner that optimally minimizes rhythmic variability: in terms of both its predominance of synaptic inhibition (Selverston et al. 2000; Sieling et al. 2009) and LP feedback. It may be the case that—because the pyloric rhythm interacts with other CPGs within the stomatogastric nervous system such as the gastric mill rhythm—a pyloric network configuration that confers minimal rhythmic variability is necessary for the circuit to maintain functional integrity in the face of inputs from other networks that operate on differing timescales.
There are likely other intrinsic dynamics of neuronal networks that impact network activity variability, such as might occur because of changes in synaptic feedback burst width. In this study we used a simplified form of feedback to the pacemaker by fixing the duration of the input at a constant value representing the mean burst width observed in the biological LP, but in a future study we plan to explore the implications of this simplification on network activity variability by allowing this burst width to vary.
Alternative approaches.
One could simply iterate the map in Eq. 2 starting from an arbitrary initial condition to obtain the stationary predicted distribution of recovery intervals, drawing the period from the measures distribution with the appropriate probability on each iteration. That approach is related to the one presented in this paper, but the solution could depend upon initial conditions if there are multiple fixed points (see next section).
An earlier paper (Thounaojam et al. 2014) took the approach of recreating the histogram of the firing intervals by iterating exactly the map described in Eq. 2 under two different assumptions. The histogram is an approximation of the stationary probability distribution of the intervals. The first assumption was that the period was drawn from a Gaussian distribution, and the second assumption was that the period was a history-dependent random process. For that study, the assumption of history dependence gave much better results because the number and stability of attractors appeared to vary slowly. The neurons in that study were not bursting neurons like the neuron utilized in this study, which may explain why history dependence was critical in that study but not in ours. The variety of the number and types of fixed points in the tr/ts maps (see next section) may also explain part of the difference.
Many other studies (Ermentrout et al. 2011; Sieling et al. 2009; Thounaojam et al. 2014) assume that the intrinsic period is constant but that noise causes the phase of the oscillation to be decoupled from the elapsed time, such that the stimulus interval ts is no longer a reliable indicator of the actual phase at which a neuron receives an input. In that case, the phase variable acquires a stochastic component that is added to the map at the time an input is received, so that effectively the phase resetting has an additive stochastic component. Adding noise to the phase resetting was effective in Sieling et al. (2009) but not in Thounaojam et al. (2014). In this study, we can measure the variability in the period, and it is greater than the variability in the observed phase resetting, so we chose to address variability in the intrinsic period instead.
Limitations of the methodology.
In the examples that we have presented, each pair of tr/ts curves has a single intersection, and that intersection corresponds to a fixed point associated with an alternating firing pattern, which is slightly different depending on which tr/ts curve associated with a particular value of the intrinsic period in PD is considered. The fixed point can be considered to “wander” in lockstep with the random variable for the intrinsic period. In our examples, the fixed point is always stable and attracting because the slope of the purple curve in Fig. 3, B–D, is always greater than the green curve (Thounaojam et al. 2014), which pushes trajectories back toward the fixed point (Fig. 3B). Rigorously, the assumption of an alternating firing pattern requires that there is an odd number of stable fixed points in the tr/ts map and that the stable fixed points outnumber the unstable ones, so that the trajectory is never pushed to the ends of the map, requiring a phase slip (Thounaojam et al. 2014). However, if phase slips are infrequent this assumption can be violated without degrading the quality of the results.
In the presence of second-order resetting, the experimental method we employed to measure the tr/ts curves is not valid. Beyond the fact that second-order resetting is not directly measurable with a multiple-pulse PRC protocol, the theoretical methods employed here assume that tr/ts curves are equivalent to those constructed from a single-stimulus PRC protocol. With second-order resetting the map methods become much more complicated (Oprisan and Canavier 2001).
Another limitation of the theoretical method is that in its present form it only strictly applies to intrinsic oscillators whose intrinsic period has no history dependence. Only half of the experimental preparations met this criterion for analysis by our theoretical methods. We have devised a map that takes into account the history dependence of the period (Thounaojam et al. 2014). An extension of the theory presented here to that case remains to be done. Several preparations show such history dependence (Deister et al. 2013; Netoff et al. 2005; Thounaojam et al. 2014). This history dependence has been hypothesized to play a role in active decorrelation in the basal ganglia (Wilson 2013), so such an extension may have broad applicability.
One source of history dependence is gastric modulation (Bucher et al. 2006; Clemens et al. 1998). We have not proved that a zero slope of the LP tr/ts curve decreases variability in the presence of sources of history dependence like gastric modulation, but it seems likely that removing a source of variability in this manner would tend to decrease the total variability under any circumstances.
Relevance to general theory of central pattern generation.
To our knowledge this is the first study to have examined a biological neuronal network system to assess the role of the intrinsic phase dynamics of its feedback neurons toward regularity in rhythm generation. Because of the relatively recent discovery that tr/ts techniques can be extended to analyze the phase response dynamics of rhythmic networks that include nonendogenously bursting neurons, it is not yet known how many other pattern generating systems tend to be optimized in this way for regularity like the pyloric network. Further studies can elucidate this.
The methods presented in this article are general and can be applied to two oscillators or two PIR elements, in addition to a circuit with one oscillator and one PIR element as presented here. In our study, matching the particular shape of the distribution of intrinsic periods was important in order to obtain a good match to the data. However, the qualitative effect on the width of the distribution of any feedback strategy can be determined by calculating its effect on a Gaussian distribution, for example. This allows the determination of optimal feedback strategies for other CPGs driven by an intrinsically bursting kernel, for example, the mammalian respiratory CPG (Marder and Bucher 2001).
GRANTS
This work was supported by National Institutes of Health Grant R01-NS-054281 and the computational core of P30-GM-103340.
DISCLOSURES
No conflicts of interest, financial or otherwise, are declared by the author(s).
AUTHOR CONTRIBUTIONS
Author contributions: R.M.H., R.A.T.-H., C.C.C., and A.A.P. conception and design of research; R.M.H. and R.A.T.-H. performed experiments; R.M.H. and R.A.T.-H. analyzed data; R.M.H., R.A.T.-H., C.C.C., and A.A.P. interpreted results of experiments; R.M.H. and R.A.T.-H. prepared figures; R.M.H., R.A.T.-H., and C.C.C. drafted manuscript; R.M.H., R.A.T.-H., C.C.C., and A.A.P. edited and revised manuscript; R.M.H., R.A.T.-H., C.C.C., and A.A.P. approved final version of manuscript.
REFERENCES
- Archila S. Experimental and Computational Evidence for Regulation of Synaptic Conductance via Graded Homeostasis of Post-synaptic Chloride Concentration (PhD thesis). Atlanta, GA: Emory Univ., 2013. [Google Scholar]
- Archila S, Prinz AA. Investigating synaptic plasticity in the crab Cancer borealis pyloric circuit and in a computational pyloric model network database. BMC Neurosci 13: P69, 2012. [Google Scholar]
- Bartos M, Manor Y, Nadim F, Marder E, Nusbaum MP. Coordination of fast and slow rhythmic neuronal circuits. J Neurosci 19: 6650–6660, 1999. [DOI] [PMC free article] [PubMed] [Google Scholar]
- Bidaut M. Pharmacological dissection of pyloric network of the lobster stomatogastric ganglion using picrotoxin. J Neurophysiol 44: 1089–1101, 1980. [DOI] [PubMed] [Google Scholar]
- Bucher D, Prinz AA, Marder E. Animal-to-animal variability in motor pattern production in adults and during growth. J Neurosci 25: 1611–1619, 2005. [DOI] [PMC free article] [PubMed] [Google Scholar]
- Bucher D, Taylor AL, Marder E. Central pattern generating neurons simultaneously express fast and slow rhythmic activities in the stomatogastric ganglion. J Neurophysiol 95: 3617–3632, 2006. [DOI] [PubMed] [Google Scholar]
- Canavier CC. Pulse coupled oscillators. In: Encyclopedia of Computational Neuroscience. New York: Springer, 2014. [Google Scholar]
- Clemens S, Combes D, Meyrand P, Simmers J. Long-term expression of two interacting motor pattern-generating networks in the stomatogastric system of freely behaving lobster. J Neurophysiol 79: 1396–1408, 1998. [DOI] [PubMed] [Google Scholar]
- Cui J, Canavier CC, Butera RJ. Functional phase response curves: a method for understanding synchronization of adapting neurons. J Neurophysiol 102: 387–398, 2009. [DOI] [PMC free article] [PubMed] [Google Scholar]
- Dando MR, Chanussot B, Nagy F. Activation of command fibres to the stomatogastric ganglion by input from a gastric mill proprioceptor in the crab, Cancer pagurus. Mar Behav Physiol 2: 197–228, 1973. [Google Scholar]
- Daur N, Bryan AS, Garcia VJ, Bucher D. Short-term synaptic plasticity compensates for variability in number of motor neurons at a neuromuscular junction. J Neurosci 32: 16007–16017, 2012. [DOI] [PMC free article] [PubMed] [Google Scholar]
- Deister CA, Dodla R, Barraza D, Kita H, Wilson CJ. Firing rate and pattern heterogeneity in the globus pallidus arise from a single neuronal population. J Neurophysiol 109: 497–506, 2013. [DOI] [PMC free article] [PubMed] [Google Scholar]
- Dickinson PS. Interactions among neural networks for behavior. Curr Opin Neurobiol 5: 792–798, 1995. [DOI] [PubMed] [Google Scholar]
- Dorval AD, Christini DJ, White JA. Real-Time linux dynamic clamp: a fast and flexible way to construct virtual ion channels in living cells. Ann Biomed Eng 29: 897–907, 2001. [DOI] [PubMed] [Google Scholar]
- Ermentrout GB, Beverlin B, Troyer T, Netoff TI. The variance of phase-resetting curves. J Comput Neurosci 31: 185–197, 2011. [DOI] [PubMed] [Google Scholar]
- Faisal AA, Selen LP, Wolpert DM. Noise in the nervous system. Nat Rev Neurosci 9: 292–303, 2008. [DOI] [PMC free article] [PubMed] [Google Scholar]
- Goaillard JM, Taylor AL, Schulz DJ, Marder E. Functional consequences of animal-to-animal variation in circuit parameters. Nat Neurosci 12: 1424–1430, 2009. [DOI] [PMC free article] [PubMed] [Google Scholar]
- Golowasch J, Marder E. Ionic currents of the lateral pyloric neuron of the stomatogastric ganglion of the crab. J Neurophysiol 67: 318–331, 1992. [DOI] [PubMed] [Google Scholar]
- Grashow R, Brookings T, Marder E. Compensation for variable intrinsic neuronal excitability by circuit-synaptic interactions. J Neurosci 30: 9145–9156, 2010. [DOI] [PMC free article] [PubMed] [Google Scholar]
- Gutierrez GJ, Grashow RG. Cancer borealis stomatogastric nervous system dissection. J Vis Exp 25: 1207, 2009. [DOI] [PMC free article] [PubMed] [Google Scholar]
- Gutierrez GJ, O'Leary T, Marder E. Multiple mechanisms switch an electrically coupled, synaptically inhibited neuron between competing rhythmic oscillators. Neuron 77: 845–858, 2013. [DOI] [PMC free article] [PubMed] [Google Scholar]
- Harris-Warrick RM. Dynamic Biological Networks: The Stomatogastric Nervous System. Cambridge, MA: MIT Press, 1992. [Google Scholar]
- Hooper SL. Phase maintenance in the pyloric pattern of the lobster (Panulirus interruptus) stomatogastric ganglion. J Comput Neurosci 4: 191–205, 1997a. [DOI] [PubMed] [Google Scholar]
- Hooper SL. The pyloric pattern of the lobster (Panulirus interruptus) stomatogastric ganglion comprises two phase-maintaining subsets. J Comput Neurosci 4: 207–219, 1997b. [DOI] [PubMed] [Google Scholar]
- Hooper SL. Variation is the spice of life. Focus on “Cycle-to-cycle variability of neuromuscular activity in Aplysia feeding behavior.” J Neurophysiol 92: 40–41, 2004. [DOI] [PubMed] [Google Scholar]
- Horn CC, Zhurov Y, Orekhova IV, Proekt A, Kupfermann I, Weiss KR, Brezina V. Cycle-to-cycle variability of neuromuscular activity in Aplysia feeding behavior. J Neurophysiol 92: 157–180, 2004. [DOI] [PubMed] [Google Scholar]
- Hudson AE, Prinz AA. Conductance ratios and cellular identity. PLoS Comput Biol 6: e1000838, 2010. [DOI] [PMC free article] [PubMed] [Google Scholar]
- Lamb DG, Calabrese RL. Small is beautiful: models of small neuronal networks. Curr Opin Neurobiol 22: 670–675, 2012. [DOI] [PMC free article] [PubMed] [Google Scholar]
- Larson HJ, Shubert BO. Probabilistic Models in Engineering Sciences, Vol. I: Random Variables and Stochastic Processes. New York: Wiley, 1979. [Google Scholar]
- Liu Z, Golowasch J, Marder E, Abbott LF. A model neuron with activity-dependent conductances regulated by multiple calcium sensors. J Neurosci 18: 2309–2320, 1998. [DOI] [PMC free article] [PubMed] [Google Scholar]
- MacLean JN, Zhang Y, Johnson BR, Harris-Warrick RM. Activity-independent homeostasis in rhythmically active neurons. Neuron 37: 109–120, 2003. [DOI] [PubMed] [Google Scholar]
- Mamiya A, Nadim F. Dynamic interaction of oscillatory neurons coupled with reciprocally inhibitory synapses acts to stabilize the rhythm period. J Neurosci 24: 5140–5150, 2004. [DOI] [PMC free article] [PubMed] [Google Scholar]
- Maran SK, Sieling FH, Demla K, Prinz AA, Canavier CC. Responses of a bursting pacemaker to excitation reveal spatial segregation between bursting and spiking mechanisms. J Comput Neurosci 31: 419–440, 2011. [DOI] [PMC free article] [PubMed] [Google Scholar]
- Marder E, Bucher D. Central pattern generators and the control of rhythmic movements. Curr Biol 11: R986–R996, 2001. [DOI] [PubMed] [Google Scholar]
- Miller JP, Selverston AI. Rapid killing of single neurons by irradiation of intracellularly injected dye. Science 206: 702–704, 1979. [DOI] [PubMed] [Google Scholar]
- Mulloney B. Organization of the stomatogastric ganglion of the spiny lobster. J Comp Physiol 122: 227–240, 1977. [Google Scholar]
- Nadim F, Zhao S, Zhou L, Bose A. Inhibitory feedback promotes stability in an oscillatory network. J Neural Eng 8: 065001, 2011. [DOI] [PMC free article] [PubMed] [Google Scholar]
- Netoff TI, Banks MI, Dorval AD, Acker CD, Haas JS, Kopell N, White JA. Synchronization in hybrid neuronal networks of the hippocampal formation. J Neurophysiol 93: 1197–1208, 2005. [DOI] [PubMed] [Google Scholar]
- O'Brien F, Cousineau D. Representing error bars in within-subject designs in typical software packages. Quant Methods Psychol 10: 56–67, 2014. [Google Scholar]
- Oprisan SA, Canavier CC. Stability analysis of rings of pulse-coupled oscillators: the effect of phase resetting in the second cycle after the pulse is important at synchrony and for long pulses. Differ Equ Dyn Syst 9: 243–258, 2001. [Google Scholar]
- Oprisan SA, Prinz AA, Canavier CC. Phase resetting and phase locking in hybrid circuits of one model and one biological neuron. Biophys J 87: 2283–2298, 2004. [DOI] [PMC free article] [PubMed] [Google Scholar]
- Press WH, Teukolsky SA, Vetterling WT, Flannery BP. Numerical Recipes: The Art of Scientific Computing (3rd ed). Cambridge, UK: Cambridge Univ. Press, 2007. [Google Scholar]
- Prinz AA, Billimoria CP, Marder E. Alternative to hand-tuning conductance-based models: construction and analysis of databases of model neurons. J Neurophysiol 90: 3998–4015, 2003a. [DOI] [PubMed] [Google Scholar]
- Prinz AA, Bucher D, Marder E. Similar network activity from disparate circuit parameters. Nat Neurosci 7: 1345–1352, 2004. [DOI] [PubMed] [Google Scholar]
- Prinz AA, Thirumalai V, Marder E. The functional consequences of changes in the strength and duration of synaptic inputs to oscillatory neurons. J Neurosci 23: 943–954, 2003b. [DOI] [PMC free article] [PubMed] [Google Scholar]
- Reinsch CH. Smoothing by spline functions. Numer Math 10: 177–183, 1967. [Google Scholar]
- Schulz DJ, Goaillard JM, Marder E. Variable channel expression in identified single and electrically coupled neurons in different animals. Nat Neurosci 9: 356–362, 2006. [DOI] [PubMed] [Google Scholar]
- Schulz DJ, Goaillard JM, Marder EE. Quantitative expression profiling of identified neurons reveals cell-specific constraints on highly variable levels of gene expression. Proc Natl Acad Sci USA 104: 13187–13191, 2007. [DOI] [PMC free article] [PubMed] [Google Scholar]
- Selverston AI, Moulins M. The stomatogastric nervous system: structure and function of a small neural network. Prog Neurobiol 7: 215–290, 1976. [DOI] [PubMed] [Google Scholar]
- Selverston AI, Moulins M. The Crustacean Stomatogastric System. Berlin: Springer, 1987. [Google Scholar]
- Selverston AI, Rabinovich MI, Abarbanel HD, Elson R, Szücs A, Pinto RD, Huerta R, Varona P. Reliable circuits from irregular neurons: a dynamical approach to understanding central pattern generators. J Physiol (Paris) 94: 357–374, 2000. [DOI] [PubMed] [Google Scholar]
- Sieling FH, Archila S, Hooper R, Canavier CC, Prinz AA. Phase response theory extended to nonoscillatory network components. Phys Rev E 85: 056208, 2012. [DOI] [PMC free article] [PubMed] [Google Scholar]
- Sieling FH, Canavier CC, Prinz AA. Predictions of phase-locking in excitatory hybrid networks: excitation does not promote phase-locking in pattern-generating networks as reliably as inhibition. J Neurophysiol 102: 69–84, 2009. [DOI] [PMC free article] [PubMed] [Google Scholar]
- Soofi W, Archila S, Prinz AA. Co-variation of ionic conductances supports phase maintenance in stomatogastric neurons. J Comput Neurosci 33: 77–95, 2012. [DOI] [PMC free article] [PubMed] [Google Scholar]
- Soofi W, Goeritz ML, Kispersky TJ, Prinz AA, Marder E, Stein W. Phase maintenance in a rhythmic motor pattern during temperature changes in vivo. J Neurophysiol 111: 2603–2613, 2014. [DOI] [PMC free article] [PubMed] [Google Scholar]
- Soofi W, Prinz AA. Differential effects of conductances on the phase resetting curve of a bursting neuronal oscillator. J Comput Neurosci 38: 539–558, 2015. [DOI] [PMC free article] [PubMed] [Google Scholar]
- Stigen T, Danzl P, Moehlis J, Netoff T. Controlling spike timing and synchrony in oscillatory neurons. J Neurophysiol 105: 2074–2082, 2011. [DOI] [PMC free article] [PubMed] [Google Scholar]
- Tang LS, Goeritz ML, Caplan JS, Taylor AL, Fisek M, Marder E. Precise temperature compensation of phase in a rhythmic motor pattern. PLoS Biol 8: e1000469, 2010. [DOI] [PMC free article] [PubMed] [Google Scholar]
- Taylor AL, Goaillard JM, Marder E. How multiple conductances determine electrophysiological properties in a multicompartment model. J Neurosci 29: 5573–5586, 2009. [DOI] [PMC free article] [PubMed] [Google Scholar]
- Thirumalai V. Implications of Cotransmission and Neuromodulation for Neural Network Function (PhD thesis). Waltham, MA: Brandeis Univ., 2002. [Google Scholar]
- Thounaojam US, Cui J, Norman SE, Butera RJ, Canavier CC. Slow noise in the period of a biological oscillator underlies gradual trends and abrupt transitions in phasic relationships in hybrid neural networks. PLoS Comput Biol 10: e1003622, 2014. [DOI] [PMC free article] [PubMed] [Google Scholar]
- Thuma JB, Hooper SL. Quantification of gastric mill network effects on a movement related parameter of pyloric network output in the lobster. J Neurophysiol 87: 2372–2384, 2002. [DOI] [PubMed] [Google Scholar]
- Tikidji-Hamburyan R, Lin EC, Gasparini S, Canavier CC. Effect of heterogeneity and noise on cross frequency phase-phase and phase-amplitude coupling. Network 25: 38–62, 2014. [DOI] [PMC free article] [PubMed] [Google Scholar]
- Turrigiano G, LeMasson G, Marder E. Selective regulation of current densities underlies spontaneous changes in the activity of cultured neurons. J Neurosci 15: 3640–3652, 1995. [DOI] [PMC free article] [PubMed] [Google Scholar]
- Weaver AL, Hooper SL. Follower neurons in lobster (Panulirus interruptus) pyloric network regulate pacemaker period in complementary ways. J Neurophysiol 89: 1327–1338, 2003. [DOI] [PubMed] [Google Scholar]
- Wilson CJ. Active decorrelation in the basal ganglia. Neuroscience 250: 467–482, 2013. [DOI] [PMC free article] [PubMed] [Google Scholar]
- Zhao S, Golowasch J. Ionic current correlations underlie the global tuning of large numbers of neuronal activity attributes. J Neurosci 32: 13380–13388, 2012. [DOI] [PMC free article] [PubMed] [Google Scholar]