Abstract
Expression of syncytin-1, or the human endogenous retroviral family W member 1 (HERVWE1) in human placental trophoblasts is regulated by DNA methylation. Increased DNA methylation and decreased expression of syncytin-1 have been observed in preeclamptic placentas. The syncytin-1-mediated fusogenic as well as non-fusogenic activities, e.g., cell cycle promotion, anti-apoptosis, and immune suppression, are implicated in the pathogenic changes in preeclamptic placentas. It is noteworthy that in a close vicinity to syncytin-1 there are two genes, peroxisome biogenesis factor 1 (PEX1) and GATA zinc finger domain containing 1 (GATAD1), as well as multiple CpG islands around these genes. In this study we determined if these adjacent genes might, like syncytin-1, subject to epigenetic regulation in preeclamptic placentas. Data from quantitative real-time PCR and Western blotting indicated that while PEX1 expression remained stable, GATAD1 expression was significantly decreased in the third-trimester placentas associated with preeclampsia than those associated with normal pregnancy. Immunohistochemistry detected high GATAD1 expression in trophoblast linage, and confirmed its reduced levels in preeclamptic placentas. However, COBRA and bisulfate sequencing detected decreased DNA methylation in levels in the 3 [prime] region of GATAD1 gene in preeclamptic placentas. The positive correlation between 3 [prime] methylation and GATAD1 expression was confirmed by treatment of choriocarcinoma JAR cells with DNMT inhibitor. These data pointed to a potential role of GATAD1 for the syncytium deficiency often associated with preeclamptic placentas. The sharp contrast of the methylation alterations for the closely positioned GATAD1 and HERVWE1 may provide a useful model for studying the accurate control of DNA methylation as well as their positive and negative impact on gene expression in placental trophoblasts.
Keywords: Syncytin-1, HERVWE1, Placental trophoblast, Preeclampsia, DNA methylation, GATA zinc finger domain containing 1, GATAD1
1. Introduction
Preeclampsia is the major cause of maternal and fetal morbidity and mortality during human pregnancy. Characterized by hypertension and proteinuria, preeclampsia occurs in 2–5% of pregnant women [1]. To date, the treatment of preeclampsia is limited to the control of blood pressure, assessment of fluid balance, prevention and management of complications. The only definitive cure for patients with preeclampsia is termination of pregnancy [2]. However, recent studies have linked the increased perinatal death and morbidity to premature delivery [3]. Although a number of etiological factors such as genetic predisposition [4], inflammation caused by immune attack against fetal antigens [5], and abnormality of the vasoactive compounds [4], have been considered the culprits of preeclampsia, the pathogenic mechanisms, especially the cellular and molecular pathways underlying the development of preeclampsia, remain poorly understood. This lack of knowledge is partially blamed for the slow development of new modalities for more effective prevention, risk evaluation, and treatment of this disease.
Placenta plays a central role for the fetal-maternal material exchange and pregnancy adaptation. Indeed, the disruption of placental barrier and endocrine functions has been observed under preeclamptic conditions [6, 7]. Most of the placental functions are carried out by syncytium composed of a continuous layer of intravillous syncytiotrophoblasts, or syncytiotrophoblasts for simplicity in this article. Syncytiotrophoblasts are formed via the fusion of cytotrophoblasts. Accumulated data indicated that syncytin-1, encoded by human endogenous retroviral family W Env(C7), member 1 (HERVWE1), mediates the fusion of cytotrophoblasts to form the multinucleated syncytiotrophoblasts [8]. Syncytin-1 is specifically expressed in placental trophoblast linage [9]. Decreased syncytin-1 expression is associated with the disrupted syncytium structure and function in preeclamptic placentas [6, 10], suggesting that dysregulation of synctin-1 may contribute to the pathogenesis of preeclampsia. Moreover, recent studies indicated that besides its fusogenic activity, syncytin-1 may carry nonfusogenic activities by regulating trophoblast proliferation [11] and apoptosis [12], and suppressing immune reactions against the semi-allogeneic fetoplacental unit [13]. For example, studies in choriocarcinoma BeWo cells indicated that insufficient levels of syncytin-1 may attenuate the G1/S transition of placental trophoblast, and decreased syncytin-1 levels in preeclamptic placentas may lead to the depletion of trophoblast “pool”, which will affect the repair or replacement of syncytium [11]. Thus, both the fusogenic and nonfusogenic activities may contribute to the pathologic changes observed in preeclamptic placentas.
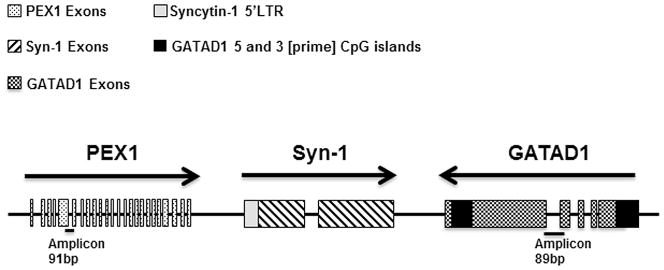
Previous studies have demonstrated a dynamic epigenetic regulation of syncytin-1 expression in placental trophoblasts. In non-placental cells, the 5′ LTR of synctin-1 gene is highly methylated and suppressed [14], whereas in placental trophoblasts the same region is demethylated [15]. Synctin-1 gene is located to chromosome 7q21.2. Interestingly, search of the syncytin-1 flanking regions in an 89.2 kb span revealed two additional genes (Fig. 1). Peroxisome biogenesis factor 1 gene (PEX1) resides upstream of syncytin-1, and GATA zinc finger domain containing 1 (GATAD1) is located immediate downstream of syncytin-1[16]. Like syncytin-1 gene, both PEX1 and GATAD1 genes contain typical CpG islands in their 5 and/or 3 [prime] regions, making them potential epigenetic regulation targets. Since epigenetic regulation tends to affect adjacent genes, based on the findings in syncytin-1, we questioned if these surrounding genes may also undergo alterations in their expression and DNA methylation patterns in preeclamptic placentas. In this study, we examined the expression levels of PEX1 and GATAD1 in three groups of placental samples, including those representing the first-trimester and third-trimester normal placentas, and third-trimester preeclamptic placenta. The comparison between first-trimester and third-trimester normal placentas will identify a trend of changes along normal placental development, whereas the comparison between normal and preeclamptic placentas will examine these genes’ relevance to preeclampsia pathogenesis. In addition, we measured the DNA methylation status among the three groups of samples to determine if epigenetic regulation may play a part. By expanding the investigation of preeclampsia-related epigenetic alterations to genomic regions surrounding syncytin-1, this study may help us to better understand the pathological mechanisms of preeclampsia. As far as we know, this is the first study to investigate PEX1 and GATAD1 expression and regulation in normal and preeclamptic placentas.
Fig. 1.
Schematic diagram of the positions and orientations of syncytin-1, PEX1 and GATAD1 genes. Arrows show genes’ orientations. The patterned squares represent exons. Dark squares indicate the location of the CpG islands in GATAD1 gene. Light grey square represents the syncytin-1 5′ LTR region. The solid lines at the bottom show the positions of amplicons of real-time PCR. Note the opposite orientations of GATAD1 and syncytin-1 genes, which bring the 3 [prime] region of GATAD1 to a closer vicinity of syncytin-1 gene.
2. Materials and methods
2.1 Placenta tissues collection
This study was reviewed and approved by the Mayo Clinic Institutional Review Board. Written consents were obtained from all study subjects. Eight first-trimester placentas (1N, gestational age ranging from 7 to 12 weeks) were obtained from legally induced abortion cases. Fourteen third-trimester placentas and seven preeclamptic placentas (3N and 3P respectively, gestational age ranging from 31 to 41 weeks) were collected after cesarean section. Preeclampsia was diagnosed according to the guidelines recommended by the American Congress of Obstetricians and Gynecologists. Placentas associated with serious maternal complications and fetal abnormalities were excluded from the study. Placental specimens were dissected from the central part of the maternal side of placentas. Part of the specimen was snapped frozen and stored at −80°C for DNA, RNA and protein isolation. The remaining part of the specimen was fixed with 4% paraformaldehyde and paraffin-embedded for immunohistochemistry.
2.2 Cell culture and 5-aza-deoxycytidine treatment
JAR cells were obtained from the American Type Culture Collection (Manassas, VA, USA), and grown in RPMI 1640 medium (HyClone Laboratories, Logan, UT, USA). The medium was supplemented with 10% fetal bovine serum, 100 μg/ml streptomycin and 100 μg/ml penicillin. Cell cultures were maintained at 37°C and 5% CO2. For 5-aza-deoxycytidine (ADC) treatment, cells were seeded at low density in six-well culture dishes and cultured overnight in normal growth medium to achieve 40–50% confluence. The next day, medium containing different concentrations (0.5 μM, 2.5 μM) of ADC was used to replace the regular growth medium. After 5 days of treatment with another change of ADC-containing medium, cells were harvested for extraction of RNA and genomic DNA.
2.3 RNA isolation, cDNA synthesis and quantitative real-time PCR
Total RNA was isolated from placental samples with the use of RNeasy Plus Mini Kit (Qiagen, Valencia, CA, USA). Reverse transcription was performed with High Capacity RNA-to-DNA Kit (ABI, Foster City, CA, USA) using 1 μg RNA in 20 μl volume reactions. The 20 μl cDNA product was diluted into 100 μl for later use. mRNA expression levels of target genes including PEX1 and GATAD1 were measured with the ABI 7900 Real-Time PCR System. The results were standardized with those from the β-actin internal reference gene. Real-time PCR was carried out in 12 μl reactions containing 6 μl of 2× SYBR Green PCR Master Mix (ABI, Foster city, CA, USA), 1 μl of forward primer, 1 μl of backward primer, 2 μl of DEPC H2O and 2 μl of diluted cDNA template, under the following conditions: initial denaturation at 95°C for 10 min, followed by 40 cycles of denaturation at 95°C for 15 sec, annealing and extension at 60°C for 1 min. The designation/sequences of PCR primers and the sizes of their correspondent amplicons are listed in Table 1. PCR products were resolved in 2.0% agarose gels and visualized by ethidium bromide staining to ascertain the accomplishment of specific amplification by PCR (Supplemental Figure 1). The threshold cycles (Ct) of each gene were determined in triplicate for each sample, averages and standard errors were calculated. The mRNA levels in 1N and 3P groups were expressed as relative folds over 3N group, which was set as 1 for clear data presentation.
TABLE 1.
Information of PCR primers
| Genes/Usage | Primer Sequences | Size of Product |
|---|---|---|
| PEX1/real-time PCR | Forward: AGCTGAGCTCTTTGGGAGGAGTGAA | 91 bp |
| Backward: TGCCGAGACAAAGGGCGTCC | ||
| GATAD1/real-time PCR | Forward: CGGGGGCGGCAAGCAGAGTAA | 89 bp |
| Backward: TTTCAGCAGCCGGAGCAGATTTGT | ||
| β-actin/real-time PCR | Forward: CGCGAGAAGATGACCCAGAT | 71 bp |
| Backward: ACAGCCTGGATAGCAACGTA | ||
| GATAD1 5 [prime]/COBRA | Forward: TGTYGGTGAAAGGATTAGGT | 254 bp |
| Backward: ACAACAAACRAAACTACAACAA | ||
| GATAD1 3 [prime]/COBRA | Forward: AATGATGAATTTATTTTAAAAT | 241 bp |
| Backward: AAACCAACCTAATCAACATAAA |
2.4 Western Blot Analysis
Proteins were extracted from placental tissues using RIPA buffer (Boston BioProducts, Boston, MA, USA) that was supplemented with PMSF and Halt™ Protease Inhibitor Cocktail (Thermal Scientific, Rockford, IL, USA). Protein concentrations were measured with the Bradford Assay. 40 μg of protein extracts were resolved in 15% polyacrylamide SDS gels, transferred to polyvinylidene fluoride membrane within the transfer buffer (Boston BioProducts, Boston, MA, USA). Protein detection was carried out with primary antibodies, including rabbit anti-GATAD1 (1:500, Bioss, Inc., Woburn, MA, USA), mouse anti-β-actin (1:6000, SIGMA-ALDRICH, Saint Louis, MO, USA) and the matching secondary, peroxidase-labeled, antibodies (Anti-rabbit or anti–mouse; 1:6000, Santa Cruz Biotechnology, Inc., Santa Cruz, CA, USA). Antibody detection and color development were carried out as previously published [11]. β-actin expression was detected in the same blot and the results provided protein loading controls.
2.5 Immunohistochemistry
For de-paraffinization and rehydration, the tissue sections were sequentially exposed to xylene (10 min ×3), 100% ethanol (5 min ×2), 95% ethanol (5 min ×2), 80% ethanol (5 min ×1), 70% ethanol (5 min ×1) and distilled water (5 min ×2). For antigen retrieval, the slides were immersed in preheated 10 mM citrate buffer (pH 6.0), incubated at 95°C for 20 min, and cooled down at room temperature for 30 min. After washing in PBS-T (5 min ×2), endogenous peroxidase was blocked with 3% H2O2 in methanol for 20 min at room temperature. After incubating in blocking solution (1% gelatin) for 1 hour at room temperature, the slides were incubated overnight at 4°C with rabbit antibody against GATAD1 (1:300, Bioss, Inc., Woburn, MA, USA). For negative control, slide was incubated with 1% gelatin instead of GATAD1 antibody. Secondary antibody binding was performed using biotinylated sheep IgG raised against rabbit IgG (1:400, Vector Laboratories, Burlingame, CA, USA). Following incubation with primary or secondary antibody the slides were thoroughly washed with PBS-T. Color development was carried out with the use of VECTASTAIN Elite ABC kits (Vector Laboratories, Burlingame, CA, USA) and Diaminobenzidine tetrahydrochloride (DAB) (Bethyl Laboratories, Inc., Montgomery, TX, USA) according to recommendations by the manufacturers. The tissue sections were counterstained with haematoxylin (Santa Cruz Biotechnology, Inc., Santa Cruz, CA, USA). Finally, sections were dehydrated through graded alcohol and xylene in a reverse order applied in de-paraffinization step, and coverslipped for observation.
2.6 DNA isolation and bisulfite modification
Genomic DNA was isolated from placentas or cell culture with Qiagen DNA mini Kit (Qiagen, Valencia, CA, USA). 1 μg genomic DNA was applied for bisulfite conversion. The conversion reaction and subsequent purification was performed with the use of Qiagen EpiTect Bisulfite Kit (Qiagen, Valencia, CA, USA) following the manufacturer’s instructions. Bisulfite-treated DNA was stored at −20°C for later experiments. The results of sequencing confirmed a 100 % cytosine-to-thymine conversion for cytosines from non-CpG dinucleotide contexts.
2.7 Combined bisulfite restriction analysis (COBRA) and bisulfate sequencing
Information of PCR primers used for COBRA was presented in Table 1. DNA fragments of 254 bp and 241 bp representing the GATAD1 5 [prime] and 3 [prime] CpG islands, respectively, were amplified in 30 μl reactions containing 10 pmol of each primer, 200 μM of each dNTP, 1.5 mmol/L MgCl2, 0.75 unit of HotStar Taq DNA Polymerase and 1× reaction buffer (Qiagen, Valencia, CA, USA), 1.5 μl of bisulfite-treated DNA as template. PCR cycling conditions were: 15 min at 95°C for initial denature, followed by 35 cycles of: 30 sec at 95°C for denaturation; 30 sec at 53°C or 47.2°C for GATAD1 5 [prime] or 3 [prime], respectively, for annealing; 30 sec at 72°C for extension; and a final extension step: 10 min at 72°C. The PCR products were digested using 2.5 units of restriction endonucleases BstUI (cut at CGCG) for 5 [prime] or TaqαI (Cut at TCGA) for 3 [prime], in a final volume of 15 μl. The optimal reaction conditions for BstUI were 1× NEBuffer 4 at 60°C for 3 hours, and for TaqαI were 1× NEBuffer 4 containing 1× bovine serum albumin at 65°C for 3 hours. The conditions and amounts of enzymes required for a complete digestion of PCR products were determined in the saturation digestion experiments using increasing amounts of enzymes (Supplemental Figure 2). Cleavage only occurs if the cytosines in the restriction sites are retained during the bisulfite modification as a result of methylation. The digested PCR products were separated in 2.0% agarose gels (Fermentas, Glen Burnie, MD, USA). Gel pictures were subject to densitometry analysis with Image J software (NIH, Bethesda, MD, USA). The methylation level methylation index) was calculated as a percentage of DNA representing the methylation genomic DNA (for 5 [prime]: 147 bp and 97 bp; for 3 [prime]: 97 bp and 144 bp) in total DNA representing both methylated and unmethylated GATAD1 (for 5 [prime]: 254 bp; for 3 [prime]: 241 bp).
The same PCR-amplified DNA fragments without restriction digestion were purified via agarose gel electrophoresis and subcloned into a plasmid vector using the Perfect PCR Cloning Kit (5 Prime, Gaithersburg, MD, USA) following the manufacturer’s instructions. Single and isolated colonies were picked to grow overnight culture in Luria-Bertani (LB) Broth medium. Plasmid DNA was purified with QIAprep Spin Miniprep Kit (Qiagen, Valencia, CA, USA). EcoR-I positive clones containing the insert with the expected size were sent to ACGT, Inc. (Wheeling, IL, USA) for DNA sequencing.
2.8 Statistical analysis
All statistical analyses were performed using the SPSS 19.0 statistics package (SPSS, Chicago, IL, USA). Student’s t test was used to compare the quantitative data between 1N and 3N or between 3N and 3P groups. Values were shown as mean ± SE. Spearman’s rank correlation analysis was performed for linear regression analysis. Statistical significance was set at the level of p < 0.05.
3. Results
3.1 Expression of PEX1 and GATAD1 genes in placental tissues
By experimental design, this study covers three groups of placental samples, the first-trimester normal placentas (1N), third-trimester normal placentas (3N), and third-trimester preeclamptic placentas (3P). Our analyses on both gene expression and DNA methylation levels were concentrated on two pairs of comparison: First, comparison between 1N and 3N groups, which represent the early and late stages of normal placentas, respectively, would help us to understand the physiological modulation of gene expression and DNA methylation along the placental maturation during normal pregnancy. Second, samples of 3P and 3N groups were all from the third-trimester, and comparison between these two groups will help us to identify the pathological alterations in gene expression and the correspondent DNA methylation status associated with the development of preeclampsia.
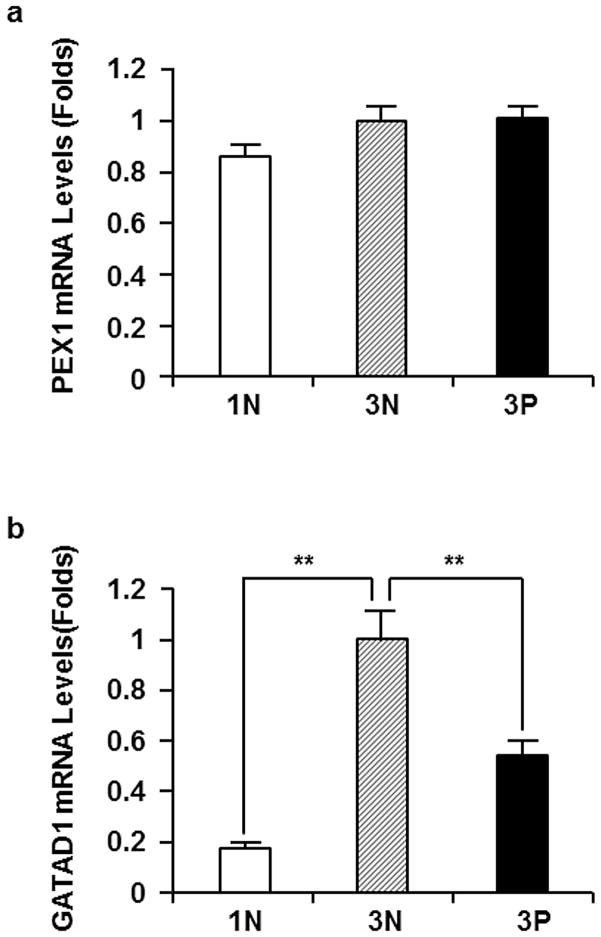
To determine the expression of PEX1 and GATAD1 genes, we performed real-time PCR on all the placental mRNA samples. While no significant difference in PEX1 mRNA expression was detected between 1N and 3N, or 3N and 3P (Fig. 2a), a five-fold increase in GATAD1 mRNA levels was found in 3N compared to 1N. More interestingly, a two-fold decrease of GATAD1 mRNA levels was observed in 3P when compared to 3N group (p < 0.05) (Fig. 2b). Based on this data, we elected not to pursue further investigation on PEX1 gene, but focus on GATAD1 gene in the downstream experiments.
Fig. 2.
PEX1 and GATAD1 mRNA levels in first-trimester (1N, n=8), third-trimester normal (3N, n=14) and third-trimester preeclamptic (3P, =7) placentas. Real-time PCR were performed as described in Materials and methods. Data were standardized by the results from β-actin internal control. The mRNA levels from third-trimester normal (3N) placentas were set as 1. The averages and standard errors of each group were presented. a PEX1 mRNA levels. No significant difference was found between 1N and 3P, or 3N and 3P groups. b GATAD1 mRNA levels. Significantly higher GATAD1 mRNA levels were observed in 3N than in 1N; A significant reduction of GATAD1 mRNA levels were found in 3P compared to 3N group. **p < 0.01.
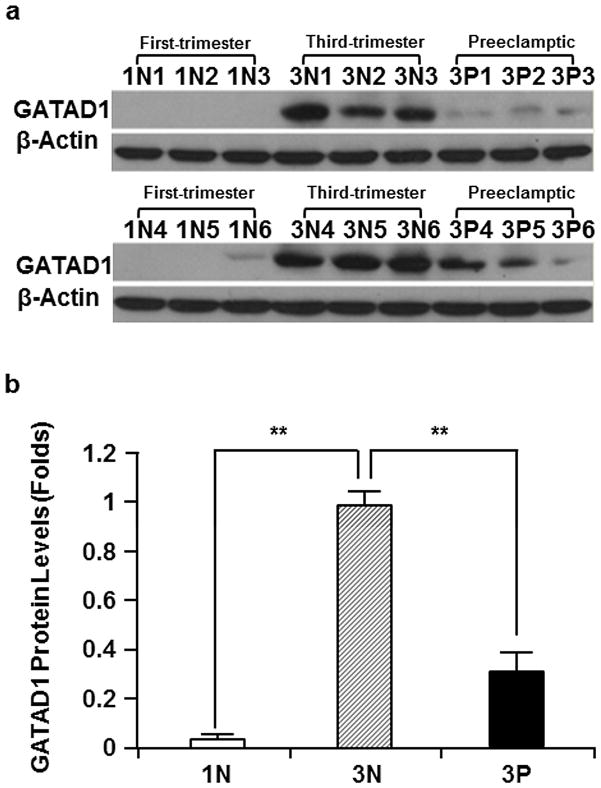
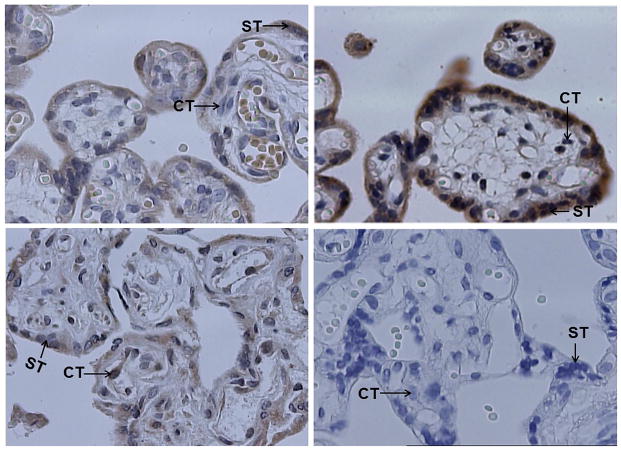
To examine the expression changes in GATAD1 protein, we performed Western blot analysis and immunohistochemistry on normal and preeclamptic placentas. Consistent with the changes in mRNA levels described above, the results showed that GATAD1 protein expression was significantly higher in 3N than 1N, and was significantly lower in 3P than 3N (Fig. 3). Immunohistochemistry showed that GATAD1 expression was limited to trophoblast linage, especially syncytiotrophoblasts. GATAD1 protein was primarily localized in the cytoplasm and cell membrane. Comparison among the three groups indicated that third-trimester placentas contained more intensive staining signals than first-trimester placentas. In addition, preeclamptic placentas displayed less intensive staining signals than normal placentas (Fig. 4). GATAD1 is a transcription factor containing a zinc finger DNA-binding domain. By modulating the expression of multiple downstream target genes, GATAD1 may regulate the function of trophoblast linage. Its concentrated expression in trophoblasts and the significant alterations indicated this transcription factor may be involved in the maturation of placenta as well as the pathogenesis of preeclampsia.
Fig. 3.
Protein levels of GATAD1 in the first-trimester (1N1-1N6), third-trimester normal (3N1-3N6), and third-trimester preeclamptic (3P1-3P6) placentas. The sizes of GATAD1 and β-actin proteins are 29 kDa and 42 kDa, respectively. a Western blotting performed using GATAD1-specifc antibodies. b Results of densitometry analyses showing a similar trend of changes to that of mRNA levels: GATAD1 protein expression was higher in 3N than 1N, and lower in 3P than 3N. The GATAD1 expression data were standardized by the results from β-actin. The protein levels from third-trimester normal (3N) placentas were set as 1. The averages and standard errors from each group were presented. **p < 0.01.
Fig. 4.
Representative results of immunohistochemistry (40×10). The paraffin-embedded placental tissues were sliced into 4 μm sections. The sections were processed as describe under Materials and methods. As negative control (bottom right panel), a section of first-trimester normal placenta was processed with the same procedures except for the absence of primary antibodies. GATAD1 protein was stained brown color. The nuclei were stained blue with haematoxylin. GATAD1 protein localized mostly in the cytoplasm and membrane of syncytiotrophoblasts (ST), and to a less extent, the cytoplasm and membrane of cytotrophoblasts (CT). Higher level of GATAD1 expression was found in third-trimester (upper right) than first-trimester (upper left panel) placenta. Preeclamptic (bottom left) placentas expressed decreased levels of GATAD1 protein compared to normal placentas.
3.2 COBRA and bisulfate sequencing analyses on GATAD1 gene methylation
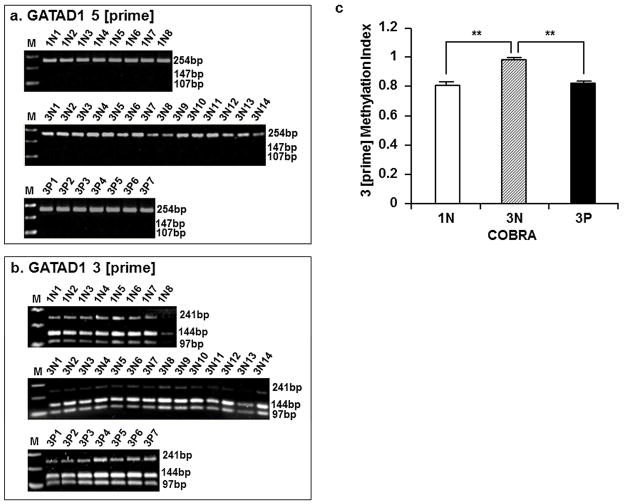
There are two CpG islands in the GATAD1 gene, located at the 5 [prime] and 3 [prime] regions, respectively. Combined Bisulfite Restriction Analysis (COBRA) was performed to evaluate DNA methylation status of these regions. The results showed that GATAD1 5 [prime] was largely unmethylated in all the placental samples of 1N, 3N and 3P groups (Fig. 5a). In contrast, the 3 [prime] region was heavily methylated in placental tissues. Quantification of the COBRA results showed some moderate, but statistically significant changes of DNA methylation in this region. Specifically, a higher level of DNA methylation was observed in 3N compared to 1N group (p<0.05) (Fig. 5, b and c). Comparison between 3N and 3P samples indicated a significantly decreased methylation in 3P than 3N group. Surprisingly, in contrary to frequently observed inhibitory effects of methylation on gene expression, an increased DNA methylation in the 3 [prime] region appeared to be associated with an elevated level of GATAD1 expression.
Fig. 5.
GATAD1 gene methylation measured by COBRA. Following PCR amplification, DNA fragments representing the 5 [prime] and 3 [prime] regions of GATAD1 gene were digested with an excess of BstUI or TaqαI, respectively. Agarose gel electrophoresis was performed and DNA bands were visualized by ethidium bromide staining. a The absence of cleavage product (supposedly 147 bp and 107 bp) from 254 bp fragment indicated an largely unmethylated status of GATAD1 5 [prime] region in first-trimester (1N1 to 1N8), third-trimester normal (3N1 to 3N14) and Preeclamptic (3P1 to 3P7) placentas. b The 241 bp fragment representing the 3 [prime] region of GATAD1 was mostly cleaved, generating the 144 bp and 97 bp bands indicative of DNA methylation. c Densitometry analyses of the 3 [prime] methylation showing an increased methylation in 3N placentas compared to 1N, and decreased methylation levels in 3P placentas compared to 3N group. ** p < 0.01.
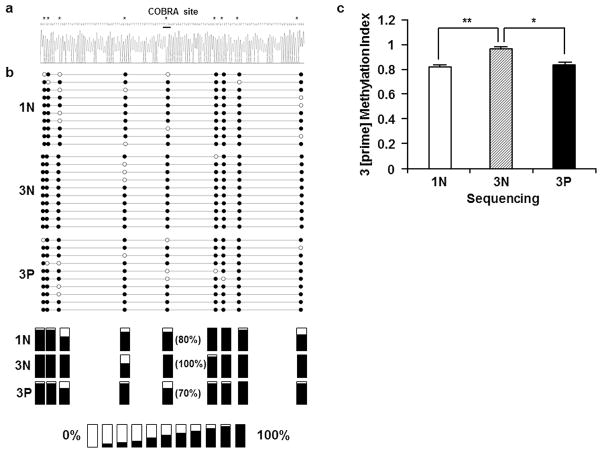
To confirm the COBRA results, a 241 bp fragment of GATAD1 3 [prime] containing 9 CpG dinucleotides was PCR-amplified from bisulfate-converted genomic DNA, subcloned into plasmid vector, and sequenced. Generally, varied methylation levels were observed among these CpG sites (Fig. 6). In addition, these CpG sites appeared to exhibit different levels of methylation versatility among the three groups. The CpG 3, 4, 5 and 9 seemed to be relatively more versatile than the rest of CpG sites. Despite the individual variations among these CpG sites, the average methylation levels for each of the three groups were in good agreement with the data obtained from COBRA (Fig. 5c and 6c). In fact, regression analysis on the COBRA and sequencing results of individual samples showed a highly significant correlation between the two assays (data not shown), supporting the reliability of data from COBRA and direct sequencing. Thus, the sequencing data has confirmed the increased GATAD1 3 [prime] DNA methylation in 3N compared to 1N, and a decreased GATAD1 3 [prime] DNA methylation in 3P compared to 3N group.
Fig. 6.
Bisulfite sequencing of the GATAD1 3 [prime] region. Bisulfite-converted DNA from 1N (n=5), 3N (n=5) and 3P (n=5) groups were PCR amplified, subcloned, and sequenced. a The typical sequencing result of the 3 [prime] region. Asterisks (*) mark CpG sites. The TaqαI recognition site used in COBRA is underlined. b GATAD1 3 [prime] bisulfate sequencing results. The solid and open circles represent the methylated and unmethylated cytosines, respectively, in CpGs dinucleotides contexts. The average methylation levels for each CpG site were presented in the bottom panels. c Quantitative comparison of the GATAD1 3 [prime] methylation among the three groups. 3N placentas displayed increased methylation levels compared to 1N, and 3P group exhibited decreased methylation levels compared to 3N. * p < 0.05; ** p < 0.01.
3.3 Positive correlation between GATAD1 expression and DNA methylation levels
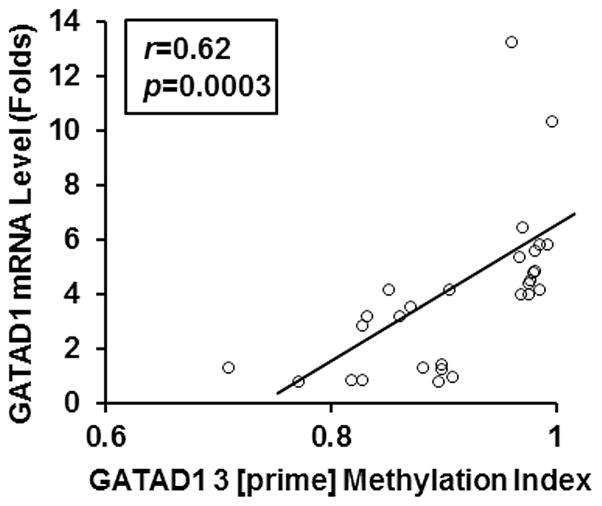
To qualitatively analyze the relationship between GATAD1 expression and 3 [prime] methylation, we performed Spearman regression analysis on the real-time PCR and COBRA data from all the 29 placental samples studied. As shown in Fig. 7, the results confirmed a statistically significant positive correlation between GATAD1 mRNA levels and 3 [prime] DNA methylation (r=0.62, p=0.0003). As explained under Disscussion, despite its rare occurrence, positive regulation of DNA methylation on gene expression has been observed in certain genes, and this mode of action could be mediated by distinct mechanisms.
Fig. 7.
The correlation between GATAD1 expression and GATAD1 3 [prime] methylation in human placentas (n=29). The Y-axis indicated GATAD1 mRNA levels and the X-axis represented GATAD1 3 [prime] methylation index. Spearman correlation analysis showed a highly significant positive correlation between GATAD1 mRNA levels and GATAD1 3 [prime] methylation levels among placental samples (r=0.62, p=0.0003).
3.4 Examination of the effect of GATAD1 methylation on gene expression by 5-aza-deoxycytidine treatment
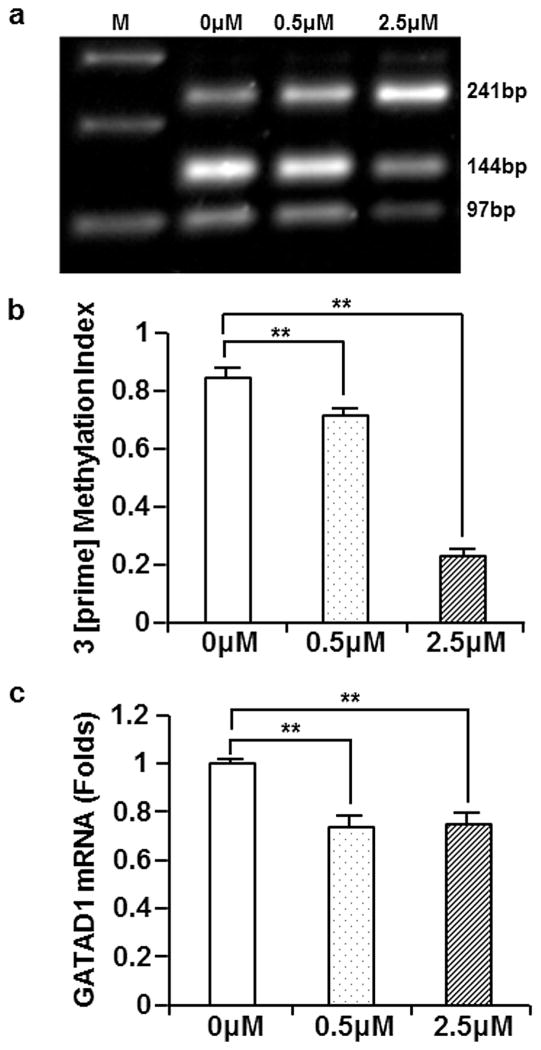
JAR cell line is a choriocarcinoma cell line frequently used as an in vitro study model for placental gene expression. To investigate the potentially causal relationship between GATAD1 methylation and expression, we treated JAR cell line with a DNMT inhibitor, 5-aza-deoxycytidine (ADC). The GATAD1 3 [prime] methylation status and expression levels were subsequently determined with the use of COBRA and real-time PCR, respectively. As expected, ADC treatment led to a significant reduction in GATAD1 3 [prime] methylation compared to the control group (Fig. 8, a and b). A correspondent decrease in GATAD1 mRNA was observed following ADC treatment (Fig. 8c). These results corroborated the findings from patient samples, and provided additional evidence in support of an upregulation of GATAD1 by the methylation of its 3 [prime] CpG island.
Fig. 8.
Treatment with DNMT inhibitor led to a decreased GATAD1 3 [prime] DNA methylation and decreased GATAD1 expression. JAR cells were treated for 5 days with 0, 0.5, and 2.5 μM of 5-aza-deoxycytidine (ADC). a GATAD1 3 [prime] methylation was examined with COBRA. b Densitometry analyses indicated a dose-dependent decrease of GATAD1 3 [prime] DNA methylation following ADC treatment. c Results of real-time PCR showed a decrease of GATAD1 mRNA expression following ADC treatment. Data were standardized with the results from β-actin. Averages and standard errors were presented in the chart. **p < 0.01.
4. Discussion
Previous studies have shown that the tissue specific expression of syncytin-1 in placental trophoblasts is controlled by DNA methylation [15]. In addition, the dynamic expression changes of syncytin-1, e.g., reduced mRNA and protein levels in preeclamptic placentas, is also closely associated with the changes in the methylation of 5′ LTR that serves as part of promoter of syncytin-1 gene [9, 17]. Potential involvements of syncytin-1 expression in the dysfunction of preeclamptic placenta are readily explained by its fusogenic and nonfusogenic activities [8, 18]. The close genomic location of PEX1, GATAD1 and syncytin-1 raised the possibility for a complex co-regulation of these genes by a concerted epigenetic program. We have begun exploration of this new area by assessing the expression and DNA methylation patterns of adjacent genes in clinical samples as well as cell lines. Current findings on the significant alterations of GATAD1 expression and methylation patterns have expanded our knowledge to the genes immediately up- and down-stream of syncytin-1.
PEX1 is a member of ATPases associated with diverse cellular activities (AAA) protein family. AAA proteins contain a highly conserved ATPase module of 200–250 amino acids. They are involved in a range of processes, including DNA replication, protein degradation, membrane fusion, microtubule severing, peroxisome biogenesis, signal transduction and the regulation of gene expression [19]. PEX1 anchors to a peroxisomal membrane where it may play a part in the import of proteins into the peroxisome [20]. Peroxisome contains enzymes for the clearance of cytoplasmic fatty acids and toxic compounds. This organelle also facilitates the absorption of fat-soluble vitamins [21, 22]. Genetic mutation of PEX1 is associated with Zellweger syndrome characterized by impaired neuronal migration/positioning, and abnormal brain development as manifested by craniofacial abnormalities, hepatomegaly chondrodysplasia punctate, eye abnormalities, and renal cysts [20, 23]. Newborns may present with profound hypotonia, seizures, apnea, and an inability to eat [24]. No data concerning specific function of PEX1 in placenta and preeclampsia is currently available. Our results showing a lack of significant changes in PEX1 expression between the first- and third-trimester placentas and between preeclamptic and normal placentas pointed to the unlikeliness for PEX1 to be a dominant factor with direct impact on the placental physiopathology.
GATAD1 (GATA zinc finger domain containing 1) is also designated as ODAG (ocular development-associated gene) based on its involvement in the ocular development in mouse [25]. GATAD1 is differentially expressed in various types of tissues [26]. Through its binding to DNA via the zinc finger domain located at the N-terminus GATAD1 may interact with histone H3K4me3 and activate gene transcription [27, 28]. A thorough literature search found no publication regarding GATAD1 expression and function in trophoblasts or placentas. It has been reported that trophoblast deficiency by elevated apoptosis and possibly compromised cell proliferation may contribute to the recessive syncytium frequently observed in preeclamptic placentas [11, 29]. Transcription factors, with their capability to control the expression of a variety of target genes, often serve as regulators of cell cycle and apoptosis. For example, Rel/NF-kappaB transcription factors play a role in the control of cell apoptosis [30]. Here we demonstrated that GATAD1 expression was readily detected in the trophoblastic lineage. Equipped with DNA-binding activity, GATAD1 may participate in the modulation of placental gene expression and function. Moreover, our findings on the increasing expression of GATAD1 expression along placenta maturation and decreased expression in preeclamptic placentas pointed to a significant physiopathological role of this factor in human placenta. Further investigation along this line, e.g., identification of GATAD1 target genes in trophoblasts and confirmation of its binding to gene promoters, is required to understand its exact function in human placenta as well as the impact of its aberrant methylation on the pathogenesis of preeclampsia.
The current studies revealed a divergent methylation pattern of GATAD1 gene in the 5 [prime] and 3 [prime] regions. While the CpG sites in 5 [prime] remained largely unmethylated in either normal or preeclamptic placentas, the 3 [prime] region was heavily methylated. Moreover, this region was significantly hypermethylated in third-trimester placentas compared to first-trimester placentas. Furthermore, preeclamptic placentas contained decreased methylation levels than normal placentas. The positive correlation between GATAD1 methylation and expression was subsequently confirmed by in vitro experiment using JAR, a cell line of trophoblastic origin. Treatment with ADC led to a significant reduction of GATAD1 3 [prime] methylation and a correspondent decrease in its mRNA expression. Such rare cases of gene activation by DNA methylation may be explained by a “derepression” mechanism. When repressive cis-element is present in a gene promoter, its methylation may reduce the negative charge of the DNA duplex, leading to inhibition of interaction between trans-repressor and its target DNA elements. Demethylation, on the other hand, will promote the binding of trans-repressor to the repressive cis-element, and results in gene downregulation. One such example was observed in the regulation of IGF2-H19 [31]. DNA methylation blocked CTCF, a methylation-sensitive insulator, binding to H19 imprinting control region (ICR), hence, to allow the enhancers interact with the IGF2-H19 promoters, leading to upregulation of IGF2-H19 transcription. By this consideration, GATAD1 3 [prime] may harbor a negative regulatory region and its demethylation may increase its repressive activity to cause a GATAD1 downregulation, as observed in preeclamptic placentas
It has also been reported that unlike DNA methylation in the promoter region, methylation of gene body tend to impose positive impact on gene expression [32]. Capped analysis of gene expression (CAGE) showed that transcription is often initiated from multiple sites [33, 34], which may result in installation of transcription from an authentic site. Gene body methylation could inhibit the spurious transcription and promote transcription from the authentic site [32]. Indeed, the GATAD1 3 [prime] CpG island is located in the last exon of GATAD1 gene. Thus, by this mechanism the demethylation in GATAD1 3 [prime] may lead to decreased GATAD1 expression in preeclamptic placenta. Epigenetic regulation by DNA methylation is a complex issue involving concerted actions by multiple cis-elements, DNA-binding factors such as transcriptional activators/repressors, methyl-CpG-binding domain (MDB) factors, and a range of histone modifications. The exact mechanism underlying the position effects of DNA methylation on GATAD1 expression is a subject of further investigation.
One interesting notion comes from the comparison of the gene localization, expression and methylation alterations between GATAD1 and synctyin-1. The opposite orientation of GATAD1 gene to that of syncytin-1 places the 3 [prime] CpG island of GATAD1 in a close vicinity to syncytin-1 gene, a known target for epigenetic regulation. Despite their adjacent arrangement, the methylation changes of the two genes display a sharp contrast in preeclamptic placentas, that is, a reduction in GATAD1 3 [prime] region and an increase in syncytin-1 5′ LTR. The divergent methylation patterns of two methylation targets in a close distance clearly highlight the tight and accurate nature in the control of DNA methylation. Besides their functional implication for the development of preeclampsia, the sharp contrast of the methylation alterations in the two genes may provide an excellent model for investigating the precise targeting mechanism of DNA methylation as well as the positive and negative regulation of gene expression by DNA methylation.
Supplementary Material
Highlights.
Syncytin-1 is a well-established target for epigenetic regulation in placental trophoblasts.
GATAD1 is a transcription factor located immediate downstream of syncytin-1.
GATAD1 downregulation and DNA hypomethylation are found in preeclamptic placentas.
GATAD1 epigenetic regulation may play a role(s) for placental pathophysiology.
Acknowledgments
The authors would like to express their appreciation for Mrs. Bridgette mills (Mercer University School of Medicine) and Mrs Lynn Caflisch (Mayo Clinic) for their superb secretary assistance.
This project was completed at Mercer University School of Medicine Savannah Campus with the support from the following funding sources: The NIH R01 grant HD41577 (S-W Jiang); The Georgia Research Alliance Distinguished Cancer Scholar Funding (S-W Jiang); Natural Science Foundation of China (30772332, 81272871, W Cheng); Natural Foundation of Science and Technology/Jiangsu Providence (BK2010576, W Cheng); Jiangsu Six Summit Talent Foundation (303070774IB09, W Cheng). The Department of Obstetrics and Gynecology Chair’s Discretionary Fund (S-W Jiang); The research support and seed fund from Mercer University (S-W Jiang, Jinping Li).
Footnotes
Publisher's Disclaimer: This is a PDF file of an unedited manuscript that has been accepted for publication. As a service to our customers we are providing this early version of the manuscript. The manuscript will undergo copyediting, typesetting, and review of the resulting proof before it is published in its final citable form. Please note that during the production process errors may be discovered which could affect the content, and all legal disclaimers that apply to the journal pertain.
References
- 1.Bezerra Maia EHMS, Marques Lopes L, Murthi P, da Silva Costa F. Journal of pregnancy. 2012;2012:435090. doi: 10.1155/2012/435090. [DOI] [PMC free article] [PubMed] [Google Scholar]
- 2.Arulkumaran NL. Lightstone Best practice & research. Clinical obstetrics & gynaecology. 2013 [Google Scholar]
- 3.Moster D, Lie RT, Markestad T. The New England journal of medicine. 2008;359:262–273. doi: 10.1056/NEJMoa0706475. [DOI] [PubMed] [Google Scholar]
- 4.Jebbink J, Wolters A, Fernando F, Afink G, van der Post J, Ris-Stalpers C. Biochimica et biophysica acta. 2012;1822:1960–1969. doi: 10.1016/j.bbadis.2012.08.004. [DOI] [PubMed] [Google Scholar]
- 5.Saito S, Shiozaki A, Nakashima A, Sakai M, Sasaki Y. Molecular aspects of medicine. 2007;28:192–209. doi: 10.1016/j.mam.2007.02.006. [DOI] [PubMed] [Google Scholar]
- 6.MacLennan AH, Sharp F, Shaw-Dunn J. The ultrastructure of human trophoblast in spontaneous and induced hypoxia using a system of organ culture. A comparison with uultrastructural changes in pre-eclampsia and placental insufficiency. J Obstet Gynaecol Br Commonw. 1972;79:113–121. [PubMed] [Google Scholar]
- 7.Jobe SO, Tyler CT, Magness RR. Hypertension. 2013;61:480–487. doi: 10.1161/HYPERTENSIONAHA.111.201624. [DOI] [PMC free article] [PubMed] [Google Scholar]
- 8.Dupressoir A, Heidmann T. Medecine sciences: M/S. 2011;27:163–169. doi: 10.1051/medsci/2011272163. [DOI] [PubMed] [Google Scholar]
- 9.Zhuang XW, Li J, Brost BC, Xia XY, Wang CX, Jiang SW. Current pharmaceutical design. 2013 doi: 10.2174/13816128113199990541. [DOI] [PubMed] [Google Scholar]
- 10.Lee X, Keith JC, Jr, Stumm N, Moutsatsos I, McCoy JM, Crum CP, Genest D, Chin D, Ehrenfels C, Pijnenborg R, van Assche FA, Mi S. Placenta. 2001;22:808–812. doi: 10.1053/plac.2001.0722. [DOI] [PubMed] [Google Scholar]
- 11.Huang Q, Li J, Wang F, Oliver MT, Tipton T, Gao Y, Jiang SW. Cellular signalling. 2013;25:1027–1035. doi: 10.1016/j.cellsig.2013.01.008. [DOI] [PMC free article] [PubMed] [Google Scholar]
- 12.Langbein M, Strick R, Strissel PL, Vogt N, Parsch H, Beckmann MW, Schild RL. Molecular reproduction and development. 2008;75:175–183. doi: 10.1002/mrd.20729. [DOI] [PubMed] [Google Scholar]
- 13.Noorali S, Rotar IC, Lewis C, Pestaner JP, Pace DG, Sison A, Bagasra O. Applied immunohistochemistry & molecular morphology: AIMM/official publication of the Society for Applied Immunohistochemistry. 2009;17:319–328. doi: 10.1097/PAI.0b013e31819640f9. [DOI] [PubMed] [Google Scholar]
- 14.Matouskova M, Blazkova J, Pajer P, Pavlicek A, Hejnar J. Experimental cell research. 2006;312:1011–1020. doi: 10.1016/j.yexcr.2005.12.010. [DOI] [PubMed] [Google Scholar]
- 15.Gimenez J, Montgiraud C, Oriol G, Pichon JP, Ruel K, Tsatsaris V, Gerbaud P, Frendo JL, Evain-Brion D, Mallet F. DNA research: an international journal for rapid publication of reports on genes and genomes. 2009;16:195–211. doi: 10.1093/dnares/dsp011. [DOI] [PMC free article] [PubMed] [Google Scholar]
- 16.Bonnaud B, Beliaeff J, Bouton O, Oriol G, Duret L, Mallet F. Retrovirology. 2005;2:57. doi: 10.1186/1742-4690-2-57. [DOI] [PMC free article] [PubMed] [Google Scholar]
- 17.Ruebner M, Strissel PL, Ekici AB, Stiegler E, Dammer U, Goecke TW, Faschingbauer F, Fahlbusch FB, Beckmann MW, Strick R. PloS one. 2013;8:e56145. doi: 10.1371/journal.pone.0056145. [DOI] [PMC free article] [PubMed] [Google Scholar]
- 18.Holder BS, Tower CL, Forbes K, Mulla MJ, Aplin JD, Abrahams VM. Immunology. 2012;136:184–191. doi: 10.1111/j.1365-2567.2012.03568.x. [DOI] [PMC free article] [PubMed] [Google Scholar]
- 19.Snider J, Thibault G, Houry WA. Genome biology. 2008;9:216. doi: 10.1186/gb-2008-9-4-216. [DOI] [PMC free article] [PubMed] [Google Scholar]
- 20.Sun Y, Wang L, Wei X, Zhu Q, Yang Y, Lan Z, Qu N, Chu Y, Wang Y, Yang S, Liang Y, Wang W, Yi X. Clinica chimica acta; international journal of clinical chemistry. 2013;417:57–61. doi: 10.1016/j.cca.2012.12.005. [DOI] [PubMed] [Google Scholar]
- 21.Wanders RJ. American journal of medical genetics Part A. 2004;126A:355–375. doi: 10.1002/ajmg.a.20661. [DOI] [PubMed] [Google Scholar]
- 22.Shiozawa K, Maita N, Tomii K, Seto A, Goda N, Akiyama Y, Shimizu T, Shirakawa M, Hiroaki H. The Journal of biological chemistry. 2004;279:50060–50068. doi: 10.1074/jbc.M407837200. [DOI] [PubMed] [Google Scholar]
- 23.Breitling R. BMC pediatrics. 2004;4:5. doi: 10.1186/1471-2431-4-5. [DOI] [PMC free article] [PubMed] [Google Scholar]
- 24.Steinberg SJ, Dodt G, Raymond GV, Braverman NE, Moser AB, Moser HW. Biochimica et biophysica acta. 2006;1763:1733–1748. doi: 10.1016/j.bbamcr.2006.09.010. [DOI] [PubMed] [Google Scholar]
- 25.Tsuruga T, Kanamoto T, Kato T, Yamashita H, Miyagawa K, Mishima HK. Gene. 2002;290:125–130. doi: 10.1016/s0378-1119(02)00563-2. [DOI] [PubMed] [Google Scholar]
- 26.Theis JL, Sharpe KM, Matsumoto ME, Chai HS, Nair AA, Theis JD, de Andrade M, Wieben ED, Michels VV, Olson TM. Circulation Cardiovascular genetics. 2011;4:585–594. doi: 10.1161/CIRCGENETICS.111.961052. [DOI] [PMC free article] [PubMed] [Google Scholar]
- 27.Vermeulen M, Eberl HC, Matarese F, Marks H, Denissov S, Butter F, Lee KK, Olsen JV, Hyman AA, Stunnenberg HG, Mann M. Cell. 2010;142:967–980. doi: 10.1016/j.cell.2010.08.020. [DOI] [PubMed] [Google Scholar]
- 28.Levy D, Gozani O. Cell. 2010;142:844–846. doi: 10.1016/j.cell.2010.08.032. [DOI] [PMC free article] [PubMed] [Google Scholar]
- 29.Naicker T, Dorsamy E, Ramsuran D, Burton GJ, Moodley J. Hypertension in pregnancy: official journal of the International Society for the Study of Hypertension in Pregnancy. 2013;32:245–256. doi: 10.3109/10641955.2013.796969. [DOI] [PubMed] [Google Scholar]
- 30.Barkett M, Gilmore TD. Oncogene. 1999;18:6910–6924. doi: 10.1038/sj.onc.1203238. [DOI] [PubMed] [Google Scholar]
- 31.Dejeux E, Olaso R, Dousset B, Audebourg A, Gut IG, Terris B, Tost J. Endocrine-related cancer. 2009;16:939–952. doi: 10.1677/ERC-08-0331. [DOI] [PubMed] [Google Scholar]
- 32.Jjingo D, Conley AB, Yi SV, Lunyak VV, Jordan IK. Oncotarget. 2012;3:462–474. doi: 10.18632/oncotarget.497. [DOI] [PMC free article] [PubMed] [Google Scholar]
- 33.Carninci P, Sandelin A, Lenhard B, Katayama S, Shimokawa K, Ponjavic J, Semple CA, Taylor MS, Engstrom PG, Frith MC, Forrest AR, Alkema WB, Tan SL, Plessy C, Kodzius R, Ravasi T, Kasukawa T, Fukuda S, Kanamori-Katayama M, Kitazume Y, Kawaji H, Kai C, Nakamura M, Konno H, Nakano K, Mottagui-Tabar S, Arner P, Chesi A, Gustincich S, Persichetti F, Suzuki H, Grimmond SM, Wells CA, Orlando V, Wahlestedt C, Liu ET, Harbers M, Kawai J, Bajic VB, Hume DA, Hayashizaki Y. Nature genetics. 2006;38:626–635. doi: 10.1038/ng1789. [DOI] [PubMed] [Google Scholar]
- 34.Maunakea AK, Nagarajan RP, Bilenky M, Ballinger TJ, D’Souza C, Fouse SD, Johnson BE, Hong C, Nielsen C, Zhao Y, Turecki G, Delaney A, Varhol R, Thiessen N, Shchors K, Heine VM, Rowitch DH, Xing X, Fiore C, Schillebeeckx M, Jones SJ, Haussler D, Marra MA, Hirst M, Wang T, Costello JF. Nature. 2010;466:253–257. doi: 10.1038/nature09165. [DOI] [PMC free article] [PubMed] [Google Scholar]
Associated Data
This section collects any data citations, data availability statements, or supplementary materials included in this article.


