Abstract
Placental syncytiotrophoblasts formed by the fusion of cytotrophoblasts constitute the interface between maternal and fetal circulations. The syncytium, composed of a continuous layer of syncytiotrophoblasts, assumes the fetal-maternal nutrient exchange, placental barrier, and endocrine functions important for the maintenance of normal pregnancy. Syncytin-1, an endogenous retroviral gene product, mediates the fusion of cytotrophoblasts. While the fusogenic function of syncytin-1 has been well established, little is known regarding its nonfusogenic activities. This study investigates the role of syncytin-1 in trophoblast proliferation. We found that syncytin-1 knockdown significantly inhibited BeWo cell growth and DNA synthesis. Moreover, time course studies on key cell cycle regulators demonstrated an upregulation of p15 and downregulation of CDK4, E2F1, PCNA, and c-Myc, which consequently led to a reduced level of CDK1. These results, together with those from flowcytometry analysis, indicated that syncytin-1 knockdown blocked the G1/S transition phase of the cell cycle. Moreover, syncytin-1 overexpression promoted CHO cell proliferation and led to changes opposite to those observed in syncytin-1 knockdown experiments, confirming the critical role of syncytin-1 for G1/S transition. Thus, syncytin-1, through both nonfusogenic and fusogenic, functions, may co-regulate the input (proliferation) and output (fusion) of the cytotrophoblast “pool”. Such co-regulation could be an efficient way to achieve the balance between these two opposing processes, which is required for syncytium homeostasis. Since decreased syncytin-1 expression has been shown to be associated with preeclamptic and hypoxic condition, insufficient replenishing of the cytotrophoblast “pool” may contribute to syncytium deficiency, a critical pathological change frequently found in preeclamptic placentas.
Keywords: syncytin-1, cell cycle, syncytium, placenta, preeclampsia, G1/S transition, trophoblast, syncytiotrophoblast, nonfusogenic, fusion
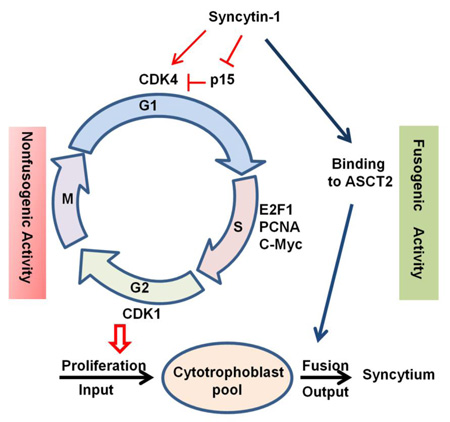
Graphical abstract
1. Introduction
The placenta is an organ physically and functionally connecting the developing fetus to the mother. Placental anomalies are frequently observed in abnormal pregnancies. Smaller placentas have been found in pregnancies associated with severe preeclampsia, IUGR, and premature birth [1, 2]. Much of the placental function, including fetal-maternal exchange, barrier function to separate the fetal and maternal circulations, and endocrine activities, is carried out by syncytium, a continuous layer of multinucleated syncytiotrophoblasts covering the entire maternal surface of the placenta [3]. One important pathological change related to preeclampsia is the syncytium deficiency. Thinner, discontinued, and damaged syncytium has been observed in placentas from preeclamptic pregnancies [4]. In preeclampsia, deficiencies of endocrine function in the syncytium are evident by decreased maternal serum levels of hCS and placental protein 13 [5]. The mechanism(s) underlying syncytium deficiency is a subject of intensive research. Increased trophoblast apoptosis has been detected in preeclamptic placentas [6]. Conceivably, unbalanced cell proliferation and cell death could be a potential cause of syncytium deficiency. The focus of the current study is to investigate how syncytin-1, a placenta-specific factor controlling cell fusion and terminal differentiation, regulates trophoblast cell proliferation.
In the human placenta, syncytiotrophoblasts are formed by the fusion of villous cytotrophoblasts. Cell fusion is a well orchestrated process known to be mediated by the interaction between syncytin-1, an endogenous retroviral envelope protein, and its receptor, ASCT2, both located on the cell membrane [7, 8]. Under physiological conditions, syncytin-1 expression is restricted to the placental trophoblast linage. During pregnancy when placental size and function are rapidly expanding, syncytin-1 expression continues to rise from the first to third trimesters [9]. Repeated cycles of hypoxia-reoxygenation due to insufficient vasculature of the spiral arteries are believed to be a major pathological factor for preeclampsia [10, 11]. In vitro studies have shown that placental trophoblasts undergo dramatic changes in gene expression when exposed to hypoxic condition [12, 13]. One such change is the significant reduction in syncytin-1 gene expression. Also, results from several laboratories indicated that preeclamptic placentas express lower levels of syncytin-1 compared to those from normal pregnancies [9, 14, 15]. In a recent study we compared syncytin-1 expression among the placentas of monozygotic, dichorionic, discordant twins. A significant increase of syncytin-1 mRNA and protein expression was observed in the placentas associated with smaller fetuses compared to those of larger fetuses. This alteration may reflect a compensatory response to meet the developmental needs of the placenta-fetus unit under a stressed condition [16]. Thus, syncytin-1 expression appears to be subjected to an active and precise regulation by various physio-pathological factors. The molecular/cellular events and mechanisms downstream of the syncytin-1 expression alterations are not fully understood.
Interestingly, recent studies suggested that syncytin-1, in addition to its recognized role in cell fusion, may also be implicated in nonfusogenic actions [17–19], particularly the regulation of cell proliferation. Strick et al. reported that ectopic overexpression of syncytin-1 in endometrial carcinoma primary cultures and cell lines resulted in an increased cell growth rate in the presence of TGF-beta. The experiment started with estrogen treatment, which led to a simultaneous induction of syncytin-1 and TGF-beta expression. However, overexpression of TGF-beta alone failed to recapitulate the effect of cell growth promotion, suggesting that syncytin-1 levels may play a part in the proliferation of endometrial cancer cells [20]. The thought concerning the involvement of syncytin-1 in cancer progression is corroborated by recent findings of aberrant syncytin-1 expression in breast and ovarian carcinomas [21]. These data raised a possibility that syncytin-1 may contribute to the unregulated growth of malignant cells by serving as a mytogenic factor. As described above, in human placenta, the trophoblast-specific expression of syncytin-1 is dynamically regulated by various physio-pathological conditions [13, 14, 22]. However, it is not clear if changes in syncytin-1 expression affect the proliferation of placental trophoblast, in which syncytin-1 is constitutively expressed. Answering this question will allow a better understanding of placental development under normal and pathologic conditions.
Eukaryotic cell proliferation is subjected to tight control by the sequential activation of transcriptional factors and cytokines. To complete the process of mitosis a cell needs to pass two critical check points, the G1/S and G2/M transitions [23]. It has been well established that the downregulation of p15 and activation of CDK4 represent early events triggering the G1/S transition [24]. Subsequent upregulation of E2F, PCNA and c-Myc are required for DNA synthesis [25]. Similarly, upregulation of CDK1 is the key step preceding the G2/M transition [26]. In this study, we examined the effects of syncytin-1 on trophoblast cell proliferation, and investigated how the manipulation of syncytin-1 expression levels might elicit quantitative changes in the cell cycle regulators in a time-dependent manner. The resultant data provided new insights into the nonfusogenic activity of syncytin-1 in placental trophoblasts, which may be involved in the physio-pathological regulation of placental development and functionality.
2. Materials and Methods
2.1. Cell culture and transfection with siRNA
BeWo and CHO cell lines were obtained from the American Type Culture Collection (Manassas, VA, USA) and grown in RPMI 1640 and DMEM (HyClone Laboratories, Logan, UT, USA), respectively. Both media were supplemented with 10% fetal bovine serum, 100 µg/ml streptomycin and 100 µg/ml penicillin. Cell cultures were maintained in the environment of 37°C and 5% CO2.
Four syncytin-1-specific siRNAs and a control siRNA, designed and synthesized by Qiagen (Valencia, CA, USA), were tested for the highest syncytin-1 knockdown efficiency. The designation and siRNA sequences are shown in Table S1. BeWo cells were seeded at low density and grown to 40–50% confluence for transfection with the DharmaFECT 1 transfection reagents (Dharmacon, Lafayette, CO, USA) in serum-free RPMI 1640 medium. After 6 hours of exposure to transfection reagents, fresh medium containing 10% fetal bovine serum was used to replace the serum-free medium, and the culture was continued until cells were harvested for downstream experiments at different post-transfection time points.
Syncytin-1 cDNA obtained from PCR was subcloned into the pEGFP-N1 vector (Clontech, Mountain View, CA, USA). CHO cells were plated at low density and grown to 30%-40% confluence for transfection with the Efectene transfection reagents (Qiagen, Valencia, CA, USA) in serum-free DMEM medium. Following 6 hours of exposure to transfection reagents the serum-free medium was changed to a medium containing 10% fetal bovine serum. The cells were assessed in various assays at different post-transection time points.
2.2. RNA isolation and real-time PCR
Total RNA was isolated from BeWo or CHO cells with the use of RNeasy Plus Mini Kit (Qiagen, Valencia, CA, USA). Reverse transcription was performed with High Capacity RNA-to-cDNA Kit (ABI, Foster City, CA, USA) using 1 µg of RNA in a 20 µl reaction. The cDNA was diluted into 100 µl for later use in real-time PCR. The designations, sequences of PCR primers and sizes of amplicons for the following target genes are summarized in Table S2: syncytin-1, p15, CDK4, E2F1, PCNA, c-Myc, CDK1, and glyceraldehyde phosphate dehydrogenase (GAPDH). Real-time PCR was carried out in 12 µl reactions containing 6 µl of 2 X SYBR Green PCR Master Mix (ABI, Foster city, CA, USA), 1 µl forward primer, 1 µl backward primer, 3 µl DEPC H2O and 1 µl cDNA template. Following the initial denature at 95 °C for 10 minutes, 40 cycles of amplification was performed with the following conditions: denature at 95 °C for 30 seconds, annealing and extension at 60 °C for 1 minute. The final products of real-time PCR were resolved in agarose gel electrophoresis. A single, clear band with the predicted size verifies the accomplishment of specific amplification (Fig. S2). If a real-time PCR failed the specificity check, an alternative set of primers would be tested. The threshold cycles of each mRNA species were determined in triplicate with the use of ABI 7900 Real-Time PCR System. The mRNA levels of the target genes were expressed as relative folds over those of GAPDH that was used as the internal reference.
2.3. Isolation of cell extracts and Western blot analysis
Proteins were isolated from BeWo and CHO cells using RIPA buffer (Boston BioProducts, Boston, MA, USA) supplemented with Halt™ Protease Inhibitor Cocktail (Pierce, Rockford, IL, USA)and 1% PMSF. Protein concentration was measured with the Bradford Assay. 20 µg of cell lysates was resolved in 8% (syncytin-1, CDK4, E2F1, c-Myc, CDK1), 12% (PCNA) or 15% (p15) polyacrylamide SDS-gels. The proteins were transferred to a polyvinylidene fluoride membrane within the transfer buffer (Boston BioProducts, Boston, MA, USA). Primary antibodies against syncytin-1 (Genetex, Irvine, CA, USA; Rabbit, 1:800 final dilution), CDK4 (Epitomics, Burlingame, CA, USA; Rabbit, 1:800), PCNA (SIGMA-ALDRICH, Saint Louis, MO, USA; Rabbit, 1:1000), E2F1(Cell Signaling, Danvers, MA, USA; Rabbit, 1:1000), c-Myc (SIGMA-ALDRICH, Saint Louis, MO, USA; Rabbit, 1:1000), CDK1 (Epitomics, Burlingame, California, USA; Rabbit, 1:500), p15 (Cell Signaling Danvers, MA, USA; Rabbit, 1:1000), β-actin (SIGMA-ALDRICH, Saint Louis, MO, USA; Mouse, 1:3000) and the matching secondary antibodies (Santa, Santa Cruz, CA, USA; Rabbit or mouse, Peroxidase-labeled, 1:4000) were applied for immunoblotting. Super Signal Western Femto Maximum Sensitivity Substrate (Pierce, Rockford, IL, USA) was used to enhance the detection sensitivity.
2.4. MTT assay
BeWo and CHO cells were seeded in 48-well dishes and transfected with siRNAs or pEGFP-N1 plasmid DNA. CellTiter 96® Aqueous One Solution Reagent (Madison, WI, USA) was used for color development. Absorbance values at wavelengths of 490 nm and 690 nm were measured following the manufacturer’s recommendations.
2.5. Cell Counting Assay
BeWo cells were seeded in 12-Well dishes and transfected with siRNAs. At 24, 48, 72, 96 hours post-transfection, cells were collected and stained with trypan blue. Using cell counting plate cell numbers were counted and for each time point. The growth curves are constructed based on the average values from four repeated experiments.
2.6. BrdU staining
10,000 cells were seeded on the Lab-Tek II Chamber Slide and transfected with siRNA or pEGFP-N1 plasmid DNA. At 72 hour post-transfection cells were fixed with 4% paraformaldehyde fixation solution (Boston BioProducts, Boston, MA, USA). The BrdU Staining Kit (Millipore, Billerica, MA, USA) was used to assess DNA synthesis following the manufacturer’s instructions.
2.7. Flowcytometry
After transfection with siRNA or pEGFP-N1 plasmid DNA, 1 × 10⁵ cells were re-suspended in 100 µl of incubation buffer and fixed with 75% ETOH on ice. The cells were labeled with Propidium Iodide in the dark at 37°C for 1 hour. Following washing with cold PBS, cells were re-suspended in PBS and analyzed on a FACSCalibur flowcytometer (Becton Dickinson FACSort, San Jose, CA, USA).
2.8. Statistical analysis
All statistical analyses were performed with the use of SPSS 13.0 statistical package (SPSS, Chicago, IL, USA). Student t test was applied for quantitative data, including those from real-time PCR, MTT assay, and cell counting. The average values from syncytin-1 manipulation group were compared to those from the control group at each time point with the assumption of normal distribution. Spearman’s rank correlation coefficient and p values were obtained from linear aggression analysis. Statistical significance was set at the level of p < 0.05.
3. Results
3.1. Establishment of the syncytin-1 knockdown assay in BeWo cells
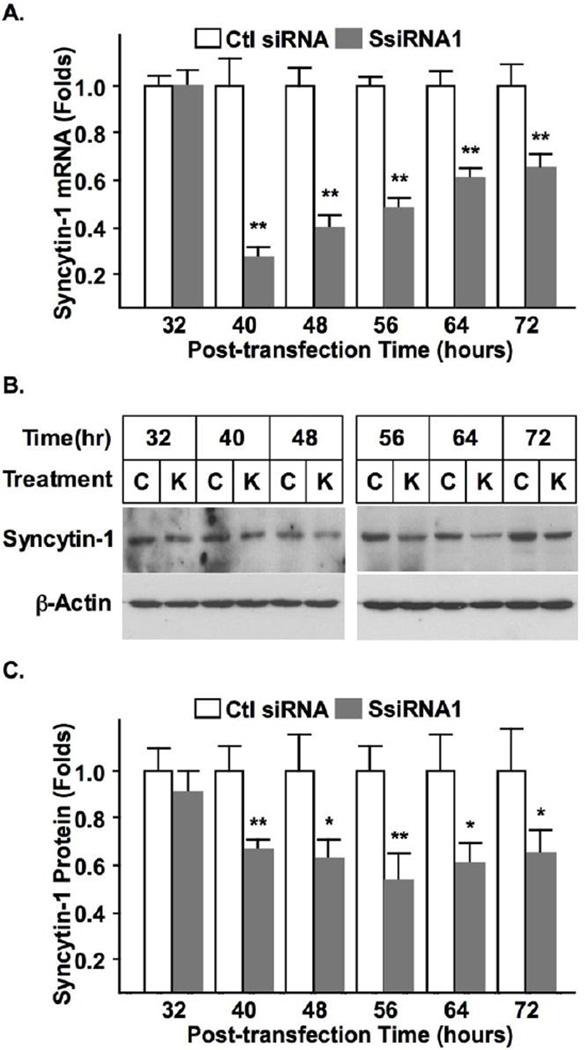
BeWo is a choriocarcinoma cell line frequently used as an in vitro model for studying placental gene expression and trophoblast cell differentiation [27, 28]. This study applied BeWo cells as a trophoblast model to characterize the endogenous syncytin-1 function. Four syncytin-1-specific siRNAs were screened for the highest inhibition efficiency. After measuring syncytin-1 mRNA levels following cell transfection with siRNA, one siRNA (SsiRNA1) was found to be the most effective for syncytin-1 knockdown (Fig. S1). Comparing the siRNA knockdown groups and control groups, manipulation of the syncytin-1 expression levels did not cause discernible morphological change (Fig. S3). Fig. 1 shows the time-dependent reduction in syncytin-1 mRNA and protein levels following transfection with SsiRNA1. Since each time point carried its own transfection control, non-specific changes would not affect our observation on the changes of syncytin-1 levels (or syncytin-1 functions in later experiments). Comparison between the cells transfected with SsiRNA1 and control siRNA indicated that when a final concentration of 50 nM was applied, at 40 hour post-transfection both the mRNA and protein were significantly reduced. Following this time point, syncytin-1 mRNA level expression gradually recovered, but a substantial inhibition remained at 72 hour post-transfection.
Figure 1.
Confirmation of syncytin-1 knockdown by siRNA in BeWo cells. (A) BeWo cells were transfected with 50 nM (final concentration) of syncytin-1 specific siRNA (SsiRNA1) or control siRNA (Ctl siRNA). At various post-transfection time points, syncytin-1 mRNA levels were measured with real-time PCR. At the 40, 48, 56, 64, and 72 hours post-transfection time points, syncytin-1 mRNA levels were significantly decreased in cells transfected with SsiRNA1 in comparison to the corresponding controls (**, p < 0.01). (B) Western blot analysis was performed at different post-transfection time points. As protein loading controls, β-actin protein was accessed in the same blot. Decreased syncytin-1 protein levels were observed in cells transfected with SsiRNA1 (marked as “K”) at 40, 48, 56, 64, and 72 hours when compared with correspondent controls transfected with non-specific siRNA (marked as “C”). (C) The Western Blot results were scanned and densitometry analysis was performed. Significant quantitative reduction of syncytin-1 protein was confirmed for 40, 48, 56, 64, and 72 hour time points (*, p < 0.05; **, p < 0.01).
3.2 Syncytin-1 knockdown leads to inhibition of cell growth
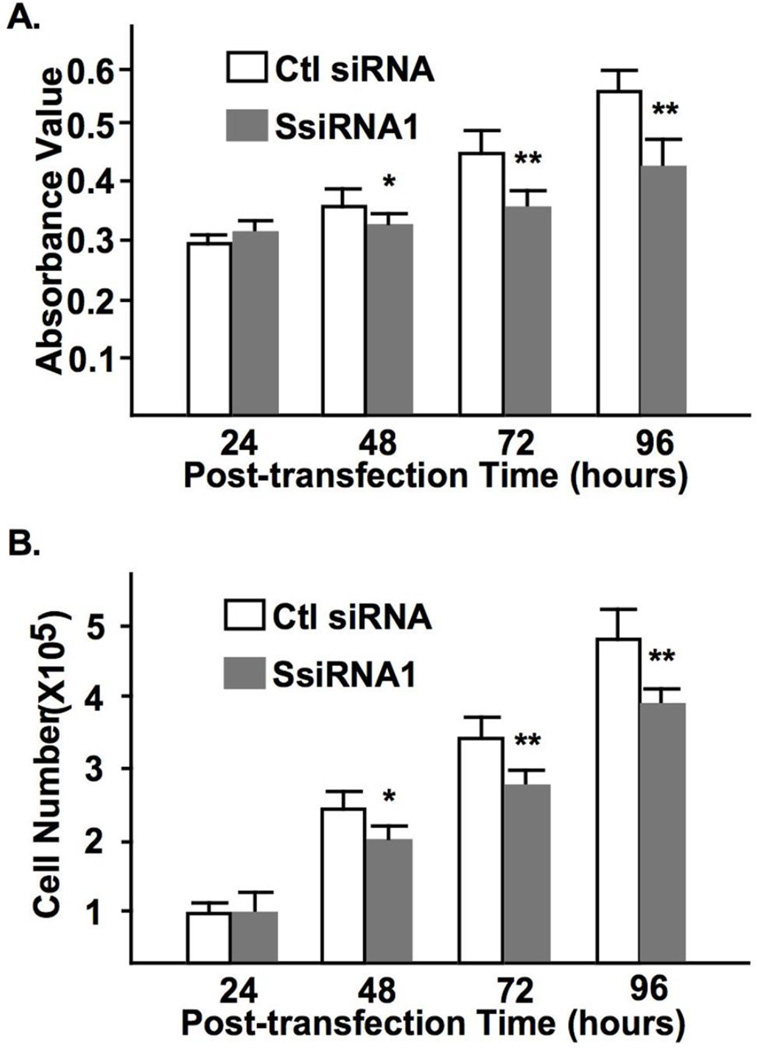
MTT assay was performed to assess the cell viability following syncytin-1 knockdown. Results as shown in Fig. 2A indicate that the absorbance values decreased at 48, 72, and 96 hours post-transfection in the SsiRNA1 transfection groups compared to the corresponding controls. In addition, cell counting confirmed the reduced cell numbers by syncytin-1 knockdown at these time points (Fig. 2B). Since no apparent cell death was observed under the applied experimental conditions, these results suggest an inhibition of cell proliferation by decreased levels of syncytin-1.
Figure 2.
Syncytin-1 knockdown-induced reduction of BeWo cell viability and cell proliferation. (A) MTT assay was performed at different post-transfection time points. Compared to the corresponding controls (Ctl siRNA), cells transfected with SsiRNA1 displayed decreased cell viability at 48, 72, and 96 hours post-tansfection. (B) Cell counting indicated a decreased cell number at the 48, 72, and 96 hours time points following transfection with SsiRNA1. (*, p < 0.05; **, p < 0.01)
3.3. Syncytin-1 knockdown leads to cell cycle arrest at G1 phase
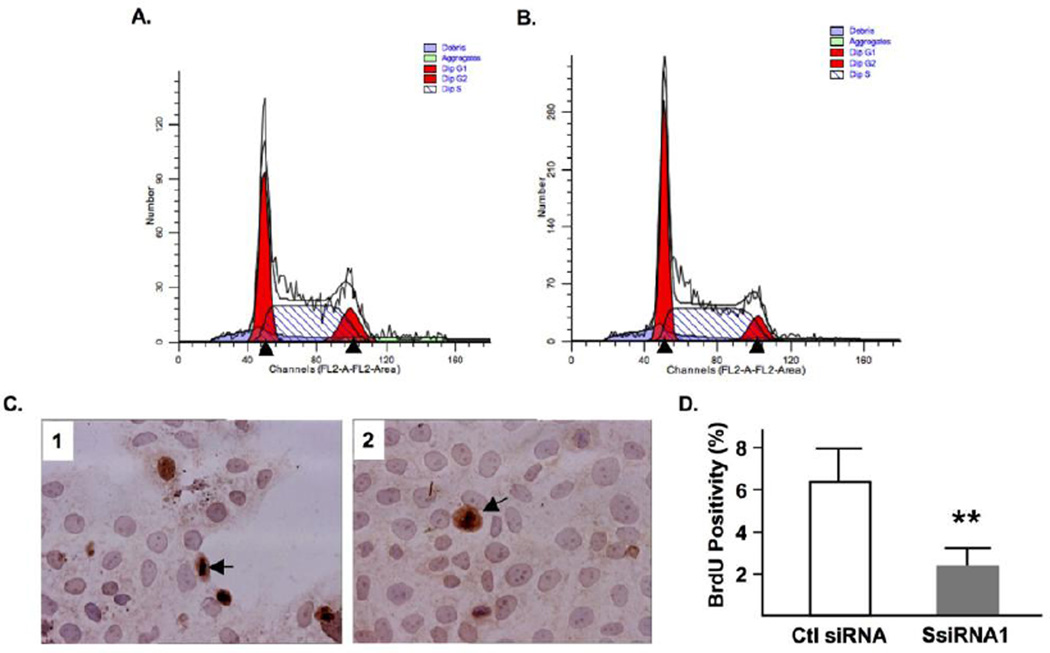
To investigate if the decreased cell number following syncytin-1 knockdown was associated with alterations of the cell cycle, we performed flowcytometry analysis on BeWo cells transfected with syncytin-1 or control siRNA. Comparison of the phase distribution at 72 hour post-transfection led to the identification of the following changes in the syncytin-1 knockdown group: an increased percentage of cells in G1 phase, a decreased percentage in S phase, and a reduction in G2/M phases (Fig. 3A and B). Subsequent experiments using BrdU staining indicated a significant inhibition of DNA synthesis, or S phase, in the syncytin-1 knockdown group (Fig. 3C and D). Taken together, these results provide strong evidence for the inhibitory effects on cell proliferation by syncytin-1 knockdown, as well as the halting of G1/S transition responsible for the observed effects.
Figure 3.
Syncytin-1 knockdown-induced BeWo cell cycle changes and inhibition of DNA synthesis. Representing flowcytometry diagrams of cells transfected with control siRNA (A), or SsiRNA1 (B), at 72 hour post-transfection. Note the apparent reduction of S phase in the syncytin-1 knockdown group compared to the control group. (C) Results of BrdU incorporation assay. Nuclei were visualized by hemotoxylin counterstaining. The dark brown color indicates BrdU-positive nuclei. One exemplary positive cell was marked by an arrow. (D) Counting of BrdU-positive and total cells showed a significantly decreased percentage of BrdU-positive cells in the syncytin-1 knockdown group compared to the control group. (**, p < 0.01)
3.4. Detection of the orderly changes in cell cycle regulators underlying the syncytin-1 knockdown-induced G1 arrest
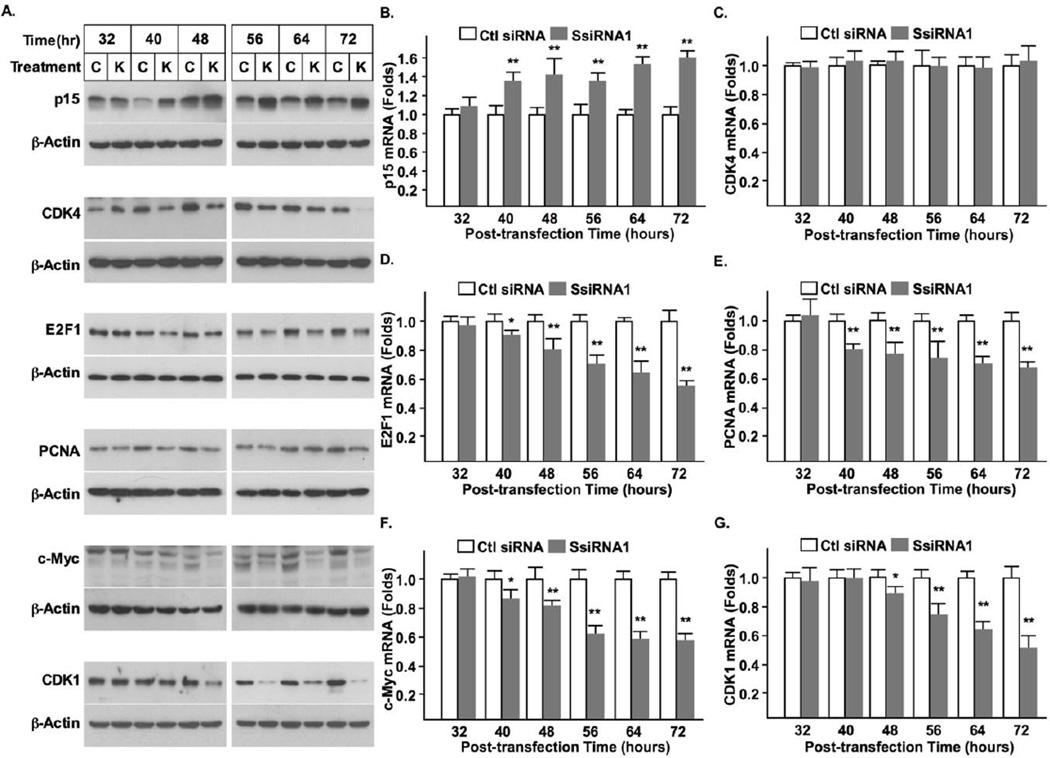
Procession of the cell cycle is mainly controlled at the G1/S and G2/M check points. A sequential activation of two distinct sets of cytokines is required for transition through these points. To determine the check points affected by syncytin-1 knockdown, we examined mRNA and protein expression of p15, CDK4, E2F1, PCNA, c-Myc, the known G1/S regulators; and CDK1, the G2/M regulator. Western blot analysis indicated that the protein levels of p15, CDK4, E2F1, PCNA, c-Myc were all significantly changed following syncytin-1 knockdown. The increase in p15 and the decrease in CDK4, E2F1, PCNA, c-Myc were readily detectable at 40 hour post-transfection and sustained at 72 hour post-transfection. On the other hand, the decease of CDK1 did not appear until the 48 hour post-transfection (Fig. 4A). These results, together with those from flowcytometry analysis and BrdU staining demonstrate that syncytin-1 knockdown exerts its effect primarily on the G1/S transition. The mRNA levels of these factors were also monitored at each time point with the use of real-time PCR. It was found that syncytin-1 knockdown leads to upregulation of p15 and downregulation of E2F1, PCNA, and c-Myc, mRNA levels. These changes were first detected at 40 hour post-transfection. CDK4 mRNA levels were not changed across all of the time points examined. A decrease in CDK1 mRNA was also observed, but at a later time point (48 hour). Thus, changes in mRNA levels mirrored those of the respective protein levels in all targets except for CDK4 (Fig. 4C). As discussed below, the absence of changes in CDK4 mRNA levels is consistent with the known targeting mechanism on its protein, rather than mRNA, levels.
Figure 4.
The temporal order of changes in cell cycle regulators indicated blocking of G1/S transition by syncytin-1 knockdown in BeWo cells. (A) Western blot analysis of cell cycle regulators. Compared to the corresponding controls, increased levels of p15 protein, and decreased levels of CDK4, E2F1, PCNA, and c-Myc, proteins, were observed as early as 40 hour post-transfection in cells transfected with SsiRNA1. A reduced level of CDK1 was detected at 48 hour post-transfection. The comparable levels of β-actin protein indicated a roughly equal loading of total protein. Measurement of mRNA levels with real-time PCR indicated the following changes in the syncytin-1 knockdown group: increase of p15 (B), decrease of E2F1 (D), PCNA (E), and c-Myc (F), mRNA levels, at 40 hour post-transfection. No change in CDK4 mRNA levels was detected at any time points examined (C). The decrease of CDK1 mRNA levels was not observed until 48 hour post-transfection (G). (*, p < 0.05; **, p < 0.01)
3.5. Promotion of DNA synthesis and cell cycle progression through overexpression of syncytin-1
The above experiments suggest that decreased levels of syncytin-1 leads to inhibition of cell growth by blocking the G1/S transition. We subsequently examined if overexpression of syncytin-1 may also affect cell proliferation. Since overexpression of syncytin-1 has strong fusogenic effects in BeWo cells, and fusion events may interfere with our observation of cell cycle changes, we elected to use CHO, a cell line that lacks fusion capability. During their characterization of the cell fusion mechanism, Marin M et al. found that CHO cells, due to an absence of the syncytin-1 receptor (ASCT2) expression, could not fuse even when syncytin-1 was overexpressed [29]. Our pilot study confirmed the lack of fusion activity of these cells (data not shown). Syncytin-1 overexpression was achieved by transfection of CHO cells with a plasmid vector carrying GFP marker. In order to achieve adequate transfection efficiency, extensive optimization experiments were performed by observation of the green florescence (data not shown).
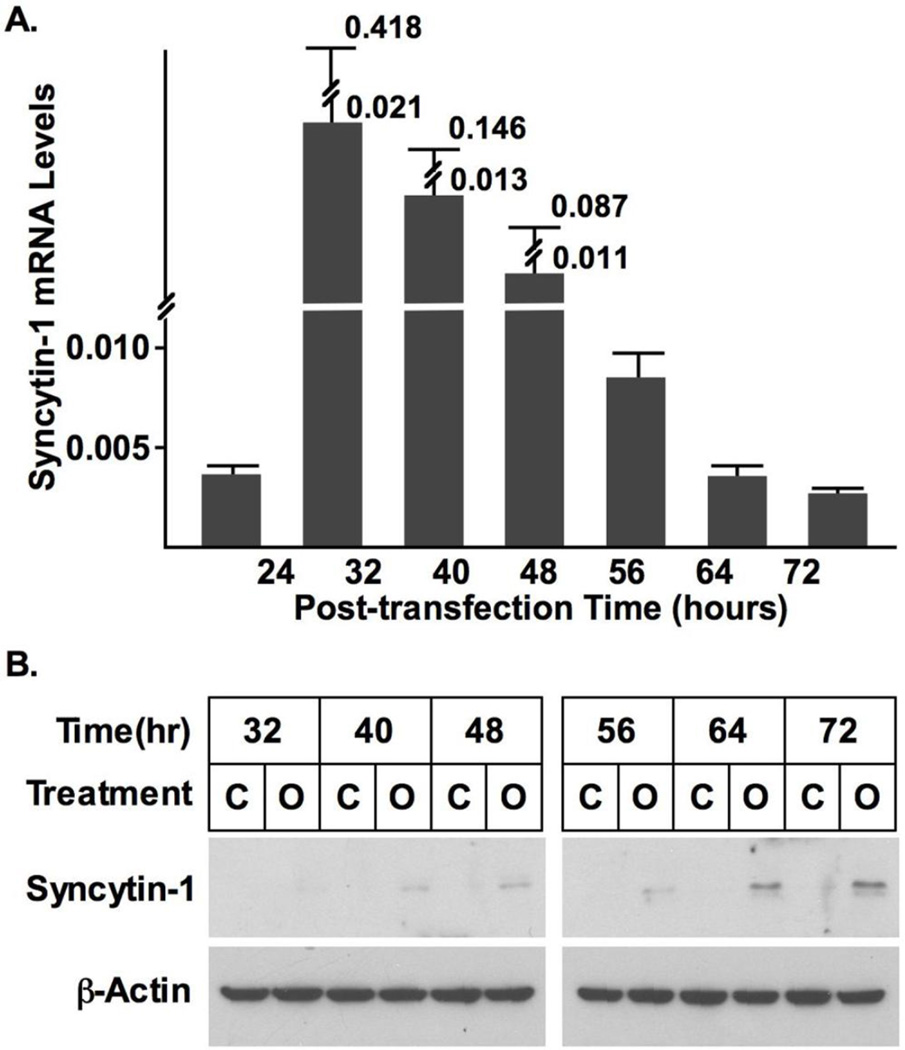
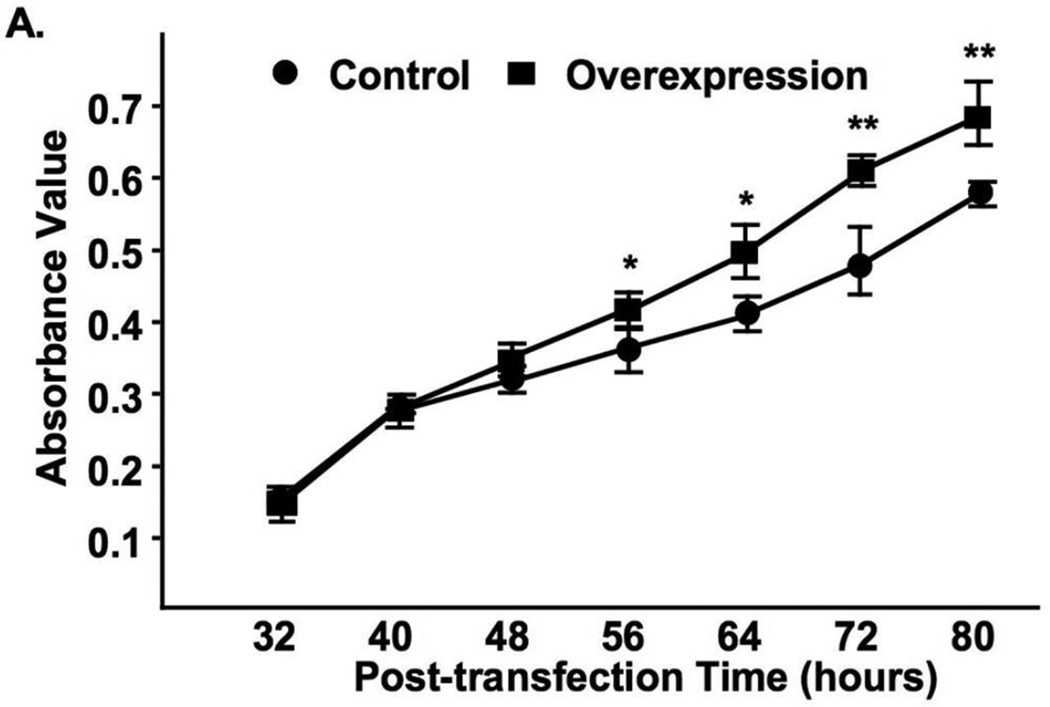
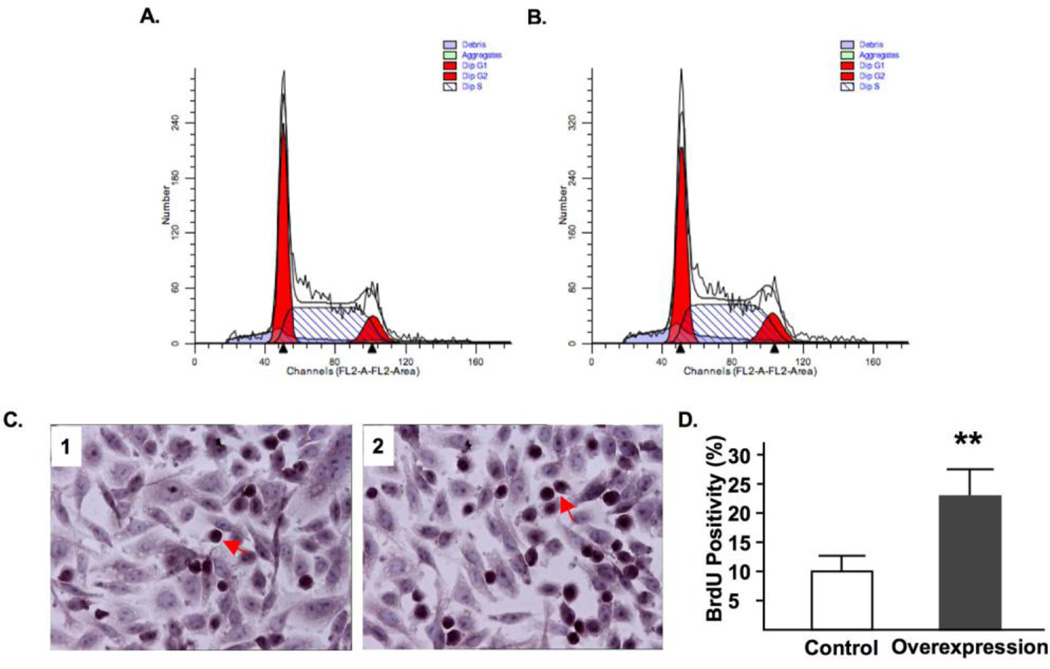
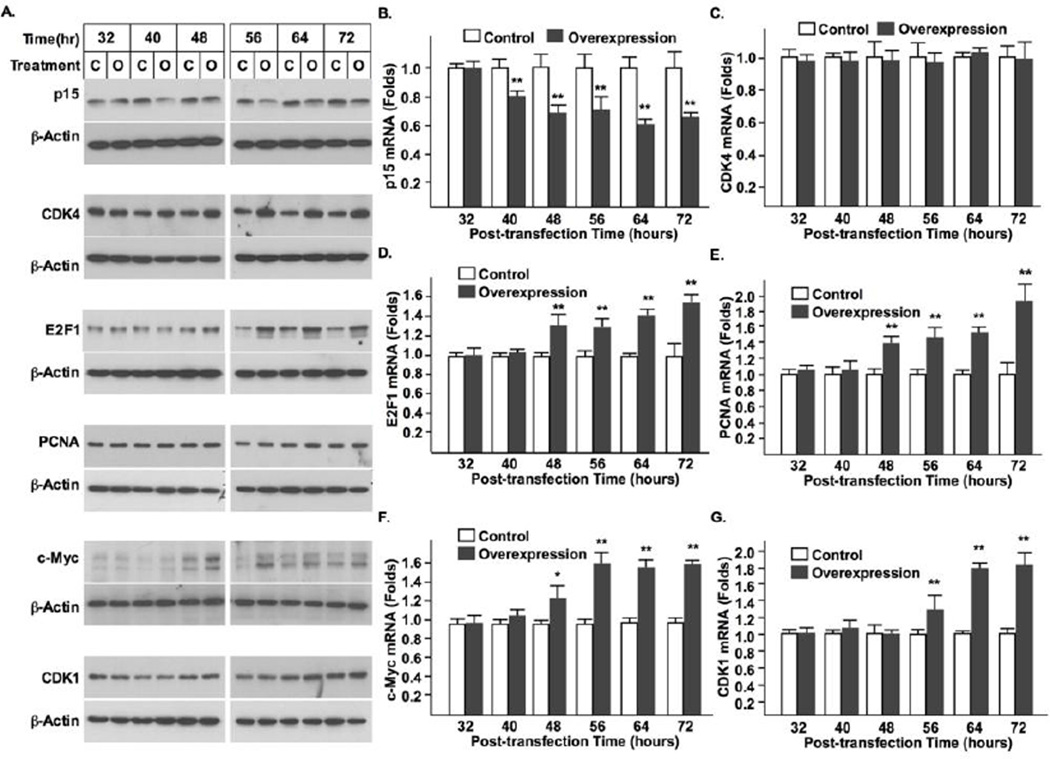
Fig. 5A shows that cell transfection resulted in a dramatic overexpression of syncytin-1. The syncytin-1 mRNA levels reached peak levels at 32 and 40 hours post-transfection, gradually decreasing thereafter. Western Blot analysis was first performed at 48 and 72 hours post-transfection time points. Densitometry analysis showed that following standardization with results of β-actin, at both time points significantly increased syncytin-1 levels were detected in the overexpression group (Fig. S4). A more systematic measurement indicated that a visible band representing syncytin-1 protein expression was first detected at 40 hour post-transfection, and syncytin-1 protein levels continue to increase thereafter (Fig. 5B). Increased reading from the MTT assay suggested an enhancement of cell metabolism following syncytin-1 overexpression (Fig. 6). Results from flowcytometry analysis confirmed the redistribution of cell phases in opposite direction to that observed in the syncytin-1 knockdown experiments: a reduction in G1 phase, an increase in S phase, and an increase in G2/M phase (Fig. 7A and B). We subsequently performed BrdU immunostaining to examine DNA synthesis. A significant increase in BrdU-positive cells verified an increase in DNA synthesis at 60 hour post-transfection in the syncytin-1 overexpression group compared to the control group (Fig. 7C and D). These results demonstrate an effect of cell cycle progression by ectopic overexpression of syncytin-1, which was most likely due to the enhanced G1/S transition.
Figure 5.
Verification of syncytin-1 overexpression following cell transfection. (A) CHO cells were transfected with syncytin-1 expression plasmid pEGFP-N1-syncytin-1 (Overexpression) or control plasmid pEGFP-N1 (Control). At different post-transfection time points the syncytin-1 mRNA levels were measured with real-time PCR. Syncytin-1 mRNA was detectable at 24 hour, dramatically increased at 32 hour, and gradually deceased thereafter. (B) Western blot analysis. Syncytin-1 protein was detected at 40 hour post-transfection in cells transfected with pEGFP-N1-syncytin-1 (Marked as “O”), and continued to increase thereafter. No syncytin-1 expression was detected at any time point in the control cells transfected with pEGFP-N1 vector (Marked as “C”). The comparable levels in β-actin indicated equal protein input.
Figure 6.
Increased CHO cell viability following syncytin-1 overexpression. MTT assay was performed at different post-transfection time points. Compared to the controls, CHO cells transfected with pEGFP-N1-syncytin-1 started to exhibit a significantly increased viability at 56 hour post-transfection. This effect was sustained at the later time points.
Figure 7.
Syncytin-1 overexpression in CHO cells promoted DNA synthesis. Representative flowcytometry diagrams shows that compared to control cells transfected with pEGFP-N1 (A), the syncytin-1 overexpression group transfected with pEGFP-N1-syncytin1 (B) contains increased S phase at 72 hour post-transfection. (C) BrdU incorporation assay was performed at 72 hour post-transfection in CHO cells transfected with control plasmid pEGFP-N1 (left panel) or syncytin-1 expression plasmid pEGFP-N1-syncytin-1 (right panel). Nuclei were visualized by hemotoxylin counterstaining. The dark brown color staining indicated BrdU-positive nuclei. One typical positive cell is marked by an arrow. (D) Counting of BrdU-positive and total cells showed a significantly increased percentage of BrdU-positive cells in the syncytin-1 overexpression group compared to the control group. (**, p < 0.01)
3.6. Syncytin-1 overexpression induces activation of cell cycle regulators critical for G1/S transition
Similar to the syncytin-1 knockdown experiments, changes in the cytokines governing the G1/S or G2/M transitions were assessed following syncytin-1 overexpression in CHO cells. Western blot analysis indicated that p15 protein levels were decreased at 40 hour post-transfection. At the same time point, CDK4 levels were increased (Fig. 8). Increased E2F1, PCNA and c-Myc proteins were subsequently detected at 48 hour post-transfection. An increase in CDK1 was the last to be observed, occurring at no earlier than 56 hour post-transfection. Results of real-time PCR indicated the same temporal order of changes in these factors except for CDK4, in which no alteration of mRNA level was detected. These results were consistent with those from syncytin-1 knockdown experiments in BeWo cells. The earlier emergence of alterations in G1/S regulators (p15, CDK4, E2F1, PCNA and c-Myc) than that of the G2/M regulator (CDK1) suggests that the G1/S transition is the primary target for syncytin-1-mediated cell cycle regulation.
Figure 8.
The temporal order of changes in the cell cycle regulators indicated promotion of G1/S transition by syncytin-1 overexpresion in CHO cells. (A) Western blot analysis of cell cycle regulators. Compared to the corresponding controls, cells transfected with pEGFP-N1-syncytin-1 expressed decreased p15 and increased CDK4 protein levels at 40 hour post-transfection. Increases in E2F1, PCNA, and c-Myc proteins were observed at 48 hour post-transfection. An increased level of CDK1 was detected at 56 hour post-transfection. The comparable levels of β-actin protein indicated a roughly equal loading of total protein. Measurement of mRNA levels with real-time PCR indicated the following changes: a decrease of p15 at 40 hour post-transfection (B); and an increase of E2F1 (D), PCNA (E), and c-Myc (F) mRNA levels at 48 hour. No change in CDK4 mRNA levels was detected at any time points examined (C). The increase of CDK1 mRNA levels came later at the 56 hour post-transfection time point (G). (*, p < 0.05; **, p < 0.01)
4. Discussion
This study focuses on characterization of the role of syncytin-1 in trophoblast proliferation using two cell lines with distinct origins and features. BeWo is a human choriocarcinoma cell line frequently used as an in vitro model for studying various placental trophoblast functions. Albeit a cancer cell line exhibiting malignant behaviors, it maintains some structural and functional features characteristic of its origin from trophoblast lineage. For example, these cells express low levels of hCG [30], hCS [31], estrogen receptor, progesterone receptor [32], placental protein 13 [28], and GCMa [33]; and high levels of pregnancy-specific glycoprotein [34], placental alkaline phosphatase [35], and placenta-specific TEF-5 transcription factor [36]. More importantly, BeWo expresses relatively low levels of syncytin-1 and ASCT2, and a number of cells (less than 5%) constantly undergo fusion and terminal differentiation [28], another characteristic feature of placental trophoblasts. Induction of syncytin-1 expression with forskolin [33], or overexpression of syncytin-1 [37], led to massive cell fusion and elevated expression of trophoblast markers such as hCG. Results from the current study suggest that BeWo cells are sensitive to changes in syncytin-1 levels. When syncytin-1 was reduced by siRNA-mediated knockdown, cell growth, as measured by both MTT assay (Fig. 2A) and cell counting (Fig. 2B), was significantly inhibited. Flowcytometry analysis indicated a decreased percentage of S phase and increased percentage of G1 phase (Fig. 3A). Further analysis on the mRNA and protein levels of key cell cycle regulators demonstrated blocking of the G1/S transition by syncytin-1 knockdown (Fig. 4). This conclusion was confirmed by ectopic overexpression of syncytin-1 in CHO, a cell line without ASCT2 expression and therefore free from interference by cell fusion events (Fig. 8). Overall, these data for the first time provided evidence in support of an active role of syncytin-1 in trophoblast cell cycle regulation. These findings pave the way for future research on syncytin-1’s nonfusogenic activity in both physiological and pathological contexts.
Downregulation of p15 protein level and upregulation of CDK4 kinase activity are known to be critical to the initiation of the G1/S transition [38]. p15 is able to interact with CDK4 and inhibit CDK4 kinase activity. Reduction in p15 leads to the de-repression of CDK4 kinase activity [39]. During the G1/S transition, upregulation of CDK4 expression and/or CDK4 activity are immediately followed by the transcriptional activation of E2F1, PCNA, and c-Myc [40, 41]. The orderly changes of these factors in the G1/S transition have been well established. In this study, we performed a detailed temporal analysis on both mRNA and protein levels of these factors. These results allowed us to determine the specific cell cycle phase on which syncytin-1 exerts its regulatory effects. In the syncytin-1 knockdown experiments, the initial changes were detected at 40 hour post-transfection in the factors regulating the G1/S transition. Change in CDK1, the regulator for the G2/M transition, was found to be a later event. This timeline, together with the results from BrdU staining, (Fig. 3) strongly suggests that blocking of DNA synthesis is the primary result of decreased syncytin-1 levels. Reduction in the percentage of G2/M phase cells and the concomitant decrease of CDK1 protein, however, appears to be due to an indirect or secondary effect following G1 arrest. This cell cycle regulatory model has been verified by observation of the opposite changes in the cell cycle effectors observed in syncytin-1 overexpression experiments in CHO cells.
This study examined the time-dependent changes of cell cycle regulators on both mRNA and protein levels. Corresponding changes at the mRNA and protein levels were observed in p15, E2F1, PCNA, c-Myc, and CDK1, which is consistent with the knowledge regarding these factors’ regulation on the transcriptional level. Unlike these factors, while a significant change of CDK4 was detected on the protein level in both the syncytin-1 knockdown and overexpression experiments, its mRNA level remained constant (Figs. 4 and 8). This dissociation between the changes in mRNA and protein levels of CDK4 is not surprising. Previous studies have shown that in some, but not all, cases, increased levels of CDK4 protein during the G1/S transition is not accompanied by the upregulation of its mRNA, which points to CDK4’s function as a regulator of the translation and/or protein turnover levels in this situation [42–44].
Syncytin-1 is known to be glycosylated and localized on the cell membrane [45]. As an initial step of investigation, this study did not explore how syncytin-1-initiated signals are transduced from cell membranes to the cytoplasm, thereby modulating downstream targets such as p15 and CDK4. Regardless of the molecular mechanisms underlying the signal transduction, regulation of the G1/S transition by syncytin-1 is unlikely related to the ASCT2-dependent cell fusion process. This thought is based on the facts that CHO cells are nonfusogenic [29], and yet data from both flowcytometry and Western blot analysis indicated significant effects of syncytin-1 on cell cycle regulation. More detailed studies are required to identify the missing part(s) of the puzzle concerning cell signaling immediately downstream of syncytin-1.
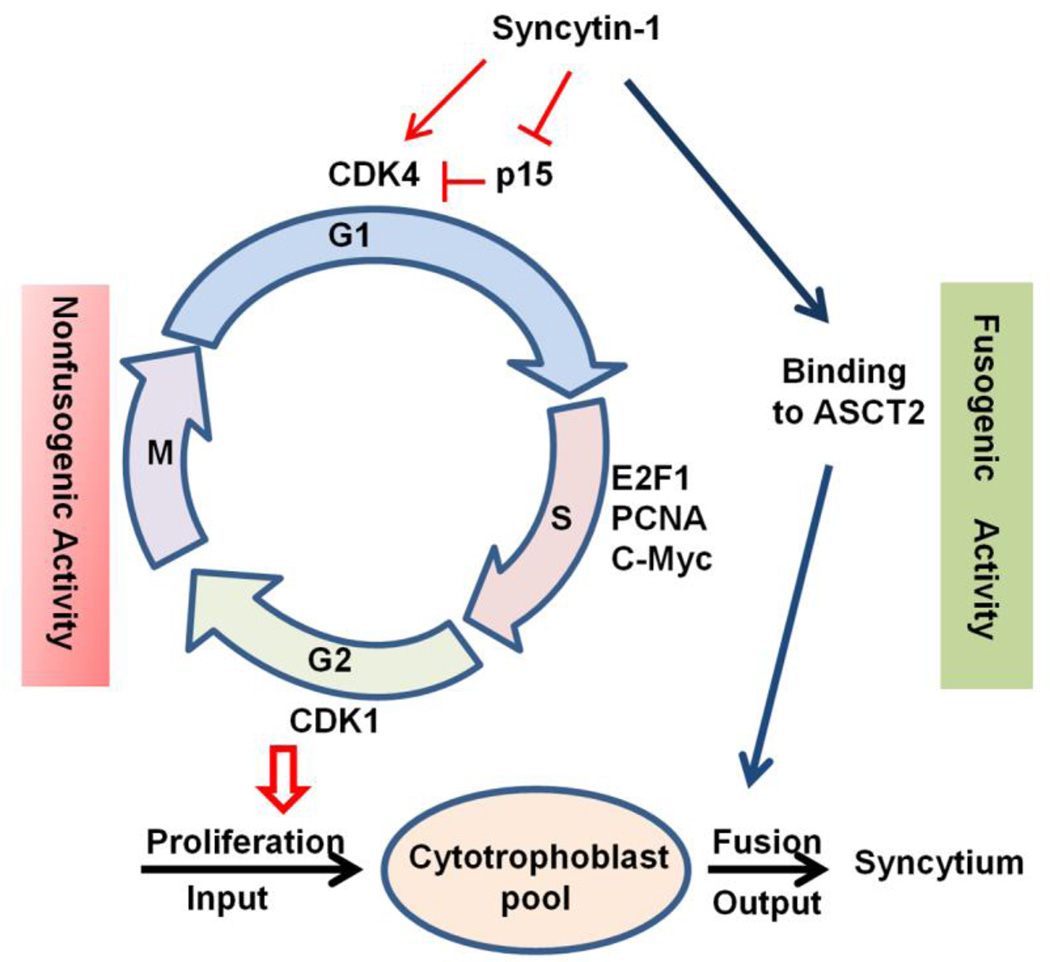
Cytotrophoblast proliferation and subsequent fusion into syncytiotrophoblast represent the input and output of the cytotrophoblast “pool”. Maintaining a balance between the two processes is critical for the stability of syncytium during a normal pregnancy [46]. The role of syncytin-1 in cell fusion has been well established. The current study reveals a novel, nonfusogenic function of syncytin-1 by identification of its prominent role in cell cycle regulation. Thus, syncytin-1 may participate in the regulation of both the input (by promoting proliferation) and output (by mediating fusion) of the cytotrophoblast “pool” [47]. Use of a single factor to co-regulate these two activities may represent a primitive yet effective way to achieve optimal coordination of the two processes (Fig. 9). For example, when the fetal-maternal unit requires increased syncytium function or repair of damaged syncytium, cell fusion is activated through the upregulation of syncytin-1. Concomitantly, cytotrophoblast proliferation mediated by upregulation of syncytin-1 would ensure a sufficient supply of cytotrophoblasts to feed the fusion events. However, this postulation, despite its plausibility and support from current data, requires further investigation for confirmation. An interesting notion is that products of other endogenous retroviral gene families are also implicated in a variety of cell functions, including cell proliferation, immune suppression, and apoptosis [48–51]. It remains to be answered if human cells adopted retroviral activity to meet their own physiological needs or if the viruses hijacked a human cell regulatory mechanism beneficial to its own survival or propagation [52].
Figure 9.
Syncytin-1 alterations triggered placental trophoblast cell cycle changes. The left side illustrates the nonfusogenic pathway of interest in the current study. Increased syncytin-1 expression, through downregultion of p15 and upregulation of CDK4, promotes the G1/S transition, resulting in augmented DNA synthesis and cytotropoblast proliferation. Via the nonfusogenic pathway, syncytin-1 plays a role in the regulation of “input” to the cytotrophoblast “pool”. The fusogenic function of syncytin-1 is illustrated on the right. Syncytin-1 has been known to mediate cytotrophoblast fusion into syncytiotrophoblast, thereby regulating “output” of the cytotrophoblast “pool”. We hypothesize that co-regulation of these two opposing processes by syncytin-1 may serve as an efficient mechanism to achieve an optimal balance of the cytotrophoblast “pool”, which ensures syncytium homeostasis and normal placental functions during pregnancy.
It has been observed that in placentas associated with preeclampsia and IUGR, syncytium displays characteristic structural and functional alterations. Electron microscopic studies have shown that syncytium in preeclamptic placentas becomes thinner and discontinued, develops bulbous edges, and contains multiple vacuoles in the syncytiotrophoblasts [4]. Although the in vivo lifespans of cytotrophoblasts and syncytiotrophoblasts have not been established, the constant presence of trophoblastic debris and cell-free nucleic acids in the maternal circulation is suggestive of their rapid turnover [53]. Thus, the cytotrophoblast “pool”, serving as the source of building blocks for syncytium, needs to be continually replenished. Decreased syncytin-1 expression in preeclamptic placentas [14] and downregulation of syncytin-1 observed in hypoxic conditions suggests that a sufficient level of syncytin-1 is necessary for normal placental development. Incomplete replenishment of the cytotrophoblast “pool” due to decreased syncytin-1 expression under pathological conditions may compromise syncytium efficiency and affect placental function in preeclampsia [13, 22]. Future studies using syncytin-1 knockout animal models and clinical samples are required for a better understanding on the in vivo role of the nonfusogenic function(s) of syncytin-1.
Supplementary Material
Highlights.
Syncytin-1 knockdown significantly inhibited BeWo cell growth and DNA synthesis.
Syncytin-1 overexpression promoted CHO cell proliferation and led to changes opposite to those observed in syncytin-1 knockdown experiments.
Syncytin-1 could promote the G1/S transition phase of the cell cycle through p15 and CDK4.
Syncytin-1, through both nonfusogenic and fusogenic, functions, may co-regulate the input (proliferation) and output (fusion) of the cytotrophoblast “pool”.
Acknowledgements
Shi-Wen Jiang is supported by the Distinguished Cancer Scholarship of Georgia Cancer Coalition (GCC). This work was partially funded by research grants from National Institute of Health (NIH) (R01 HD 41577, Shi-Wen Jiang), NIH/NCI MD Anderson Uterine Cancer SPORE (Jinping Li, Shi-Wen Jiang), and research supplements from the Department of Obstetrics and Gynecology (Shi-Wen Jiang), Mayo Clinic, and Seed Grants from Mercer University School of Medicine (Jinping Li, Shi-Wen Jiang).
Abbreviations
- PCNA
proliferating cell nuclear antigen
- CDK
cyclin dependent kinase
- IUGR
intrauterine growth restriction
- CHO
Chinese hamster ovary
- hCS
human chorionic somatomammotropin
- hCG
human chorionic gonadotropin
- ASCT
alanine-serine-cysteine transporter
- TGF
transforming growth factor
- DEPC
diethylpyrocarbonate
- GAPDH
glyceraldehydes phosphate dehydrogenase
- MTT
3-(4, 5-dimethylthiazol-2-yl)-2, 5-diphenyltetrazolium bromide
- BrdU
5-bromo-2’-deoxyuridine
Footnotes
Publisher's Disclaimer: This is a PDF file of an unedited manuscript that has been accepted for publication. As a service to our customers we are providing this early version of the manuscript. The manuscript will undergo copyediting, typesetting, and review of the resulting proof before it is published in its final citable form. Please note that during the production process errors may be discovered which could affect the content, and all legal disclaimers that apply to the journal pertain.
References
- 1.Wang J, Trudinger BJ, Duarte N, Wilcken DE, Wang XL. Bjog. 2000;107:935–938. doi: 10.1111/j.1471-0528.2000.tb11095.x. [DOI] [PubMed] [Google Scholar]
- 2.Tyson RW, Staat BC. Semin. Perinatol. 2008;32:166–171. doi: 10.1053/j.semperi.2008.02.005. [DOI] [PubMed] [Google Scholar]
- 3.Anthony RV, Pratt SL, Liang R, Holland MD. J. Anim. Sci. 1995;73:1861–1871. doi: 10.2527/1995.7361861x. [DOI] [PubMed] [Google Scholar]
- 4.MacLennan AH, Sharp F, Shaw-Dunn J. J. Obstet. Gynaecol. Br. Commonw. 1972;79:113–121. [PubMed] [Google Scholar]
- 5.Huppertz B, Sammar M, Chefetz I, Neumaier-Wagner P, Bartz C, Meiri H. Fetal Diagn. Ther. 2008;24:230–236. doi: 10.1159/000151344. [DOI] [PubMed] [Google Scholar]
- 6.Ishihara N, Matsuo H, Murakoshi H, Laoag-Fernandez JB, Samoto T, Maruo T. Am. J. Obstet. Gynecol. 2002;186:158–166. doi: 10.1067/mob.2002.119176. [DOI] [PubMed] [Google Scholar]
- 7.Blond JL, Lavillette D, Cheynet V, Bouton O, Oriol G, Chapel-Fernandes S, Mandrand B, Mallet F, Cosset FL. J. Virol. 2000;74:3321–3329. doi: 10.1128/jvi.74.7.3321-3329.2000. [DOI] [PMC free article] [PubMed] [Google Scholar]
- 8.Lavillette D, Marin M, Ruggieri A, Mallet F, Cosset FL, Kabat D. J. Virol. 2002;76:6442–6452. doi: 10.1128/JVI.76.13.6442-6452.2002. [DOI] [PMC free article] [PubMed] [Google Scholar]
- 9.Chen CP, Wang KG, Chen CY, Yu C, Chuang HC, Chen H. Bjog. 2006;113:152–158. doi: 10.1111/j.1471-0528.2005.00843.x. [DOI] [PubMed] [Google Scholar]
- 10.Hung TH, Charnock-Jones DS, Skepper JN, Burton GJ. Am. J. Pathol. 2004;164:1049–1061. doi: 10.1016/s0002-9440(10)63192-6. [DOI] [PMC free article] [PubMed] [Google Scholar]
- 11.Hung TH, Burton GJ. Taiwan J. Obstet. Gynecol. 2006;45:189–200. doi: 10.1016/S1028-4559(09)60224-2. [DOI] [PubMed] [Google Scholar]
- 12.Levy R, Smith SD, Chandler K, Sadovsky Y, Nelson DM. Am. J. Physiol. Cell. Physiol. 2000;278:C982–C988. doi: 10.1152/ajpcell.2000.278.5.C982. [DOI] [PubMed] [Google Scholar]
- 13.Kudo Y, Boyd CA, Sargent IL, Redman CW. Biochim. Biophys. Acta. 2003;1638:63–71. doi: 10.1016/s0925-4439(03)00043-7. [DOI] [PubMed] [Google Scholar]
- 14.Lee X, Keith JC, Jr, Stumm N, Moutsatsos I, McCoy JM, Crum CP, Genest D, Chin D, Ehrenfels C, Pijnenborg R, van Assche FA, Mi S. Placenta. 2001;22:808–812. doi: 10.1053/plac.2001.0722. [DOI] [PubMed] [Google Scholar]
- 15.Knerr I, Beinder E, Rascher W. Am. J. Obstet. Gynecol. 2002;186:210–213. doi: 10.1067/mob.2002.119636. [DOI] [PubMed] [Google Scholar]
- 16.Gao Y, He Z, Wang Z, Luo Y, Sun H, Zhou Y, Huang L, Li M, Fang Q, Jiang S. PLoS One. 2012;7:e33503. doi: 10.1371/journal.pone.0033503. [DOI] [PMC free article] [PubMed] [Google Scholar]
- 17.Perron H, Jouvin-Marche E, Michel M, Ounanian-Paraz A, Camelo S, Dumon A, Jolivet-Reynaud C, Marcel F, Souillet Y, Borel E, Gebuhrer L, Santoro L, Marcel S, Seigneurin JM, Marche PN, Lafon M. Virology. 2001;287:321–332. doi: 10.1006/viro.2001.1045. [DOI] [PubMed] [Google Scholar]
- 18.Knerr I, Schnare M, Hermann K, Kausler S, Lehner M, Vogler T, Rascher W, Meissner U. Apoptosis. 2007;12:37–43. doi: 10.1007/s10495-006-0329-9. [DOI] [PubMed] [Google Scholar]
- 19.Knerr I, Soder S, Licha E, Aigner T, Rascher W. J. Cell. Biochem. 2008;105:766–775. doi: 10.1002/jcb.21874. [DOI] [PubMed] [Google Scholar]
- 20.Strick R, Ackermann S, Langbein M, Swiatek J, Schubert SW, Hashemolhosseini S, Koscheck T, Fasching PA, Schild RL, Beckmann MW, Strissel PL. J. Mol. Med. (Berl) 2007;85:23–38. doi: 10.1007/s00109-006-0104-y. [DOI] [PubMed] [Google Scholar]
- 21.Menendez L, Benigno BB, McDonald JF. Mol. Cancer. 2004;3:12. doi: 10.1186/1476-4598-3-12. [DOI] [PMC free article] [PubMed] [Google Scholar]
- 22.Knerr I, Weigel C, Linnemann K, Dotsch J, Meissner U, Fusch C, Rascher W. Am. J. Obstet. Gynecol. 2003;189:583–588. doi: 10.1067/s0002-9378(03)00538-6. [DOI] [PubMed] [Google Scholar]
- 23.Elledge SJ. Science. 1996;274:1664–1672. doi: 10.1126/science.274.5293.1664. [DOI] [PubMed] [Google Scholar]
- 24.Reed SI. Cancer Surv. 1997;29:7–23. [PubMed] [Google Scholar]
- 25.DeGregori J, Kowalik T, Nevins JR. Mol. Cell. Biol. 1995;15:4215–4224. doi: 10.1128/mcb.15.8.4215. [DOI] [PMC free article] [PubMed] [Google Scholar]
- 26.Doree M, Hunt T. J. Cell Sci. 2002;115:2461–2464. doi: 10.1242/jcs.115.12.2461. [DOI] [PubMed] [Google Scholar]
- 27.Jiang SW, Lloyd RV, Jin L, Eberhardt NL. DNA Cell. Biol. 1997;16:969–977. doi: 10.1089/dna.1997.16.969. [DOI] [PubMed] [Google Scholar]
- 28.Orendi K, Gauster M, Moser G, Meiri H, Huppertz B. Reproduction. 2010;140:759–766. doi: 10.1530/REP-10-0221. [DOI] [PubMed] [Google Scholar]
- 29.Marin M, Lavillette D, Kelly SM, Kabat D. J. Virol. 2003;77:2936–2945. doi: 10.1128/JVI.77.5.2936-2945.2003. [DOI] [PMC free article] [PubMed] [Google Scholar]
- 30.Hu R, Jin H, Zhou S, Yang P, Li X. Placenta. 2007;28:399–407. doi: 10.1016/j.placenta.2006.07.005. [DOI] [PubMed] [Google Scholar]
- 31.Kohler PO, Bridson WE, Hammond JM, Weintraub B, Kirschner MA, Van Thiel DH. Acta Endocrinol. Suppl. (Copenh) 1971;153:137–153. doi: 10.1530/acta.0.068s137. [DOI] [PubMed] [Google Scholar]
- 32.Wang H, Zhou L, Gupta A, Vethanayagam RR, Zhang Y, Unadkat JD, Mao Q. Am. J. Physiol. Endocrinol. Metab. 2006;290:E798–807. doi: 10.1152/ajpendo.00397.2005. [DOI] [PubMed] [Google Scholar]
- 33.Knerr I, Schubert SW, Wich C, Amann K, Aigner T, Vogler T, Jung R, Dotsch J, Rascher W, Hashemolhosseini S. FEBS Lett. 2005;579:3991–3998. doi: 10.1016/j.febslet.2005.06.029. [DOI] [PubMed] [Google Scholar]
- 34.Ha CT, Wu JA, Irmak S, Lisboa FA, Dizon AM, Warren JW, Ergun S, Dveksler GS. Biol. Reprod. 2010;83:27–35. doi: 10.1095/biolreprod.109.082412. [DOI] [PMC free article] [PubMed] [Google Scholar]
- 35.Leitner K, Szlauer R, Ellinger I, Ellinger A, Zimmer KP, Fuchs R. J. Histochem. Cytochem. 2001;49:1155–1164. doi: 10.1177/002215540104900909. [DOI] [PubMed] [Google Scholar]
- 36.Jiang SW, Wu K, Eberhardt NL. Mol. Endocrinol. 1999;13:879–889. doi: 10.1210/mend.13.6.0288. [DOI] [PubMed] [Google Scholar]
- 37.Yu C, Shen K, Lin M, Chen P, Lin C, Chang GD, Chen H. J. Biol. Chem. 2002;277:50062–50068. doi: 10.1074/jbc.M209316200. [DOI] [PubMed] [Google Scholar]
- 38.Sandhu C, Garbe J, Bhattacharya N, Daksis J, Pan CH, Yaswen P, Koh J, Slingerland JM, Stampfer MR. Mol. Cell. Biol. 1997;17:2458–2467. doi: 10.1128/mcb.17.5.2458. [DOI] [PMC free article] [PubMed] [Google Scholar]
- 39.Ekholm SV, Reed SI. Curr. Opin. Cell. Biol. 2000;12:676–684. doi: 10.1016/s0955-0674(00)00151-4. [DOI] [PubMed] [Google Scholar]
- 40.Santoni-Rugiu E, Falck J, Mailand N, Bartek J, Lukas J. Mol. Cell. Biol. 2000;20:3497–3509. doi: 10.1128/mcb.20.10.3497-3509.2000. [DOI] [PMC free article] [PubMed] [Google Scholar]
- 41.Cam H, Dynlacht BD. Cancer Cell. 2003;3:311–316. doi: 10.1016/s1535-6108(03)00080-1. [DOI] [PubMed] [Google Scholar]
- 42.Bindra RS, Vasselli JR, Stearman R, Linehan WM, Klausner RD. Cancer Res. 2002;62:3014–3019. [PubMed] [Google Scholar]
- 43.Wang H, Goode T, Iakova P, Albrecht JH, Timchenko NA. Embo J. 2002;21:930–941. doi: 10.1093/emboj/21.5.930. [DOI] [PMC free article] [PubMed] [Google Scholar]
- 44.Parker MA, Deane NG, Thompson EA, Whitehead RH, Mithani SK, Washington MK, Datta PK, Dixon DA, Beauchamp RD. Cell. Prolif. 2003;36:347–360. doi: 10.1046/j.1365-2184.2003.00290.x. [DOI] [PMC free article] [PubMed] [Google Scholar]
- 45.Cheynet V, Ruggieri A, Oriol G, Blond JL, Boson B, Vachot L, Verrier B, Cosset FL, Mallet F. J. Virol. 2005;79:5585–5593. doi: 10.1128/JVI.79.9.5585-5593.2005. [DOI] [PMC free article] [PubMed] [Google Scholar]
- 46.Huppertz B, Kingdom JC. J. Soc. Gynecol. Investig. 2004;11:353–362. doi: 10.1016/j.jsgi.2004.06.002. [DOI] [PubMed] [Google Scholar]
- 47.Mi S, Lee X, Li X, Veldman GM, Finnerty H, Racie L, LaVallie E, Tang XY, Edouard P, Howes S, Keith JC, Jr, McCoy JM. Nature. 2000;403:785–789. doi: 10.1038/35001608. [DOI] [PubMed] [Google Scholar]
- 48.Cianciolo GJ, Copeland TD, Oroszlan S, Snyderman R. Science. 1985;230:453–455. doi: 10.1126/science.2996136. [DOI] [PubMed] [Google Scholar]
- 49.Lower R, Lower J, Kurth R. Proc Natl Acad Sci U S A. 1996;93:5177–5184. doi: 10.1073/pnas.93.11.5177. [DOI] [PMC free article] [PubMed] [Google Scholar]
- 50.Tacke SJ, Kurth R, Denner J. Virology. 2000;268:87–93. doi: 10.1006/viro.1999.0149. [DOI] [PubMed] [Google Scholar]
- 51.Dunlap KA, Palmarini M, Varela M, Burghardt RC, Hayashi K, Farmer JL, Spencer TE. Proc. Natl. Acad. Sci. U. S. A. 2006;103:14390–14395. doi: 10.1073/pnas.0603836103. [DOI] [PMC free article] [PubMed] [Google Scholar]
- 52.de Parseval N, Heidmann T. Cytogenet. Genome Res. 2005;110:318–332. doi: 10.1159/000084964. [DOI] [PubMed] [Google Scholar]
- 53.Sargent IL, Germain SJ, Sacks GP, Kumar S, Redman CW. J. Reprod. Immunol. 2003;59:153–160. doi: 10.1016/s0165-0378(03)00044-5. [DOI] [PubMed] [Google Scholar]
Associated Data
This section collects any data citations, data availability statements, or supplementary materials included in this article.


