SUMMARY
Brain-derived neurotrophic factor (BDNF) plays a key role in energy balance. In population studies, single nucleotide polymorphisms (SNPs) of the BDNF locus have been linked with obesity, but the mechanism by which these variants cause weight gain is unknown. Here, we examined human hypothalamic BDNF expression in association with 44 BDNF SNPs. We discovered that the minor C allele of rs12291063 is associated with lower human ventromedial hypothalamic BDNF expression (p<0.001) and greater adiposity in both adult and pediatric cohorts (p’s<0.05). We further demonstrated that the major T allele for rs12291063 possesses a binding capacity for the transcriptional regulator, heterogeneous nuclear ribonucleoprotein D0B, knockdown of which disrupts transactivation by the T allele. Binding and transactivation functions are both disrupted by substituting C for T. These findings provide a rationale for BDNF augmentation as a targeted treatment for obesity in individuals who have the rs12291063 CC genotype.
INTRODUCTION
Genetic factors play a role not only in the predisposition to obesity (Loos, 2012), but also in the effectiveness of obesity treatments (Choquet and Meyre, 2011). Genetic variation of the brain-derived neurotrophic factor (BDNF) locus is an important potential therapeutic target because BDNF plays a key role in energy homeostasis by functioning as a downstream regulator of the leptin-proopiomelanocortin pathway (Xu et al., 2003). Bdnf +/− mice (Lyons et al., 1999) and BDNF+/− humans (Han et al., 2008) exhibit hyperphagic behavior and obesity. BDNF is abundantly expressed in the ventromedial hypothalamus (VMH) (Xu et al., 2003), and selective deletion of Bdnf from the VMH and dorsomedial hypothalamus leads to obesity in mice (Unger et al., 2007). In human studies, associations have been observed between obesity and single nucleotide polymorphisms (SNPs) of the BDNF gene locus, most of which are intronic (Gong et al., 2013; Speliotes et al., 2010).
With the emerging evidence that non-coding genetic variants play an important role in gene regulation (Cooper, 2010), we hypothesized that SNPs within intronic regions of the BDNF locus could alter hypothalamic BDNF expression and thereby influence energy balance and serve as potential therapeutic targets for genotype-specific treatment of obesity. We examined the association of BDNF locus SNPs with human VMH BDNF expression and body composition in multiple pediatric and adult cohorts. We then investigated the mechanistic role of intronic SNP rs12291063, which emerged as the strongest predictor of hypothalamic BDNF expression and body mass index (BMI).
RESULTS
Rs12291063 CC genotype is associated with decreased BDNF expression in human VMH
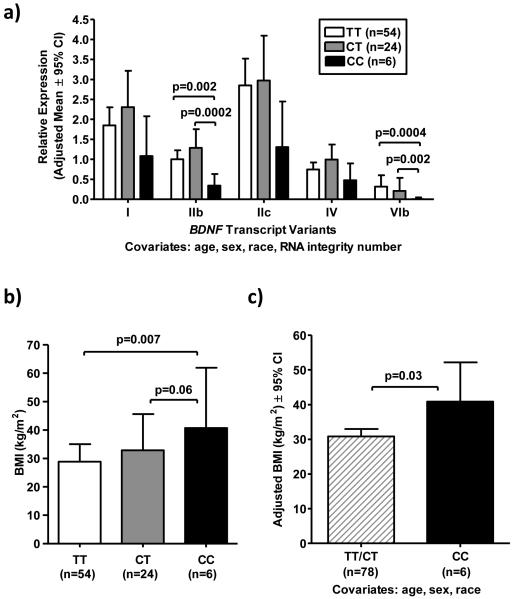
Relative expression of the five most abundant BDNF transcripts in human hypothalamus (I, IIb, IIc, IV, VIb) (Han et al., 2008) were measured by quantitative real-time PCR in postmortem human VMH-region tissue obtained from 84 adults (Table S1). Subjects were genotyped for 44 SNPs within or near the BDNF locus (Table S2). Of the 44 SNPs examined, only rs12291063 was significantly associated with BDNF expression after correction for multiple comparisons. Minor allele rs12291063 CC genotype was significantly associated with lower BDNF transcript IIb and nominally associated with lower BDNF transcript VIb expression (Figure 1a). Rs12291063 is located within the intron between noncoding exons VIII and VIIIh, upstream of coding exon IX (Figure S1). Additional BDNF SNPs showing nominal associations with BDNF expression that were not significant after correction for multiple comparisons are indicated in Table S2. Because minor allele frequency (MAF) for rs12291063 is higher in African American compared to Non-Hispanic Caucasian subjects, we confirmed the nominal associations of rs12291063 with BDNF transcripts IIb and VIb in the sub-cohort of 54 African American subjects (p=0.002 and p=0.006, respectively).
Figure 1.
BDNF rs12291063 CC genotype is associated with lower VMH BDNF expression and higher BMI in a postmortem adult cohort. (a) ANCOVAs compared BDNF expression by rs12291063 genotype. Overall p-values for each transcript were as follows: I (p=0.11), IIb (p=0.00097), IIc (p=0.06), VIb (p=0.002). Post-hoc LSD pair-wise comparisons were performed for transcripts with significant overall p-values (IIb and IVb). CC subjects had lower transcript IIb and VIb expression. Adjusted means ± 95% confidence intervals of back-transformed log-expression data (normalized to the geometric mean of ACTB, B2M and GUSB) are shown. (b) BMI (log-transformed to normalize) was compared by ANOVA (overall p=0.02), with post-hoc LSD showing no difference in BMI between CT and TT (p=0.19), higher BMI in CC vs. TT (p=0.007), and trend toward higher BMI in CC vs. CT (p=0.06). Medians [interquartile ranges] are shown. (c) Subjects with the rs12291063 CC genotype had higher BMI compared to combined TT and CT subjects (p=0.03). TT and CT individuals were grouped together because of similar BDNF expression and BMI. Adjusted means ± 95% confidence intervals of back-transformed data shown.
Rs12291063 CC genotype is associated with greater BMI and adiposity
Postmortem adult cohort
Subjects with rs12291063 CC genotype had significantly greater BMI compared to subjects with TT genotype (p=0.007, Figure 1b) and a trend toward greater BMI compared to CT subjects (p=0.06, Figure 1b). BMI was not significantly different between CT and TT groups (p=0.19). After adjustment for age, sex and race, CC genotype remained significantly associated with higher BMI when compared with combined CT and TT subjects (p=0.03, Figure 1c). We also confirmed the association of rs12291063 with BMI in the sub-cohort of African American subjects (p=0.04, in one-tailed analysis, data not shown).
Adult African American cohorts
Because MAF of rs12291063 is higher in African American compared to Caucasian cohorts (Sherry et al., 2001), we examined the association between rs12291063 and obesity in a sample of 29,151 adult subjects of African American race who were enrolled in the Population Architecture using Genomics and Epidemiology (PAGE) consortia study (Gong et al., 2013). Rs12291063 MAF for C was 0.30 in this cohort. Number of C alleles was positively associated with BMI (adjusted for age, sex, study site and ancestry principal components; p=0.00008, β= +0.007, Table S3).
In a sample of 677 adult subjects of African American race who were enrolled in the Healthy Aging in Neighborhoods of Diversity across the Life Span study (HANDLS) (Evans et al., 2010), rs12291063 MAF for C was 0.30. In one-tailed replication analyses, number of C alleles was positively associated with percent fat (adjusted for age, sex and the first 10 component vectors from multidimensional scaling to account for population substructure; p=0.02, β= +0.01) and fat mass (additionally adjusted for height2; p=0.04, β= +0.06), and a trend toward association was observed for BMI (p=0.07, β= +0.02).
Healthy pediatric cohort
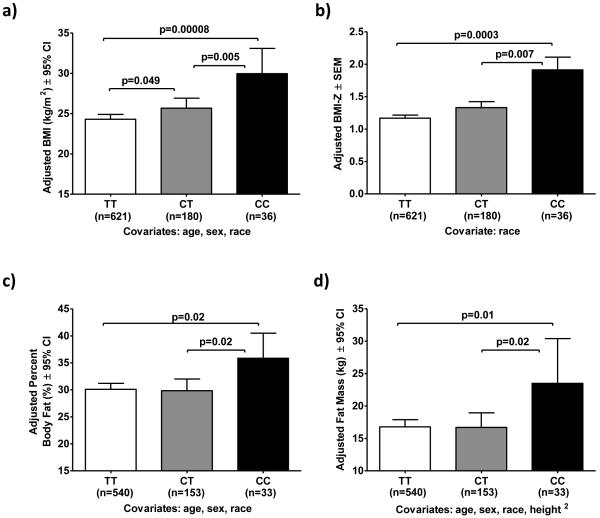
The association between rs12291063 and obesity was further studied in a cohort of 837 healthy children (age 12.6 ± 3.3 years; 58% female; 53% Non-Hispanic Caucasian, 36% African American; BMI-Z 1.24 ± 1.18) recruited as volunteers for clinical studies at the NIH (Table S4). Rs12291063 MAF for C was 0.02, 0.34 and 0.17 for Non-Hispanic Caucasian, African American and Asian/Hispanic/Other subjects, respectively. Genotype distributions within racial/ethnic subgroups were consistent with Hardy-Weinberg equilibrium (HWE) (p’s>0.05). Rs12291063 CC subjects had significantly higher BMI and higher BMI-Z than CT and TT subjects (p’s<0.01, Figures 2a and 2b). BMI was also higher in CT subjects compared to TT subjects (p=0.049), but BMI-Z was not significantly different (p=0.13). We also confirmed the association of rs12291063 with BMI-Z in the sub-cohort of African American children (p=0.04, in one-tailed analysis, data not shown). Among 726 children who underwent body composition analysis, subjects with the rs12291063 CC genotype had significantly greater percent body fat and fat mass compared to CT and TT subjects (p’s<0.05, Figures 2c and 2d). CT and TT subjects had similar adjusted percent body fat (p=0.84) and similar adjusted fat mass (p=0.96).
Figure 2.
BDNF rs12291063 CC genotype is associated with higher BMI, BMI-Z, percent body fat and fat mass in children. (a,b) rs12291063 CC genotype was significantly associated with higher BMI and higher BMI-Z in a cohort of 837 health children. (c,d) Among 726 subjects who underwent body composition analysis (451 by dual-energy X-ray absorptiometry and 275 by air displacement plethysmography), the rs12291063 CC genotype was associated with significantly higher percent body fat and higher fat mass. ANCOVAs were performed followed by post-hoc pair-wise LSD comparisons when overall p-values were significant (overall p-values for BMI, BMI-Z, percent body fat and fat mass were 0.0002, 0.001, 0.04 and 0.04, respectively; only significant p-values from post-hoc pair-wise comparisons are shown in the figures). Adjusted means ± 95% confidence intervals of back-transformed BMI, percent body fat and fat mass data shown. Adjusted means ± SEM of BMI-Z data shown.
Replication in a pediatric Hispanic cohort
In a sample of 813 pediatric subjects of Hispanic ethnicity who were enrolled in the Viva La Familia Study (Butte et al., 2006) at Baylor College of Medicine, rs12291063 MAF for C was 0.33. In one-tailed replication analyses, number of minor C alleles was positively associated with BMI (adjusted for age and sex; p=0.04, β= +0.09), a trend toward association was observed for BMI-Z (p=0.08, β= +0.07) and fat mass (additionally adjusted for height2; p=0.09, β= +0.07), and no significant association was observed for percent fat (p=0.19).
Transcriptional enhancer hnRNPD0B binds preferentially to major T allele sequence at rs12291063 locus
To examine the mechanism through which rs12291063 might alter BDNF expression and lead to obesity, we used Genomatix SNPInspector software to predict potential transcription factor binding at the rs12291063 locus and found that its major T allele sequence matches the AAATACC motif of the Mt site, located upstream of the human DES gene. Mt binds to an unidentified nuclear extract protein, designated as Mt binding factor, that is required for full transcriptional activity of DES (Gao et al., 1998).
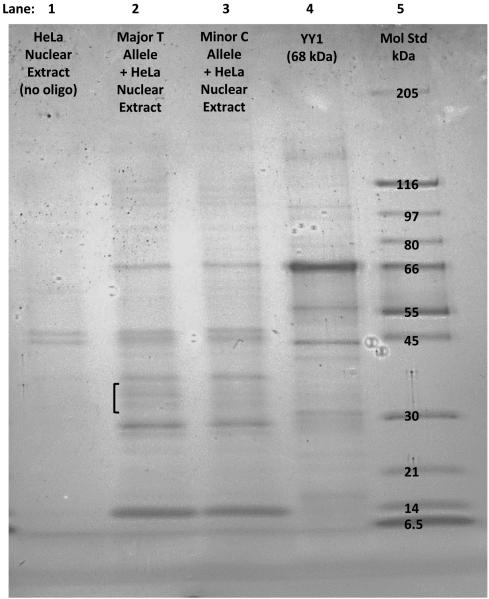
We hypothesized that the T allele for SNP rs12291063 is a binding site for a transcriptional regulatory protein and that presence of the C allele decreases binding of this protein. We performed a streptavidin-agarose bead pull-down procedure (Deng et al., 2003) to isolate HeLa nuclear proteins that bind preferentially to the T allele sequence of rs12291063. We observed that protein bands between 30-40 kDa in size were more intense for the T allele compared to the minor C allele (Figure 3). Sequencing by mass spectrometry of nuclear proteins that bound to the major T allele of rs1229063 identified a total of 23 proteins (Table S5). From this list, we selected heterogeneous nuclear ribonucleoprotein (hnRNP) D0B (NP_002129.2; AAB96683.1) as the most likely candidate protein because of its molecular weight (~32 kDa), relative abundance (11.3%), high binding affinity to DNA in a sequence specific manner, and known role as a transcriptional enhancer (Tolnay et al., 2000; Tolnay et al., 1999)ENREF 38 ENREF 16.
Figure 3.
Nuclear extract proteins between 30-40 kDa size bind better to the major T allele of rs12291063. Lane 1: No oligonucleotide-control showing nonspecific binding of nuclear proteins to the beads. Lanes 2 and 3: Black bracket shows bands between 30-40 kDa in size that appear higher in intensity for the T allele (lane 2) compared to the C allele (lane 3) probe. Table S5 shows the isolated proteins identified by mass spectrometry. Lane 4: YY1 protein, selected as a ubiquitous transcription factor to serve as an additional molecular weight standard (68 kDa). Lane 5: Molecular weight standard.
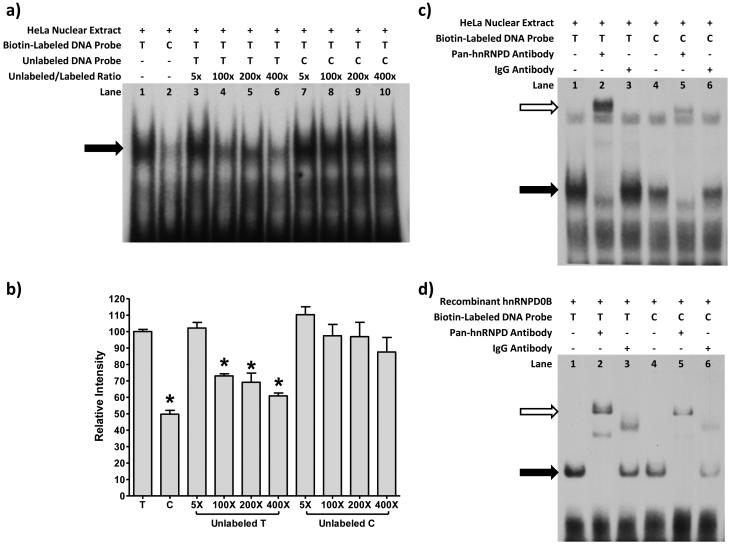
To confirm that hnRNPD0B binds to the rs12291063 locus, we conducted electrophoretic mobility shift assay (EMSA) experiments. We observed that a HeLa nuclear protein bound preferentially to the T allele sequence versus the C allele sequence of rs12291063, with 50% lower binding intensity for the minor allele sequence (p<0.0001, Figures 4a and 4b). Competition assays with unlabeled T allele probe showed significantly diminished intensity of the labeled major T probe-protein band (p’s<0.006, Figures 4a and 4b), but no diminution from unlabeled C allele probe (p’s>0.11, Figures 4a and 4b), confirming that the observed DNA-protein band for the T allele probe is sequence-specific and that the nuclear protein has higher affinity for the T allele over the C allele.
Figure 4.
Transcriptional enhancer hnRNPD0B binds preferentially to the major T allele of rs12291063. (a,b) EMSAs were performed using HeLa nuclear extract and biotin-labeled oligos containing the major and minor alleles of rs12291063. The major T oligo bound to nuclear protein to form a band (lane 1, black arrow) that was twice as intense (p<0.0001, b) as the minor C oligo-protein band (a, lane 2). Competition assays with 100-400X unlabeled T-oligo showed significantly diminished intensity of the labeled T oligo-protein band (a, lanes 4-6; p’s<0.006, b), but not with unlabeled C-oligo even at 400X excess (a lanes 7-10; p’s>0.11, b). Mean ± SEM shown for 3 experiments, for which a is a representative gel. *p<0.01 for post-hoc LSD after ANOVA. (c) In EMSA supershift experiments (n=3, representative gel in c), the oligo-protein band (c, lane 1, black arrow) was diminished by the addition of pan-hnRNP antibody and a supershifted-complex formed (c, lane 2, white arrow). Normal mouse IgG did not alter the oligo-protein band (c, lane 3). A similar pattern was observed for the C-oligo (c, lanes 4-6), but with lower band intensities. (d) In EMSAs using hnRNPD0B (n=3, representative gel in d), binding was observed for the T (d, lane 1) and C (d, lane 4) oligos, and the DNA-protein complexes were supershifted by addition of pan-hnRNP (d, lanes 2 and 5), but the band intensities were lower for the C oligo. Addition of IgG (d, lanes 3 and 6) generated supershifted bands of comparatively lower molecular weight, but the original DNA-protein bands remained.
We proceeded to perform supershift experiments using a mouse monoclonal pan-anti human hnRNP antibody (Figure 4c). The primary DNA-protein band was diminished by the addition of pan-hnRNP antibody and a supershifted-complex formed. In contrast, mouse IgG did not alter the primary DNA-protein band, which confirmed the specificity of the observed supershift. A similar pattern was observed for both the T and C allele sequences of rs12291063, but the band intensities were lower for the C allele, consistent with its decreased binding capability for a hnRNP.
We then performed EMSA supershift experiments using purified recombinant hnRNPD0B protein (Figure 4d). We observed that hnRNPD0B bound to both the T and C allele sequences, but with lower intensity for the C allele sequence. These DNA-protein complexes were supershifted by addition of pan-hnRNP antibody, but the supershifted band intensities still remained consistently lower for the C allele. Addition of mouse IgG induced supershifted bands of comparatively lower molecular weight to form, but the original DNA-protein complexes were still present, suggesting that IgG nonspecifically binds to a site on the biotin-labeled oligonucleotides distinct from the DNA site that binds hnRNPD0B.
Minor C allele of rs12291063 decreases luciferase reporter gene expression
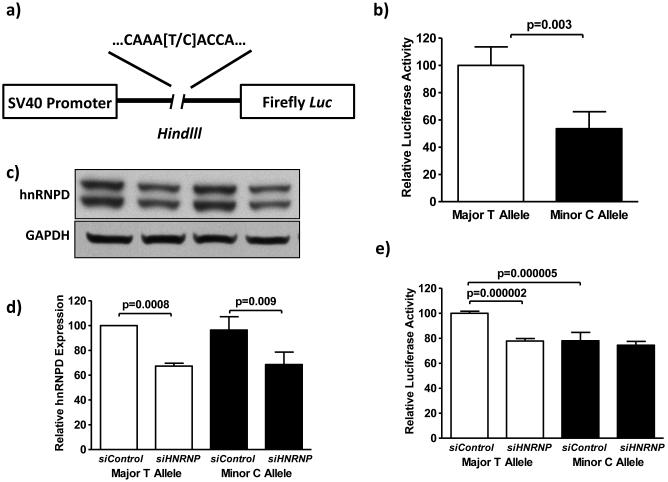
Because hnRNPD0B has been shown to enhance transcription in vitro (Tolnay et al., 2000), we hypothesized that substitution of T with C at rs12291063 leads to decreased binding of hnRNPD0B, resulting in decreased gene expression. We cloned the T or C allele and the identical 250 base pair flanking sequence of rs12291063 into pGL3-SV40 luciferase reporter vectors (Figure 5a) in HEK-293 cells. The construct containing the C allele exhibited 46% lower luciferase activity compared to the construct containing the T allele (p=0.003, Figure 5b).
Figure 5.
Rs12291063 minor C allele decreases luciferase reporter gene expression, and the transactivation function of the major T allele is disrupted by reduction in hnRNPD protein expression. (a) 250bp sequences containing either the T allele or the C allele of rs12291063 were each cloned into a pGL3 luciferase reporter vector driven by an SV40 promoter at the Hindlll site. (b) HEK-293 cells transiently transfected with the minor C allele construct exhibited 46% lower Firefly luciferase activity (normalized to co-transfected Renilla luciferase) compared to cells transfected with the major T allele construct (n=12 replicates, p=0.003). (c) Cells were transiently transfected with either the T or C allele rs12291063 construct along with HNRNPD siRNA (siHNRNPD) or Control siRNA (siControl), and were subjected to Western blot to detect the protein expression level of hnRNPD (normalized to GAPDH). Cells containing the T allele construct and siHNRNPD exhibited an average of 33% lower hnRNPD protein expression compared to matched cells with siControl (n=4, p=0.0008). Cells containing the C allele construct and siHNRNPD exhibited an average of 29% lower hnRNPD protein expression compared to matched cells with siControls (n=4, p=0.009). (d) Parallel transfections from c were carried out to assess luciferase activity. Cells with the T allele construct and siHNRNPD exhibited 22% lower Firefly luciferase expression compared to the T allele construct with siControl (n=8, p=0.000002). Cells containing C allele construct with siHNRNPD exhibited comparable luciferase expression compared to C allele construct with siControl (n=8, p=0.2). Cells with the T allele construct and siControl exhibited 22% lower Firefly luciferase expression compared to cells with the C allele construct and siControl (n=8, p=0.000005). Two-tailed, independent samples T-tests were performed and means ± SEMs are shown.
Transactivation function of the major T allele of rs12291063 is disrupted by reduction of hnRNPD protein expression
We performed siRNA-mediated knockdown of hnRNPD0B to confirm that the observed decrease in expression was due to diminished hnRNPD0B binding at the C allele. siHNRNPD significantly decreased hnRNPD protein expression (p<0.01) in both T and C allele construct-containing cells (Figure 5c). siHNRNPD treatment was associated with 22% lower luciferase expression induced by the major T allele compared to siControl (p<0.01, Figure 5d). However, there was no significant difference in luciferase expression between siHNRNPD and siControl in cells containing the minor C allele (p=0.2, Figure 5d), thus supporting a specific transactivation activity induced by binding of hnRNPD0B with the major T allele of rs12291063. Furthermore, cells co-transfected with the minor C allele and siControl showed a significant decrease in luciferase activity compared to cells co-transfected with the major T allele and siControl (p=0.000005, Figure 5d), which serves as secondary confirmation that the minor C allele causes decreased gene expression.
DISCUSSION
We observed that the rs12291063 CC genotype was associated with lower BDNF transcripts IIb and VIb expression in human VMH and higher BMI and adiposity in multiple racially diverse pediatric and adult cohorts. Our in vivo and clinical findings indicate that BDNF rs12291063, which had a MAF of ~30% within our Hispanic and African American cohorts, could play an important role in the pathogenesis of obesity in these populations. Mechanistically, our data suggest that diminished binding of hnRNPD0B at the rs12291063 locus in individuals with the CC genotype could cause decreased BDNF mRNA expression and protein concentrations within the hypothalamus, potentially leading to excessive energy intake and weight gain.
Regulation of BDNF expression is complex, with multiple promoters responding to a variety of control mechanisms, giving rise to distinctly regulated mRNA variants with different brain region expression patterns (Pruunsild et al., 2007; Zheng et al., 2012). BDNF transcript IIb and VIb comprise 38% of the total BDNF mRNA expression in the hypothalamus (Han et al., 2008). Thus, decreased expression of these two transcripts could have significant impact on body weight regulation.
Our findings provide the first potential mechanism for the obesity risk associated with a common noncoding variant of BDNF. Genetic association studies have identified many genetic variants associated with obesity, but their clinical utility for obesity treatment is currently limited (Loos, 2012). Elucidation of the functional consequences of these genetic variants are needed to advance personalized remedies targeting specific deficits on an individual basis (El-Sayed Moustafa and Froguel, 2013). With this goal in mind, our observations could serve as the basis for developing therapies aimed at potentiating hypothalamic BDNF signaling as a specific treatment for obesity in individuals who have the rs12291063 CC genotype.
EXPERIMENTAL PROCEDURES
Please see Supplemental Experimental Procedures for additional details.
Human brain samples
Subjects
Brain tissue was obtained from the Offices of the Chief Medical Examiner of Washington, D.C., and of Northern Virginia (Clinical Brain Disorders Branch, IRP, NIMH collection) at autopsy from non-neurologic non-psychiatric control subjects who suffered sudden deaths. All the tissues were donated with informed consent from the next-of-kin. Further details on cohort selection have been reported previously (Lipska et al., 2006). The region of VMH was dissected from frozen brain specimens using anatomic landmarks. Quantitative PCR and SNP genotyping were performed (see Supplementary Experimental Procedures).
Human subjects
Four cohorts were investigated: adults of African American race from the Population Architecture using Genomics and Epidemiology (PAGE) consortia (Gong et al., 2013); adults of African American race from the Healthy Aging in Neighborhoods of Diversity across the Life Span study (HANDLS) (Evans et al., 2010); pediatric volunteers participating in clinical studies conducted at the NIH; and children and adolescents of Hispanic heritage from the Viva La Familia longitudinal study (Butte et al., 2006). Informed consent and assent were obtained from adult subjects and parents/guardians of minors. All methods for obtaining clinical data from the subjects were approved by the respective Institutional Review Board at each site.
Bioinformatics
SNPInspector software (Genomatix Software Inc., Ann Arbor, MI) was used to identify candidate transcription factors at the SNP loci.
Protein isolation and identification
A streptavidin-agarose bead pull-down procedure, as previously described (Deng et al., 2003), was used to isolate nuclear proteins that bind at the rs12291063 locus. Excised gel bands were submitted to Protech, Inc. (Fairview Village, PA), for protein isolation and sequencing by mass spectrometry.
Electrophoretic mobility shift assays (EMSAs)
5’-biotinylated and unlabeled 25 bp oligonucleotides containing the major and minor allele sequences at the rs12291063 locus were obtained from Invitrogen. Recombinant hnRNPD0B protein expressed in E.coli, was obtained from OriGene Technologies (Rockville, MD). EMSAs with competition and supershift assays were performed using LightShift Chemiluminescent EMSA kit (Pierce Protein Biology Products, Rockford, IL) and results were digitized and quantified as previously described (Schneider et al., 2012).
Luciferase reporter and siRNA knockdown assays
250bp sequences containing either the major or the minor allele of rs12291063 were cloned into pGL3 Luciferase Reporter Vector driven by an SV40 promoter (Promega, Madison, WI) at the Hindlll site between the promoter and the firefly Luc gene. HEK-293 cells were cultured and transiently transfected with the constructs using FuGENE HD Transfection Reagent (Promega). For luciferase activity assay with hnRNPD depletion, HEK293 cells were transiently co-transfected with HNRNP siRNA or Control siRNA (SignalSilence, Cell Signaling Technology, MA). Dual Luciferase Reporter Assay System (Promega) was used to quantify firefly luciferase activity. Efficiency of siRNA knockdown for hnRNPD was verified by Western blot using pan-hnRNP antibody and GAPDH antibody (Santa Cruz Technology).
Statistical analyses
SPSS Statistics Version 17.0 software (IBM, Armonk, NY) was used for statistical analyses. Univariate analyses of covariance (ANCOVAs) with post-hoc pair-wise least significant difference (LSD) comparisons were performed to assess the association of genotype with BDNF expression, BMI, BMI-Z, body fat percentage and fat mass. EMSA band intensities from 3 separate experiments were compared using ANOVA with post-hoc LSD. Firefly luciferase activity and hnRNP protein expression were compared using 2-tailed, independent samples T-tests.
Supplementary Material
ACKNOWLEDGMENTS
This research was supported by the Intramural Research Program of NICHD and NIMH with supplemental funding from the NIH Bench to Bedside Program to J.C.H. and the National Institute of Minority Health and Health Disparities to J.A.Y. The Viva la Familia studies were supported by the NIH (R01 DK59264 and R01 DK080457 to N.F.B.). A.J.K. is supported by the NIDDK and the NIH Division of Nutrition Research Coordination. The Population Architecture Using Genomics and Epidemiology (PAGE) program is funded by NHGRI, supported by U01HG004803 (CALiCo), U01HG004798 (EAGLE), U01HG004802 (MEC), U01HG004790 (WHI), and U01HG004801 (Coordinating Center), and their respective NHGRI ARRA supplements. We thank Ms. Amy Deep-Soboslay, and Drs. Lewellyn B. Bigelow and Mary M. Herman for their contributions in assembling the postmortem human brain cohorts for study, Dr. Amanda Preston for editorial assistance, and the families of the decedents for their generous donation of tissue. J.A.Y. is a Commissioned Officer of the United States Public Health Service. The opinions or assertions contained herein are the private views of the authors and are not to be construed as official or as reflecting the views of the Public Health Service, the Department of the Navy, Department of Defense or Department of Health and Human Services.
Footnotes
AUTHOR CONTRIBUTIONS
Z.M., T.M.H., B.K.L., K.M., P.W., C.J.O., L.A.H., G.I.P., R.T., C.L., L.J.M., J.W.T., J.E.K., J.A.Y., and J.C.H. planned and performed experiments. T.A.C., A.P.D. and A.J.K. enrolled subjects in NIH clinical studies and performed the associated experiments. K.H., V.S.V., S.A.C, N.F.B. and A.G.C. enrolled subjects in the Viva la Familia Study and performed the associated experiments. M.A.N., A.B.Z, A.B.S, M.K.E, B.M. and S.M. enrolled subjects in the HANDLS study and performed the associated experiments. J.E.K. and J.A.Y., and J.C.H. conceived the study. Z.M., J.W.T., J.E.K., J.A.Y., and J.C.H. wrote the manuscript with input from all authors.
The authors declare no competing financial interests.
REFERENCES
- Butte NF, Cai G, Cole SA, Comuzzie AG. Viva la Familia Study: genetic and environmental contributions to childhood obesity and its comorbidities in the Hispanic population. The American journal of clinical nutrition. 2006;84:646–654. doi: 10.1093/ajcn/84.3.646. [DOI] [PubMed] [Google Scholar]
- Choquet H, Meyre D. Genetics of Obesity: What have we Learned? Curr Genomics. 2011;12:169–179. doi: 10.2174/138920211795677895. [DOI] [PMC free article] [PubMed] [Google Scholar]
- Cooper DN. Functional intronic polymorphisms: Buried treasure awaiting discovery within our genes. Human genomics. 2010;4:284–288. doi: 10.1186/1479-7364-4-5-284. [DOI] [PMC free article] [PubMed] [Google Scholar]
- Deng WG, Zhu Y, Montero A, Wu KK. Quantitative analysis of binding of transcription factor complex to biotinylated DNA probe by a streptavidin-agarose pulldown assay. Analytical biochemistry. 2003;323:12–18. doi: 10.1016/j.ab.2003.08.007. [DOI] [PubMed] [Google Scholar]
- El-Sayed Moustafa JS, Froguel P. From obesity genetics to the future of personalized obesity therapy. Nature reviews. Endocrinology. 2013;9:402–413. doi: 10.1038/nrendo.2013.57. [DOI] [PubMed] [Google Scholar]
- Evans MK, Lepkowski JM, Powe NR, LaVeist T, Kuczmarski MF, Zonderman AB. Healthy aging in neighborhoods of diversity across the life span (HANDLS): overcoming barriers to implementing a longitudinal, epidemiologic, urban study of health, race, and socioeconomic status. Ethn Dis. 2010;20:267–275. [PMC free article] [PubMed] [Google Scholar]
- Gao J, Li Z, Paulin D. A novel site, Mt, in the human desmin enhancer is necessary for maximal expression in skeletal muscle. The Journal of biological chemistry. 1998;273:6402–6409. doi: 10.1074/jbc.273.11.6402. [DOI] [PubMed] [Google Scholar]
- Gong J, Schumacher F, Lim U, Hindorff LA, Haessler J, Buyske S, Carlson CS, Rosse S, Buzkova P, Fornage M, et al. Fine Mapping and Identification of BMI Loci in African Americans. American journal of human genetics. 2013;93:661–671. doi: 10.1016/j.ajhg.2013.08.012. [DOI] [PMC free article] [PubMed] [Google Scholar]
- Han JC, Liu QR, Jones M, Levinn RL, Menzie CM, Jefferson-George KS, Adler-Wailes DC, Sanford EL, Lacbawan FL, Uhl GR, et al. Brain-derived neurotrophic factor and obesity in the WAGR syndrome. The New England journal of medicine. 2008;359:918–927. doi: 10.1056/NEJMoa0801119. [DOI] [PMC free article] [PubMed] [Google Scholar]
- Lipska BK, Deep-Soboslay A, Weickert CS, Hyde TM, Martin CE, Herman MM, Kleinman JE. Critical factors in gene expression in postmortem human brain: Focus on studies in schizophrenia. Biological psychiatry. 2006;60:650–658. doi: 10.1016/j.biopsych.2006.06.019. [DOI] [PubMed] [Google Scholar]
- Loos RJ. Genetic determinants of common obesity and their value in prediction. Best practice & research. Clinical endocrinology & metabolism. 2012;26:211–226. doi: 10.1016/j.beem.2011.11.003. [DOI] [PubMed] [Google Scholar]
- Lyons WE, Mamounas LA, Ricaurte GA, Coppola V, Reid SW, Bora SH, Wihler C, Koliatsos VE, Tessarollo L. Brain-derived neurotrophic factor-deficient mice develop aggressiveness and hyperphagia in conjunction with brain serotonergic abnormalities. Proc Natl Acad Sci U S A. 1999;96:15239–15244. doi: 10.1073/pnas.96.26.15239. [DOI] [PMC free article] [PubMed] [Google Scholar]
- Pruunsild P, Kazantseva A, Aid T, Palm K, Timmusk T. Dissecting the human BDNF locus: bidirectional transcription, complex splicing, and multiple promoters. Genomics. 2007;90:397–406. doi: 10.1016/j.ygeno.2007.05.004. [DOI] [PMC free article] [PubMed] [Google Scholar]
- Schneider CA, Rasband WS, Eliceiri KW. NIH Image to ImageJ: 25 years of image analysis. Nature methods. 2012;9:671–675. doi: 10.1038/nmeth.2089. [DOI] [PMC free article] [PubMed] [Google Scholar]
- Sherry ST, Ward MH, Kholodov M, Baker J, Phan L, Smigielski EM, Sirotkin K. dbSNP: the NCBI database of genetic variation. Nucleic Acids Res. 2001;29:308–311. doi: 10.1093/nar/29.1.308. [DOI] [PMC free article] [PubMed] [Google Scholar]
- Speliotes EK, Willer CJ, Berndt SI, Monda KL, Thorleifsson G, Jackson AU, Lango Allen H, Lindgren CM, Luan J, Magi R, et al. Association analyses of 249,796 individuals reveal 18 new loci associated with body mass index. Nature genetics. 2010;42:937–948. doi: 10.1038/ng.686. [DOI] [PMC free article] [PubMed] [Google Scholar]
- Tolnay M, Baranyi L, Tsokos GC. Heterogeneous nuclear ribonucleoprotein D0 contains transactivator and DNA-binding domains. Biochem J 348 Pt. 2000;1:151–158. [PMC free article] [PubMed] [Google Scholar]
- Tolnay M, Vereshchagina LA, Tsokos GC. Heterogeneous nuclear ribonucleoprotein D0B is a sequence-specific DNA-binding protein. Biochem J. 1999;338:417–425. Pt 2. [PMC free article] [PubMed] [Google Scholar]
- Unger TJ, Calderon GA, Bradley LC, Sena-Esteves M, Rios M. Selective deletion of Bdnf in the ventromedial and dorsomedial hypothalamus of adult mice results in hyperphagic behavior and obesity. The Journal of neuroscience : the official journal of the Society for Neuroscience. 2007;27:14265–14274. doi: 10.1523/JNEUROSCI.3308-07.2007. [DOI] [PMC free article] [PubMed] [Google Scholar]
- Xu B, Goulding EH, Zang K, Cepoi D, Cone RD, Jones KR, Tecott LH, Reichardt LF. Brain-derived neurotrophic factor regulates energy balance downstream of melanocortin-4 receptor. Nature neuroscience. 2003;6:736–742. doi: 10.1038/nn1073. [DOI] [PMC free article] [PubMed] [Google Scholar]
- Zheng F, Zhou X, Moon C, Wang H. Regulation of brain-derived neurotrophic factor expression in neurons. Int J Physiol Pathophysiol Pharmacol. 2012;4:188–200. [PMC free article] [PubMed] [Google Scholar]
Associated Data
This section collects any data citations, data availability statements, or supplementary materials included in this article.


