

Summary
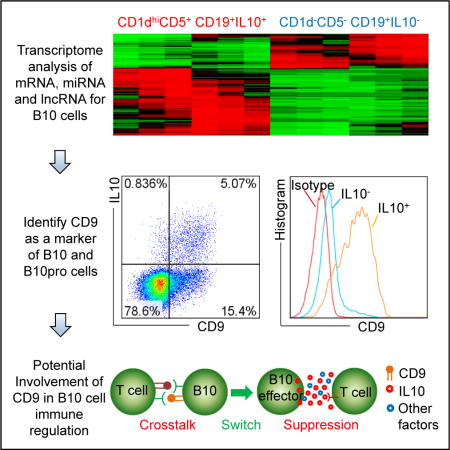
Regulatory B cells (Breg) have immune suppressive functions in various autoimmune/inflammation models and diseases, and are found enriched in diverse B-cell subsets. The lack of a unique marker or set of markers efficiently identifying Breg cells impedes detailed investigation into their origin, development, and immunological roles. Here, we perform transcriptome analysis of IL10-expressing B cells to identify key regulators for Breg biogenesis and function and identify CD9, a tetraspanin-family transmembrane protein, as a key surface marker for most mouse IL10+ B cells and their progenitors. CD9 plays a role in the suppressive function of IL10+ B cells in ex-vivo T cell proliferation assays through a mechanism that is dependent upon B/T cell interactions. CD9+ B cells also demonstrate inhibition of Th1 mediated contact hypersensitivity in an in vivo model system. Taken together, our findings implicate CD9 in the immunosuppressive activity of regulatory B cells.
Graphical abstract
Introduction
In addition to the normal antibody generating function, a subset of B cells, known as regulatory B cells (Bregs), can suppress several immune processes including allergy, autoimmunity, antigen presentation, and pro-inflammatory cytokine production (DiLillo et al., 2010; Mauri and Bosma, 2012). Breg regulation has been demonstrated in various autoimmune- and inflammation-induced mouse models (Mauri et al., 2003; Sattler et al., 2014; Yanaba et al., 2008; Yoshizaki et al., 2012) and aberrant regulation of Bregs has been reported in human diseases such as systemic lupus erythematosus (Blair et al., 2010), allergies (van de Veen et al., 2013), and autoimmune diseases and disorders (Kalampokis et al., 2013).
Bregs are found enriched in phenotypically diverse B-cell subsets. In mice, reported markers of Bregs include CD1d, CD5, CD19, CD11b, CD21, CD23, CD32b, CD138, IgM, IgD, TIM-1 and CX3CR1 (Ding et al., 2011; Mauri and Bosma, 2012; Shen et al., 2014; Stolp et al., 2014; Yanaba et al., 2008) whereas in humans Bregs markers have been reported to include CD1d, CD5, CD19, CD24, CD25, CD27, CD38, CD48, CD71, CD73, CD148 and IgM (Iwata et al., 2011; Lindner et al., 2013; Mauri and Bosma, 2012; Stolp et al., 2014; van de Veen et al., 2013). Mice and humans thus possess distinct sets of Breg markers and there is a scarcity of unique markers that would exclusively and exhaustively identify Breg cells.
It has been suggested that signals triggering the B cell receptor (BCR)—CD40 ligation and Toll-like receptor engagement—may play important roles in the development and/or activation of Bregs (Blair et al., 2009; Lampropoulou et al., 2008). Nonetheless, the precise cellular origins of Bregs remain unknown, as do their developmental pathways. It has been proposed that Bregs may derive from a unique progenitor (Yanaba et al., 2009), or differentiate from distinct subsets of B cells triggered by a particular stimulus (Zhang, 2013). These two hypotheses are not mutually exclusive but need to be further investigated. Isolating unique markers identifying all Bregs may be a crucial first step in determining their ontology. In this study, we have investigated the transcriptome of B10 cells, an antigen-specific CD1dhiCD5+CD19+IL10competent Breg cell (DiLillo et al., 2010; Yanaba et al., 2008), and identified CD9 as an important B10 cell marker.
Results
Identification of differentially expressed mRNAs, miRNAs, and lncRNAs in B10 cells
We sorted B10+ cells (CD1dhiCD5+CD19+Il10+) and B10− cells (CD1d−CD5−CD19+Il10−) from mouse splenic B cells (Figure S1A) for RNA-seq and microarray analysis. Together with the qRT-PCR results, the mapped reads of published B10 cellular markers, common B cell markers, and the lack of T cell markers, demonstrate high quality of the RNA-seq data (Figure S1, B–D). We analyzed the rank change (RC) and fold change (FC) of mRNAs (Figure 1A and Table S1) between B10+ and B10− cells, and generated a highly reliable list of differentially expressed mRNAs (Figure 1B). 55 mRNAs overlap between the top 100 fold change mRNAs and the top 100 rank change mRNAs and Il10 is ranked first by both methods (Figure 1C). We provide the full list of 273 differentially expressed mRNAs in Table S1. The accession number for the RNA-seq reported in this paper is GEO: GSE63426.
Figure 1. Differentially expressed mRNA, lncRNA and miRNA in B10 cells.
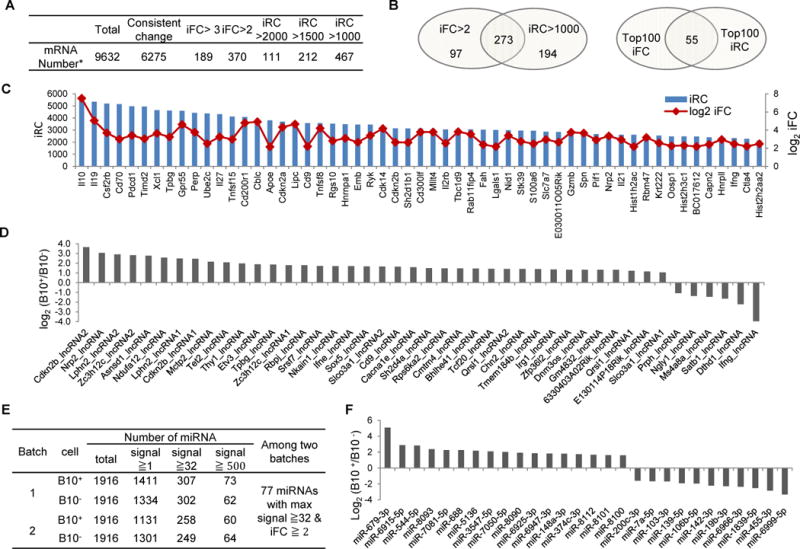
(A) Overall changes of gene expression level between B10+ cells (CD1dhiCD5+CD19+IL10+) and B10− cells (CD1d−CD5−CD19+IL10−) determined by RNA-seq. *: the number of mRNAs after removing mRNAs with FPKM<1 in both B10+ and B10− cells in any batch, and mRNA with FPKM=0 in any sample. See Supplemental Experimental Procedures for more information. (B) The distribution of genes in the top iFC and iRC groups. The gene list is summarized in Table S1. (C) The rank changes of the 55 genes existing in both the top 100 iFC and the top 100 iRC. IL10 is ranked first in both rank lists. (D) Fold change of the 44 novel lncRNAs identified from the lncRNA database (Pefanis et al., 2014; Pefanis et al., 2015). The lncRNAs are nomenclatured according to the gene closest to the lncRNA coding region. (E) General changes of miRNA expression levels between B10+ cells and B10− cells as determined by microarray analysis. “Max signal”: the maximum signal in all 4 samples of the two batches. (F) The expression changes of the miRNAs with iFC≥ 3 and max signal ≥ 32. Please also see Figure S1 and S2, Tables S1, S2, and S3.
Most of the mammalian genome has the potential to express various types of non-coding RNAs, ranging from miRNAs to lncRNAs (Fatica and Bozzoni, 2014; Hausser and Zavolan, 2014). As the RNA exosome complex is implicated in ncRNA half-life, we cross-referenced our database of lncRNAs isolated from RNA exosome knockout B cells (Pefanis et al., 2014; Pefanis et al., 2015) and found 38 upregulated lncRNAs and 6 downregulated lncRNAs from a library derived from B10+ B cells (Figure 1D; Table S1). In addition, by microarray analysis we compared the miRNA expression levels between B10+ and B10− cells. General changes in miRNA expression levels are summarized in Figure 1E; the expression changes of the miRNAs with iFC ≥ 3 and max signal ≥ 32 are shown in Figure 1F. Table S1 lists 77 differentially expressed miRNAs in B10+ cells. The accession number for the microarray data reported in this paper is GEO: GSE63374.
mRNA/miRNA pairing, prediction of upstream regulators and gene ontology term enrichment analysis
Using the Ingenuity Pathway Analysis (IPA) program (Kramer et al., 2014), we analyzed mRNA/miRNA pairing and predicted upstream regulators from the 273 differentially expressed mRNAs and the 77 differentially expressed miRNAs. We find there are 31 miRNAs targeting 134 mRNAs (Table S2). Notably, there are 56 upstream regulators differentially expressed between B10+ and B10− cells in the total of 1758 predicted upstream regulators (Table S3), and four of the 56 are transcription regulators (STAT1, CDKN2A, MYB and PRDM1).
Five interconnected stages and processes correlate tightly with Breg biogenesis and function (outlined in Figure S2). Based on the reported functions and features of various cell types in the literature, we divided the differentially expressed upstream regulators into 8 groups by the IPA program and in Figure S2 predict the potential involvement of each group in the 5 stages according to gene ontology term enrichment analysis (Table S3). Of the upstream regulators, IL10, IL33, HAVCR1 (also named TIM1), and CD5 have been reported to be important molecules for Breg biogenesis and function (Ding et al., 2011; Sattler et al., 2014; Shen et al., 2014; Yanaba et al., 2008; Yoshizaki et al., 2012).
Comparison of differentially expressed mRNAs in B10 and other cell subsets suggests CD9 is a marker of IL10competent B cells
Comparing the differentially expressed genes found in B10 cells with those found in other B cell subsets might provide important information on Breg origin and characterization. Based on data sets generated via The Immunological Genome Project (https://www.immgen.org/), differentially expressed genes were identified between B1a B cells and follicular (FO) B cells derived from spleen or peritoneal cavity, between B1a and B1b B cells from peritoneal cavity, and between marginal zone (MZ) B cells and follicular (FO) B cells from spleen (Table S4). The expression of numerous differentially expressed genes in B10 cells undergoes similar change regardless of whether the B1a cells are derived from spleen, peritoneal cavity, or MZ B cells (Figure S3A). 19 genes (underlined) including Actn1, Atxn1, Ccr6, Cd300lf, Cd9, Cfp, Csf2rb, Ctla4, Emb, Fcer2a, Fcrl5, Nek2, Nrp2, Ptpn22, Spn, Stom, Tbc1d9, Zfp318, and Zfp608 appear on at least three lists. Cd9 and Ccr1 are the only two genes appearing on all four lists, suggesting that CD9 and CCR1 may be good markers with which to identify Bregs from different B cell subsets.
Screening of unique markers found by RNA-seq identifies CD9 as a robust marker of IL10competent B cells
To find unique markers for Bregs, we examined surface expression levels of CD9, CCR1 and other proteins corresponding to the main cluster of differentiation (CD) antigens that showed differential mRNA expression levels in B10 cells (Figure 2A). As shown in Figure 2B, IL10+ B cells contain a higher percentage of cells expressing certain markers than do IL10− B cells upon treatment with anti-CD40 antibody for 48h, consistent with our RNA-seq data. Notably, the difference in CD9 expression between IL10+ and IL10− B cells at 48h is greater than that of any other tested marker(s) as well as the cells at 5h without CD40 antibody stimulation (Figure 2C). Moreover, most IL10+ B cells are CD9 positive at both 5h (87.03% ±1.22%) and 48h (87.95% ±1.25%). The same phenomenon was also found for peritoneal cavity B cells (Figure 2E). As CD9 is also a marker of all murine hematopoietic stem cells (Karlsson et al., 2013), an important question is whether the IL10+ B cells are derived from CD9+ B cells, CD9− B cells, or both. To address this issue, we sorted CD9+ and CD9− B cells from naive B cells, CD9−IL10− B cells, CD9+IL10− B cells, and CD9+IL10+ B cells from cells treated with Lipopolysaccharides (LPS), phorbol 12-myristate 13-acetate (PMA) and ionomycin (LPI) for 5h (Figure 2F). The sorted cells were cultured with CD40 antibody for 48h and LPI plus monensin (LPI+M) were added for the final 5 hours. Figure 2F shows that the progenitors of IL10competent B cells exist as CD9+ B cells. As CD9 is expressed in MZ B cells, B1 cells, and plasma cells (Won and Kearney, 2002), we evaluated the expression of CD9 and IL10 in these cell populations (Figure S3C and S3D). Although IL10+ B cells are also enriched in MZ B cells compared to FO B cells (around 30% of MZ-B cells are IL10+ while only around 5% of FO B cells are IL10+ B cells), MZ B cells only represent approximately 20% of total IL10+ B cells while FO B cells represent 40% of total IL10+ B cells. IL10+ B cells are indeed enriched in B1a and B1b cells compared to B2 cells. More than 40% of B1 cells are IL10+ B cells and this population represents more than 88% of total IL10+ B cells. The IL10+ B1 cells and IL10+ MZ B cells are all enriched in CD9 expressing B cells. Next, in mouse B10 cells we compared CD9 expression with previously described markers CD1d, CD5, CD11b, CD21, CD23, CD32b, CD138, CX3CR1, IgD, IgM, and TIM1 (Figure 3) and further confirmed that CD9 is a surface marker for a variety of mouse IL10competent B cells.
Figure 2. IL10competent B cells and their progenitors are distinguished by CD9.

(A–D) Screening markers for IL10competent B cells identified by RNA-seq. (A) The mapped reads of differentially expressed CD antigens as well as CCR1 determined by RNA-seq on B10+ and B10− cells. (B and C) Representative expression of IL10 and the molecules by total B cells (the dot plots), and expression of the molecules on CD19+IL10+ and CD19+IL10− cells (the histogram plots) determined by flow cytometry. The percent population is shown for CD19+IL10+ cells. All B cells are enriched with CD19 micro-beads and then treated with LPI+M for 5h (C) or CD40 antibody for 48h plus LPI+M for the terminal 5h (B). (D) Statistical results of expression of various molecules on IL10+ or IL10− B cells. (E) Expression of IL10 and CD9 on CD19+ B cells isolated from peritoneal cavity (PC) B cells or splenic (SP) B cells and treated with LPI+M for 5h, or CD40 antibody for 48h followed by LPI+M for the terminal 5h. Two different CD9 antibodies were used. The bar graph shows the statistical frequency of subsets in total or IL10+ B cells. (F) Expression change of IL10 and CD9 on the indicated sorted cell subsets after incubation with CD40 antibody for 48h followed by LPI+M for the terminal 5h. The bar graph shows the statistical frequency of IL10+ in the sorted subsets. Cell subsets were sorted from naive B cells treated with (for IL10 staining) or without (for CD19 and CD9 staining only) LPI for 5h. Statistical data are represented as mean with SEM. p-value was obtained by multiple t-test. Please also see Figure S3 and Table S4.
Figure 3. CD9 is a robust surface marker for mouse IL10competent B cells.
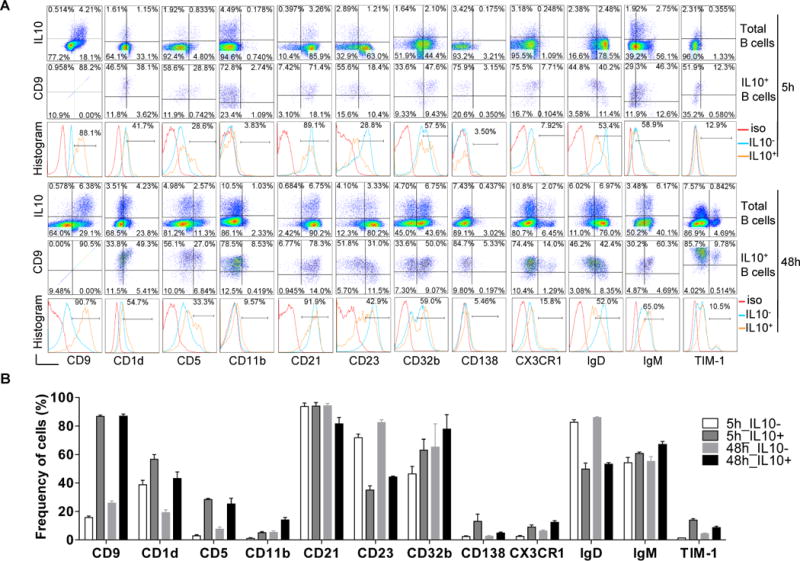
(A) Representative expression of IL10, CD9 and other reported Breg markers on total, IL10+ or IL10− B cells stimulated with LPI+M for 5h or CD40 antibody for 48h plus LPI+M for the terminal 5h. The frequency of cells expressing specific markers on IL10+ B cells is shown in the histograms. (B) The statistical frequency of subsets expressing specific markers on IL10− or IL10+ B cells. Statistical data are represented as mean with SEM.
Suppressive function of CD19+ CD9+ B cells
To check whether CD9+ B cells have immune regulatory functions, we isolated CD19+CD9+ B cells and CD19+CD9− B cells and co-cultured them with VPD450-stained CD4+ CD25− T cells. CD9+ B cells suppressed T cell proliferation more efficiently than CD9− B cells, based on VPD450 dilution in co-culture assays (B cell: T cell=400:100) at both 48h and 72h (Figure 4A). Interestingly, as shown in Figure 4B, blocking the CD9 moiety with antibody impaired the suppression of T cell growth by CD9+ B cells, suggesting that CD9 plays an important role in immune suppressive function of B10 cells. We further checked whether CD9 acts as a scavenger molecule for CD9+ B cell suppressive activity by culturing T cells and CD9+/CD9− B cells in separate compartments of a transwell plate. As shown in Figure 4C, CD9+ B cells show inhibitory effects on proliferation of T cells which are either separated from B cells by insert (T cells in receiver well) or mixed with the CD9+ B cells in insert (T cells in insert well). Additional interesting corollary conclusions emerging from these experiments include (a) even without addition of CD40 antibody and LPS during the terminal 5h of culture with PMA, ionomycin and monensin, a certain number of CD9+ B cells secreted IL10 while fewer of the CD9− B cells secreted IL10 (Figure 4D) and (b) more CD9+ cells secreted IL10 if the ratio of T cells to B cells in the co-culture increased, suggesting that IL10 secretion by B cells may require interaction between B cells and T cells. These observations suggest that CD9+ B cells may require both cross-talk with T cells and secretion of IL10 to eventually suppress CD4+ T cell proliferation. These observations have been modeled in Figure S4D and are discussed in greater detail below.
Figure 4. CD9 is involved in B10 function and biogenesis.

(A) Representative and statistical proliferation of T cells co-cultured for 48h and 72h at the indicated initial ratio with CD9+ or CD9− B cells. The statistical results are normalized by the T cells co-cultured without B cells. (B) Representative and statistical proliferation of T cells co-cultured for 72h at the indicated initial ratio with CD9+ or CD9− B cells in the presence of antibodies. (C) Representative and statistical proliferation of T cells (100×103) in the insert or in the receiver well of the transwell plate. The insert was added at the indicated initial ratio with CD9+ or CD9− B cells as shown in the bottom cartoon and incubated for 72h. (D) Statistical analysis of IL10 production by CD9+ B cells and CD9− B cells treated with PMA, ionomycin and monensin for the terminal 5h of culture. (A-D) CD9+ or CD9− B cells were sorted from CD19+ B cells treated with CD40 antibody and LPS for 5h. CD4+CD25− T cells were sorted from naive CD19− cells and then stained by VPD450 before culturing in the plates pretreated with 5ug/ml CD3e antibody. Medium was changed at 48h. (E) Ear thickness change of CD19 knockout mice adoptively transferred with CD9+ B cells or CD9− B cells in an in vivo B cell functional analysis assay. WT and CD19 KO mice injected with PBS were the controls for the experiment. The cells were sorted as described in Materials and Methods. (F) The frequency of MZ B and FO B in total B cells or IL10+ B cells, and the frequency of IL10+ B cells in total, FO, and MZ B cells. Statistical data are represented as mean with SEM. P-values were obtained by multiple t-test. Please also see Figure S4.
To ascertain whether results obtained in ex-vivo assays recapitulate in vivo function, we adoptively transferred isolated CD9+ B cells and CD9− B cells into CD19−/− mice to check the suppressive function of CD9+ B cells on Th1 cell mediated contact hypersensitivity. In comparison to CD19−/− mice injected with CD9− B cells, the ear thickness both of CD19−/− mice injected with CD9+ B cells and of WT mice injected with PBS were thinner throughout the whole process and the differences were most significant at 48h post oxazolone challenge. These observations provide evidence that CD9+ B cells possess immune regulatory function (Figure 4E).
Increased IL10competent B cells in a CD9−/− mouse model
To ascertain whether CD9 is important for IL10 production or B10 biogenesis, we employed flow cytometry to compare the expression levels of the main markers reported for Bregs from WT mice and CD9−/− mice. Consistent with a previous report (Cariappa et al., 2005), none of the checked markers was expressed at an appreciably different level on total B cells from CD9−/− and WT mice. Likewise, for IL10+ B cells isolated from CD9−/− and WT mice, no major difference in the marker expression was noted. However, on IL10+ B cells from CD9−/− mice, CD23 expression differed from the WT (Figure S4F). Further analysis indicated that more MZ B cells and approximately twice the number of IL10competent B cells exist in CD9−/− B cells compared with WT (Figures 4F, S4F and S4G), suggesting that CD9 may play an important role in B10 maturation.
Discussion
The phenotypic diversity found in Breg subsets makes the discovery of Breg origin a difficult endeavor. Unique cell surface markers, coupled with transcription factors, could provide distinct signatures (Mauri and Bosma, 2012). In this study, we profile the RNA expression of B10 cells, identify key upstream regulators, and find CD9 as a novel functional marker of most IL10competent B cells and their progenitors. The identified unique marker CD9 can separate B10 progenitors, IL10+ B cells from IL10− B cells. Thus, the identification of CD9 allows the identification of IL10+ B cells without stimulation of IL10 secretion, thereby providing a system to study unperturbed gene expression profiles of Bregs and Breg progenitors. This is especially important since Breg transcription factor activity and networks may otherwise be perturbed by stimulation with LPS, PMA, and ionomycin. Accordingly, the CD9 marker may assist in the identification of transcription factors driving Breg differentiation.
It remains unclear how and whether B10 cells regulate other cells of the immune system and whether the regulation occurs through direct cell-cell interaction or through the localized expression and supply of cytokines (DiLillo et al., 2010; Mauri and Blair, 2010). Ex-vivo functional assay of CD19+CD9+ B cells with CD9 blocking antibody demonstrated that CD9 is involved in the suppressive function of CD19+CD9+ B cells (Figure 4B). However, following interaction with CD4+ T cells in the insert of the transwell plate, CD9+ B cells are able to suppress proliferation of T cells present in a physically separate receiver well of the transwell plate (Figure 4C). Thus, it is possible that CD9 may facilitate communication of B10 cells with T cells leading to secretion of IL10 which then suppresses T cell proliferation (modeled in Figure S4D). Further experiments, particularly with CD9-conditional allele knockout mouse models, will be required to establish the true nature of CD9’s function during B cell mediated immunosuppression. A separate but untested possibility exists–that the regulatory function of CD19+CD9+ B cells results from the release of CD9 containing exosomes, since mouse exosomes contain an abundance of CD9 (Thery et al., 1999)–and the exosomes derived from mouse Tregs suppress pathogenic T helper 1 cells (Okoye et al., 2014).
Human CD9+ B cells may not have functions similar to mouse CD9+ B cells and may not represent most of the human IL10competent B cells because proteomic analysis of exosomes from human B cells (Escola et al., 1998), lymphoma cells (Yao et al., 2015) and other human cells (Hegmans et al., 2004) did not identify CD9. Perhaps there is a CD9 equivalent developmental marker for B10 cells in humans and it would be insightful to investigate the full range of tetraspanin family protein expression on the surface of human IL10+ B cells. Some identified regulators–such as CD80, CD5, HAVCR1, and IL33–have been reported to be important Breg differentiation and function factors. CD80/CD86, as well as TLRs and CD40, are important co-stimulatory molecules involved in B cell differentiation (Mann et al., 2007). CD5 is a marker shared by many reported Breg subsets. HAVCR1 is a co-stimulatory molecule enriched in IL10 producing Breg cells that can be induced by Havcr1 crosslinking using a Havcr1 specific antibody (Ding et al., 2011). These are all worthy of study but the many regulators, including both protein factors and non-coding RNAs we have reported here, need to be studied further to determine their true biological potential in Breg biology.
Experimental Procedures
Mouse strains and spleens
C57BL/6J mice and CD19 knockout mice (B6.129P2(C)-Cd19tm1(cre)Cgn/J) were purchased from The Jackson Laboratory. Spleens of CD9 knockout mice (Miyado et al., 2000) and WT mice were obtained from the animal facility of Osaka University Graduate School of Medicine in Japan. All animals were handled in strict accordance with the Columbia University “ethical treatment of research animals” guidelines.
Cell isolation, culture, staining, and sorting
B cells were enriched from mouse splenocytes or peritoneal cavity cells through CD19 positive selection or CD90.2 negative selection using MACS® (Miltenyi Biotec) columns. B cells were cultured in RPMI1640 medium containing 10% FBS. 1ug/ml CD40 antibody, 10ug/ml LPS, 50ng/ml PMA, 500ng/ml ionomycin, and 2uM monensin were added as required for specific experiments. T cells were cultured with or without B cells in RPMI1640 medium containing 10% FBS with 5ug/ml CD3e antibody bound to the well surface of the plate. See Supplemental Experimental Procedures for more information on cell staining and sorting.
RNA preparation, qRT-PCR, RNA expression profiling, and IPA analysis
Total RNA was prepared from isolated B10+ cells and B10− cells. A fraction of total RNA was used for miRNA analysis (GEO: GSE63374) by hybridization to microarrays with Sanger miRBase Release 20.0, a fraction for qRT-PCR validation of RNA-seq, and the remainder was used for further RNA sequencing (GEO: GSE63426). An independent repeat was performed to enhance the reliability. Reads were mapped to the mouse genome (mm9) and normalized expression level FPKM (Fragments Per Kilobase of transcript per Million mapped reads) of known genes and transcripts was obtained. Rank change (RC) and fold change (FC) of mRNAs between B10+ and B10− cells were analyzed. The generated list of differentially expressed factors was analyzed by “Core Analysis” with the IPA (Ingenuity Pathway Analysis) program (Qiagen) (Kramer et al., 2014).
The qRT-PCR primer pairs used for coding RNAs were obtained from PrimerBank (Spandidos et al., 2010) and the primer pairs for noncoding RNA were designed with DNASTAR Lasergene (Figure S1E).
Ex-vivo B cell functional analysis
VPD450 (BD Biosciences) stained CD4+CD25− T cells (100 or 200×103) were co-cultured with different numbers of autologous CD19+CD9+ B cells or CD19+CD9− B cells with or without the addition of 10ug/ml blocking antibody of CD9 (Biolegend, MZ3 clone) or isotype control. The co-culture was incubated with plate-bound CD3e antibody for 72h. Medium was changed at 48h. T cell proliferation was detected by dilution of VPD450 and the intracellular IL10 staining was performed after the cells were stimulated with PMA, ionomycin and monensin for the terminal 5h of culture. For assays with transwells (Costar™ HTS Transwell™ -96 Well) shown in Figure 4C, VPD450 stained CD4+CD25− T cells (100×103) were seeded in each well of both the receiver plate and the insert. The insert well was also loaded with different numbers of autologous CD19+CD9+ B cells or CD19+CD9− B cells. T cell proliferation was measured after 72h in culture.
In vivo B cell functional analysis
The experiment was performed with mice experiencing an induced CHS reaction as described (Yanaba et al., 2008). See Supplemental Experimental Procedures for more information.
Statistics
Statistical significance was determined by Prism software (GraphPad).
Supplementary Material
Acknowledgments
We thank Dr. Ulf Klein for critically reading the manuscript; and Dr. Donna Farber, Dr. Kang Liu, and Joseph Thome for experimental guidance. This work was supported by grants from NIH (1DP2OD008651-01) and NIAID (1R01AI099195-01A1) to U.B., Trustees of Columbia University faculty startup funds and the Irma T. Hirschl Charitable Trust (to U.B.), U.B. is a fellow of the Leukemia and Lymphoma Society of America, J.W. was supported by a Precision Medicine Initiative Fellowship from Columbia University (UL1 TR000040), I.I.I is supported by NIH (R01-DK098378) and CCFA (SRA#259540) and Pew Charitable trust. J.K.C. was supported by the Integrated Program in Cellular, Molecular and Biomedical Studies.
Footnotes
Publisher's Disclaimer: This is a PDF file of an unedited manuscript that has been accepted for publication. As a service to our customers we are providing this early version of the manuscript. The manuscript will undergo copyediting, typesetting, and review of the resulting proof before it is published in its final citable form. Please note that during the production process errors may be discovered which could affect the content, and all legal disclaimers that apply to the journal pertain.
Authorship contributions: J.S. and U.B. designed and interpreted all the experiments, E.P. and I.I.I. assisted in designing some of them; J.S. and J.W. performed bioinformatics analysis with guidance from R.R.; J.S. performed all the experiments, J.C., G.R., and J.K.C. assisted in some of them; I.T. and Y.T. provided CD9−/− mice; J.S. and U.B. wrote the manuscript.
Competing financial interests: The authors declare they have no competing financial interests.
References
- Blair PA, Chavez-Rueda KA, Evans JG, Shlomchik MJ, Eddaoudi A, Isenberg DA, Ehrenstein MR, Mauri C. Selective targeting of B cells with agonistic anti-CD40 is an efficacious strategy for the generation of induced regulatory T2-like B cells and for the suppression of lupus in MRL/lpr mice. Journal of immunology. 2009;182:3492–3502. doi: 10.4049/jimmunol.0803052. [DOI] [PMC free article] [PubMed] [Google Scholar]
- Blair PA, Norena LY, Flores-Borja F, Rawlings DJ, Isenberg DA, Ehrenstein MR, Mauri C. CD19(+)CD24(hi)CD38(hi) B cells exhibit regulatory capacity in healthy individuals but are functionally impaired in systemic Lupus Erythematosus patients. Immunity. 2010;32:129–140. doi: 10.1016/j.immuni.2009.11.009. [DOI] [PubMed] [Google Scholar]
- Cariappa A, Shoham T, Liu H, Levy S, Boucheix C, Pillai S. The CD9 tetraspanin is not required for the development of peripheral B cells or for humoral immunity. Journal of immunology. 2005;175:2925–2930. doi: 10.4049/jimmunol.175.5.2925. [DOI] [PubMed] [Google Scholar]
- DiLillo DJ, Matsushita T, Tedder TF. B10 cells and regulatory B cells balance immune responses during inflammation, autoimmunity, and cancer. Ann Ny Acad Sci. 2010;1183:38–57. doi: 10.1111/j.1749-6632.2009.05137.x. [DOI] [PubMed] [Google Scholar]
- Ding Q, Yeung M, Camirand G, Zeng Q, Akiba H, Yagita H, Chalasani G, Sayegh MH, Najafian N, Rothstein DM. Regulatory B cells are identified by expression of TIM-1 and can be induced through TIM-1 ligation to promote tolerance in mice. J Clin Invest. 2011;121:3645–3656. doi: 10.1172/JCI46274. [DOI] [PMC free article] [PubMed] [Google Scholar]
- Escola JM, Kleijmeer MJ, Stoorvogel W, Griffith JM, Yoshie O, Geuze HJ. Selective enrichment of tetraspan proteins on the internal vesicles of multivesicular endosomes and on exosomes secreted by human B-lymphocytes. The Journal of biological chemistry. 1998;273:20121–20127. doi: 10.1074/jbc.273.32.20121. [DOI] [PubMed] [Google Scholar]
- Fatica A, Bozzoni I. Long non-coding RNAs: new players in cell differentiation and development. Nature reviews Genetics. 2014;15:7–21. doi: 10.1038/nrg3606. [DOI] [PubMed] [Google Scholar]
- Hausser J, Zavolan M. Identification and consequences of miRNA-target interactions - beyond repression of gene expression. Nature reviews. Genetics. 2014;15:599–612. doi: 10.1038/nrg3765. [DOI] [PubMed] [Google Scholar]
- Hegmans JP, Bard MP, Hemmes A, Luider TM, Kleijmeer MJ, Prins JB, Zitvogel L, Burgers SA, Hoogsteden HC, Lambrecht BN. Proteomic analysis of exosomes secreted by human mesothelioma cells. The American journal of pathology. 2004;164:1807–1815. doi: 10.1016/S0002-9440(10)63739-X. [DOI] [PMC free article] [PubMed] [Google Scholar]
- Iwata Y, Matsushita T, Horikawa M, Dilillo DJ, Yanaba K, Venturi GM, Szabolcs PM, Bernstein SH, Magro CM, Williams AD, et al. Characterization of a rare IL-10-competent B-cell subset in humans that parallels mouse regulatory B10 cells. Blood. 2011;117:530–541. doi: 10.1182/blood-2010-07-294249. [DOI] [PMC free article] [PubMed] [Google Scholar]
- Kalampokis I, Yoshizaki A, Tedder TF. IL-10-producing regulatory B cells (B10 cells) in autoimmune disease. Arthritis Res Ther. 2013;15 doi: 10.1186/ar3907. [DOI] [PMC free article] [PubMed] [Google Scholar]
- Karlsson G, Rorby E, Pina C, Soneji S, Reckzeh K, Miharada K, Karlsson C, Guo Y, Fugazza C, Gupta R, et al. The tetraspanin CD9 affords high-purity capture of all murine hematopoietic stem cells. Cell Rep. 2013;4:642–648. doi: 10.1016/j.celrep.2013.07.020. [DOI] [PubMed] [Google Scholar]
- Kramer A, Green J, Pollard J, Jr, Tugendreich S. Causal analysis approaches in Ingenuity Pathway Analysis. Bioinformatics. 2014;30:523–530. doi: 10.1093/bioinformatics/btt703. [DOI] [PMC free article] [PubMed] [Google Scholar]
- Lampropoulou V, Hoehlig K, Roch T, Neves P, Gomez EC, Sweenie CH, Hao Y, Freitas AA, Steinhoff U, Anderton SM, Fillatreau S. TLR-activated B cells suppress T cell-mediated autoimmunity. Journal of immunology. 2008;180:4763–4773. doi: 10.4049/jimmunol.180.7.4763. [DOI] [PubMed] [Google Scholar]
- Lindner S, Dahlke K, Sontheimer K, Hagn M, Kaltenmeier C, Barth TF, Beyer T, Reister F, Fabricius D, Lotfi R, et al. Interleukin 21-induced granzyme B-expressing B cells infiltrate tumors and regulate T cells. Cancer research. 2013;73:2468–2479. doi: 10.1158/0008-5472.CAN-12-3450. [DOI] [PubMed] [Google Scholar]
- Mann MK, Maresz K, Shriver LP, Tan Y, Dittel BN. B cell regulation of CD4+CD25+ T regulatory cells and IL-10 via B7 is essential for recovery from experimental autoimmune encephalomyelitis. Journal of immunology. 2007;178:3447–3456. doi: 10.4049/jimmunol.178.6.3447. [DOI] [PubMed] [Google Scholar]
- Mauri C, Blair PA. Regulatory B cells in autoimmunity: developments and controversies. Nat Rev Rheumatol. 2010;6:636–643. doi: 10.1038/nrrheum.2010.140. [DOI] [PubMed] [Google Scholar]
- Mauri C, Bosma A. Immune regulatory function of B cells. Annual review of immunology. 2012;30:221–241. doi: 10.1146/annurev-immunol-020711-074934. [DOI] [PubMed] [Google Scholar]
- Mauri C, Gray D, Mushtaq N, Londei M. Prevention of arthritis by interleukin 10-producing B cells. The Journal of experimental medicine. 2003;197:489–501. doi: 10.1084/jem.20021293. [DOI] [PMC free article] [PubMed] [Google Scholar]
- Miyado K, Yamada G, Yamada S, Hasuwa H, Nakamura Y, Ryu F, Suzuki K, Kosai K, Inoue K, Ogura A, et al. Requirement of CD9 on the egg plasma membrane for fertilization. Science. 2000;287:321–324. doi: 10.1126/science.287.5451.321. [DOI] [PubMed] [Google Scholar]
- Okoye IS, Coomes SM, Pelly VS, Czieso S, Papayannopoulos V, Tolmachova T, Seabra MC, Wilson MS. MicroRNA-containing T-regulatory-cell-derived exosomes suppress pathogenic T helper 1 cells. Immunity. 2014;41:89–103. doi: 10.1016/j.immuni.2014.05.019. [DOI] [PMC free article] [PubMed] [Google Scholar]
- Pefanis E, Wang J, Rothschild G, Lim J, Chao J, Rabadan R, Economides AN, Basu U. Noncoding RNA transcription targets AID to divergently transcribed loci in B cells. Nature. 2014;514:389–393. doi: 10.1038/nature13580. [DOI] [PMC free article] [PubMed] [Google Scholar]
- Pefanis E, Wang J, Rothschild G, Lim J, Kazadi D, Sun J, Federation A, Chao J, Elliott O, Liu ZP, et al. RNA exosome-regulated long non-coding RNA transcription controls super-enhancer activity. Cell. 2015;161:774–789. doi: 10.1016/j.cell.2015.04.034. [DOI] [PMC free article] [PubMed] [Google Scholar]
- Sattler S, Ling GS, Xu D, Hussaarts L, Romaine A, Zhao H, Fossati-Jimack L, Malik T, Cook HT, Botto M, et al. IL-10-producing regulatory B cells induced by IL-33 (Breg(IL-33)) effectively attenuate mucosal inflammatory responses in the gut. Journal of autoimmunity. 2014;50:107–122. doi: 10.1016/j.jaut.2014.01.032. [DOI] [PMC free article] [PubMed] [Google Scholar]
- Shen P, Roch T, Lampropoulou V, O’Connor RA, Stervbo U, Hilgenberg E, Ries S, Dang VD, Jaimes Y, Daridon C, et al. IL-35-producing B cells are critical regulators of immunity during autoimmune and infectious diseases. Nature. 2014;507:366–370. doi: 10.1038/nature12979. [DOI] [PMC free article] [PubMed] [Google Scholar]
- Spandidos A, Wang X, Wang H, Seed B. PrimerBank: a resource of human and mouse PCR primer pairs for gene expression detection and quantification. Nucleic acids research. 2010;38:D792–799. doi: 10.1093/nar/gkp1005. [DOI] [PMC free article] [PubMed] [Google Scholar]
- Stolp J, Turka LA, Wood KJ. B cells with immune-regulating function in transplantation. Nat Rev Nephrol. 2014;10:389–397. doi: 10.1038/nrneph.2014.80. [DOI] [PubMed] [Google Scholar]
- Thery C, Regnault A, Garin J, Wolfers J, Zitvogel L, Ricciardi-Castagnoli P, Raposo G, Amigorena S. Molecular characterization of dendritic cell-derived exosomes. Selective accumulation of the heat shock protein hsc73. J Cell Biol. 1999;147:599–610. doi: 10.1083/jcb.147.3.599. [DOI] [PMC free article] [PubMed] [Google Scholar]
- van de Veen W, Stanic B, Yaman G, Wawrzyniak M, Sollner S, Akdis DG, Ruckert B, Akdis CA, Akdis M. IgG4 production is confined to human IL-10-producing regulatory B cells that suppress antigen-specific immune responses. The Journal of allergy and clinical immunology. 2013;131:1204–1212. doi: 10.1016/j.jaci.2013.01.014. [DOI] [PubMed] [Google Scholar]
- Won WJ, Kearney JF. CD9 is a unique marker for marginal zone B cells, B1 cells, and plasma cells in mice. Journal of immunology. 2002;168:5605–5611. doi: 10.4049/jimmunol.168.11.5605. [DOI] [PubMed] [Google Scholar]
- Yanaba K, Bouaziz JD, Haas KM, Poe JC, Fujimoto M, Tedder TF. A regulatory B cell subset with a unique CD1dhiCD5+ phenotype controls T cell-dependent inflammatory responses. Immunity. 2008;28:639–650. doi: 10.1016/j.immuni.2008.03.017. [DOI] [PubMed] [Google Scholar]
- Yanaba K, Bouaziz JD, Matsushita T, Tsubata T, Tedder TF. The development and function of regulatory B cells expressing IL-10 (B10 cells) requires antigen receptor diversity and TLR signals. Journal of immunology. 2009;182:7459–7472. doi: 10.4049/jimmunol.0900270. [DOI] [PMC free article] [PubMed] [Google Scholar]
- Yao Y, Wei W, Sun J, Chen L, Deng X, Ma L, Hao S. Proteomic analysis of exosomes derived from human lymphoma cells. Eur J Med Res. 2015;20:8. doi: 10.1186/s40001-014-0082-4. [DOI] [PMC free article] [PubMed] [Google Scholar]
- Yoshizaki A, Miyagaki T, DiLillo DJ, Matsushita T, Horikawa M, Kountikov EI, Spolski R, Poe JC, Leonard WJ, Tedder TF. Regulatory B cells control T-cell autoimmunity through IL-21-dependent cognate interactions. Nature. 2012;491:264–268. doi: 10.1038/nature11501. [DOI] [PMC free article] [PubMed] [Google Scholar]
- Zhang X. Regulatory functions of innate-like B cells. Cellular & molecular immunology. 2013;10:113–121. doi: 10.1038/cmi.2012.63. [DOI] [PMC free article] [PubMed] [Google Scholar]
Associated Data
This section collects any data citations, data availability statements, or supplementary materials included in this article.