Abstract
PURPOSE
To develop a 4D-MRI technique to characterize the average respiratory tumor motion for abdominal radiotherapy planning.
METHODS
A continuous spoiled gradient echo sequence was implemented with 3D radial trajectory and 1D self-gating for respiratory motion detection. Data were retrospectively sorted into different respiratory phases based on their temporal locations within a respiratory cycle, and each phase was reconstructed via a self-calibrating CG-SENSE program. Motion phantom, healthy volunteer and patient studies were performed to validate the respiratory motion detected by the proposed method against that from a 2D real-time protocol.
RESULTS
The proposed method successfully visualized the respiratory motion in phantom and human subjects. 4D-MRI and real-time 2D-MRI yielded comparable superior-inferior (SI) motion amplitudes (intra-class correlation = 0.935) with up-to 1 pixel mean absolute differences in SI displacements over 10 phases and high cross-correlation between phase-resolved displacements (phantom: 0.985; human: 0.937–0.985). Comparable anterior-posterior and left-right displacements of the tumor or gold fiducial between 4D and real-time 2D-MRI were also observed in the two patients, and the hysteresis effect was shown in their 3D trajectories.
CONCLUSION
We demonstrated the feasibility of the proposed 4D-MRI technique to characterize abdominal respiratory motion, which may provide valuable information for radiotherapy planning.
Keywords: 4D-MRI, 3D radial sampling, self-gating, respiratory motion, hysteresis, radiotherapy planning
INTRODUCTION
In free-breathing radiotherapy treatment planning, respiration-induced motion in abdominal organs poses significant challenges to accurate determination of treatment margins for target tumors. Inaccurate margin prescription may potentially result in under-dosage in tumors and/or over-dosage in healthy tissues, which may lead to poor treatment outcomes (1–3). As one of the important steps in the determination of treatment margins, the internal target volume (ITV), derived from the union of three-dimensional (3D) volumes of the tumor at all respiratory phases is needed to account for the variation of the tumor in position, shape, and size due to respiration (4). Moreover, the information on the spatial relationship in three dimensions between the tumor and surrounding healthy tissues is desirable to optimize radiation beam arrangement. The clinically standard approach to treatment planning is four-dimensional (4D) computed tomography (CT) that consecutively acquires a series of phase-resolved 2D slices and retrospectively sort them into respiratory phase-resolved 3D image sets (5–9). However, 4D-CT has a number of limitations including: 1) high dose of ionizing radiation caused by repetitive irradiation at the same location necessary to image a complete respiratory cycle; 2) suboptimal tumor delineation due to poor soft tissue contrast; 3) and most importantly, susceptibility to manifest motion artifacts (i.e. resorting artifacts) caused by breathing pattern variation between individual 2D slice acquisitions (10).
As an alternative, magnetic resonance imaging (MRI) can also be used to generate respiratory phase or time-resolved images for treatment planning. Real-time 2D-MRI has been utilized to collect cine-2D images from two orthogonal planes across the tumor center to help determine the 3D motion trajectories of the tumor (11,12). However, this approach may not fully characterize the 3D motion of the entire tumor, making it difficult to accurately calculate the ITV for irregularly-shaped or deformable tumors. In addition, healthy vulnerable tissues surrounding the tumor may not be fully defined. Therefore, 4D-MRI, or phase/time-resolved 3D-MRI, is more suitable. Various 4D-MRI techniques have been proposed in the past, which can be generally categorized into two classes: 1) real-time volumetric acquisitions using fast 3D sequences (13–15) and 2) retrospective data sorting using concurrently recorded internal or external respiratory motion surrogates (16–21). The real-time 3D techniques are limited by the achievable spatiotemporal resolution, which may cause blurring of the fine or fast-moving structures. In contrast, the sorting-based techniques alleviate this constraint by combining data that belong to the same respiratory phase yet acquired at different time points, hence resulting in a series of respiratory phase-resolved 3D images. Most of the techniques in the second class are based on multiple 2D acquisitions with prospective (17,18) or retrospective (16,19–21) respiratory gating followed by slice sorting. These 2D approaches have relatively low slice resolution of 5–10 mm, which may limit the accurate depiction of respiratory motion in the through-slice direction. More importantly, irregular breathing, commonly seen in patients (22), could potentially elicit unpredictable and prohibitively long scan times for the prospectively gated techniques and induce severe resorting artifacts, as in 4D-CT, for the retrospectively gated techniques. Recently, Buerger et al proposed to overcome these limitations by using a 3D acquisition with golden angle ordering in the phase-partition (ky–kz) plane followed by k-space sorting (23,24). The so called golden-radial phase encoding technique achieves high isotropic spatial resolution and offers improved robustness to irregular breathing by retrospective data sorting in k-space. This technique, however, is inherently limited in the respiratory motion-sampling rate (~250 ms), which could potentially result in errors in the respiratory curve during deep or fast breathing and hence large intra-phase motion variability. A higher motion-sampling rate would require either a smaller matrix size (sacrificing spatial resolution) or greater k-space undersampling in the ky–kz plane.
In this work, we propose an alternative k-space sorting 4D-MRI technique based on a continuous 3D radial-sampling acquisition with 2D golden means ordering and self-gating (SG) motion surrogate. The acquisition scheme enables arbitrary retrospective data sorting, frequent respiratory motion sampling, and is robust to k-space undersampling. It allows retrospective exclusion of the undesired respiratory outlier data and reconstruction of a respiratory phase-resolved 3D image series with isotropic high spatial resolution and an arbitrary number of temporal phases (ten in our case). The resultant image series permits the characterization of an average breathing motion pattern, which potentially allows accurate determination of the ITV. The feasibility of using the technique to derive phase-resolved respiratory motion was demonstrated on a motion phantom and the livers of eight healthy volunteers and two patients.
METHODS
Sequence Design
A spoiled gradient recalled echo (GRE) sequence with 3D radial-sampling k-space trajectory and one-dimensional (1D) projection-based SG was implemented at 3T for image acquisition (25). In an attempt to preserve the sampling pattern stability required for arbitrary retrospective data sorting, the 3D radial k-space is filled using the 2D golden means ordering (26), a generalization of the original golden-angle ordering for 2D radial imaging (27). The polar and azimuthal angles are calculated using the following equations:
where φ1 = 0.4656 and φ2 =0.6823 are the 2D golden means, θ is the polar angle, ϕ is the azimuthal angle, and m is the radial line index.
To detect respiratory motion, a group of two superior-inferior (SI) readout lines are inserted at every 15 imaging lines or an interval of approximately 98 ms (TR = 5.8 ms). During acquisition, the large k-space jumps from imaging lines to SG lines causes apparent eddy-current artifacts (Fig. 1), which may reduce the robustness of motion estimation. To mitigate this effect, two consecutive SG lines are acquired and only the second SG line is used for respiratory motion monitoring (28).
Figure 1.

The sample Self-Gating (SG) projection profile time series for the first (a) and second (b) SG line. The effect of eddy current is apparent in the first SG series (a) (shown as the superimposed high frequency signal variation), which may reduce the robustness of motion estimation. This artifact is greatly suppressed in the second SG series (b).
Similar to 4D-CT, the proposed technique aims to construct ten respiratory phases. To achieve this within a reasonable scan time, a total of 73,005 imaging lines are acquired in 8 mins, as illustrated in Fig. 2. The choice of a fixed scan time, 8 min, is based on (a) our preliminary testing on volunteers showing that usually approximately 5–15% data belong to irregular respiratory cycles and (b) our previous experience on self-calibrating sensitivity encoding (SENSE) reconstruction of coronary arteries showing that an approximately 8-fold acceleration (based on the Nyquist rate , where N being the number of readout points and Nfull being the total number of lines) is feasible for a ~1.0-mm spatial resolution (29). Thus, we anticipated that approximately 6000–7000 lines, after rejection of motion-corrupted data, would be available in each of the ten respiratory phases and reasonably adequate for reconstructing images with a lower spatial resolution (i.e. 1.56 mm).
Figure 2.
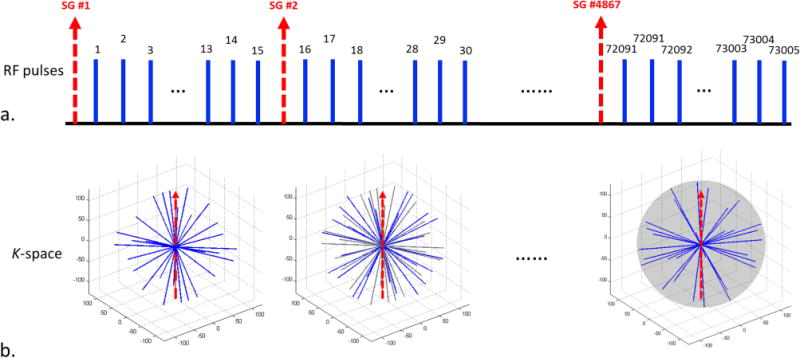
The proposed spoiled gradient recalled echo (GRE) sequence with 3DPR trajectory, 2D golden means ordering and one-dimensional (1D) self-gating (SG). (a) 4D-MRI imaging sequence showing each SG k-space group (dashed arrow) inserted in the superior-inferior (SI) direction at every segment of 15 radial projections, giving a temporal interval of ~98 ms between each SG group. A total of 73,005 projections were collected with 4867 SG lines after an approximately 8 minute scan. (b) 3D k-space trajectory showing data collection via radial 2D golden means ordering corresponding to (a). Note that the radial lines collected in previous segments are grayed and the SG lines are represented via dashed arrows.
Image Reconstruction
Extraction of the respiratory signal
Each SG line serves as a motion stamp for a segment of 15 imaging lines that follow. The Fourier Transform of the SG lines, essentially a projection of the imaging volume onto the SI axis, is sensitive to the respiratory organ motion in the SI direction (30,31). In order to automatically extract the respiratory curve, a principal component analysis (PCA) is performed on the multi-channel projection profile time series, and the appropriate component is identified based on its major Fourier mode that matched the typical respiratory (0.1–0.5 Hz) range (32). This process results in a motion signal (i.e. the respiratory curve) that is correlated to the SI translation from conventional template matching (29,33), as detailed in Pang et al (25). In this study, each time point on the derived respiratory curve provides an index for the SI position of each imaging line segment.
Data sorting
The k-space segments are retrospectively sorted into its respective respiratory phases based on their relative temporal locations within a respiratory cycle, as illustrated in Fig. 3. To this end, the respiratory curve (i.e. SI-position-index vs. time) first undergoes band-pass filtering (0.125–0.5 Hz) and peak (corresponding to end-expiration) detection. The respiratory cycles with abnormal durations or outlier end-expiratory locations (i.e. outside ± 2 standard deviations from the mean duration or end-expiratory location) are discarded. Then, each remaining cycle is evenly divided into ten temporal respiratory phases, where each segment is assigned a nominal respiratory phase-index between 1 and 10. To reduce the intra-phase position variability, a more stringent position-index range, i.e. mean ± standard deviation, was defined for each phase. All segments are then re-inspected for their position-index to determine its appropriate respiratory phase. The segment with its position-index falling out of the defined range will be re-assigned to a neighboring phase if the new range qualifies, or will otherwise be discarded. All thresholds for data sorting were kept constant for all subjects.
Figure 3.
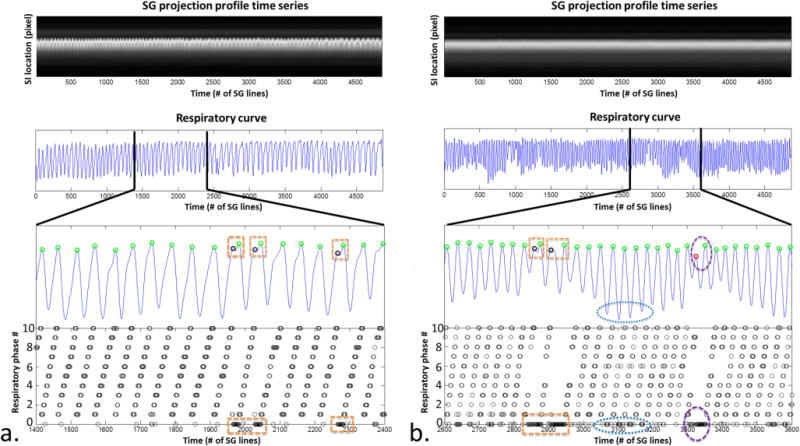
Retrospective respiratory phase sorting in k-space demonstrated in a healthy volunteer (a) and a patient (b). The superior-inferior (SI) respiratory motion displacements represented in the respiratory curve were extracted via a principle component analysis (PCA) based method and served as a surrogate for respiratory phase throughout the acquisition (position index vs. time). Each peak (circle), representing end-expiration, was identified. Projection group outliers such as those involved in the respiratory cycles with abnormal time period (rectangle) and inconsistent expiratory amplitude (vertical oval) or those with large respiratory phase drift (horizontal oval) were discarded while only valid projection groups were assigned to respiratory phases between 1 and 10, shown as the black circles on the bottom graph. As shown here, the healthy volunteer showed a relatively stable breathing pattern, while the patient showed occasional irregularities.
Image reconstruction
After data sorting, each respiratory phase is reconstructed individually using a conjugate-gradient (CG) SENSE method with self-sensitivity calibration. The details of the CG SENSE reconstruction can be found in Pang et al (29). Specifically, the reconstruction algorithm used 15 CG iterations along with Tinkonov (L2) regularization with a weight of 1e-10 to further reduce noise and residual streaking. Image reconstruction was implemented offline using MATLAB (Mathworks, Natick, MA) with parallel computing toolbox on a workstation with a 12-core Intel Xeon CPU and 96 GB of memory. All parameters for image reconstruction were kept constant for all subjects.
Experiments
The feasibility of the technique was demonstrated with motion phantom studies and in-vivo liver imaging studies. All scans were performed on a clinical 3T MRI system (MAGNETOM Verio, Siemens Healthcare, Erlangen, Germany) equipped with a 32-channel receiver coil (Invivo, Gainesville, Florida, USA).
Study design
Schematics of the motion phantom are shown in Fig. 4a. A commercial Dynamic Breathing Phantom (RSD™, Long Beach, CA, USA) system placed outside the scanner room was used to produce simulation signals that mimic the human respiratory motion. Through an air pump and tube, the signals were used to drive a plastic box (35×40×63 mm3) fully filled with gadolinium-doped water and sealed with silicone sealant. Five PinPoint® fiducial markers (Beekley Medical™, Bristol, CT, USA) were placed on each face of the box. The box was then used as an imaging target, where reciprocating motion was executed along the z-axis of the magnet at a frequency of 18 cycles/min.
Figure 4.
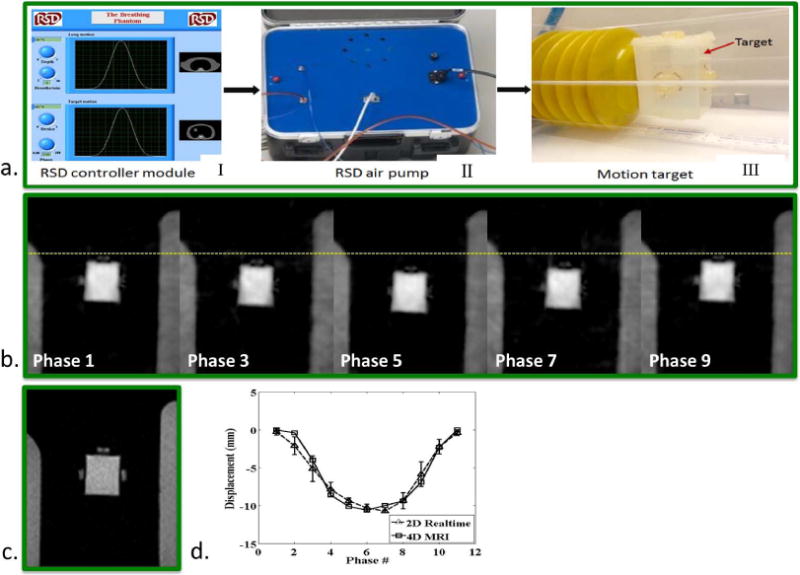
Phantom study. a) A commercial Dynamic Breathing Phantom system placed outside the MR scanner room (I) was used to produce simulation signals mimicking human respiratory motion. Through an air pump (II) and tube, the signals were used to drive a box filled by gadolinium-doped water, which served as an imaging target (III). During the scan, the box executed reciprocating motion along the z-axis of the magnet at a frequency of 18 cycles/min, giving a set of phase resolved images (phase 1, 3, …, 9) reformatted from 4D-MRI, where the dashed line is drawn for a better visualization of the target motion at each respiratory phase (b). (c) A single frame of the real-time 2D-MRI image series. d) Measured SI displacement series, comparing between 4D-MRI and real-time 2D-MRI at each respiratory phase.
Human studies were approved by our institutional review board and written consent was obtained prior to imaging. Eight healthy volunteers (four females, 23 – 48 years) and two clinical patients were recruited. Patient A (male, 77 years) diagnosed with hepatocellular carcinoma had a single lesion at the dome of the liver without evidence of additional metastatic lesions. A gold fiducial marker was placed next to the tumor for better visualization of respiratory motion in the 4D-CT images. The lesion had been treated with stereotactic body radiotherapy with a dose of 50 Gy in 5 fractions delivered every other day prior to the MRI study. Patient B (female, 85 years) had localized intrahepatic cholangiocarcinoma and was treated with concurrent gemcitabine-based chemoradiation therapy with a total radiation dose of 54 Gy in 30 fractions before the MRI study. All subjects were scanned under free breathing in a head-first supine position.
The imaging protocol consisted of a continuous 8-min 4D-MRI scan using the proposed method and two 1-min single-slice real-time 2D-MRI scans (sagittal and coronal) using a conventional 2D Cartesian spoiled GRE sequence. Real-time 2D-MRI was used to derive the displacements of the imaging target in three orthogonal directions that served as a reference to evaluate the accuracy of the measurements from 4D-MRI. The isotropic imaging volume of 4D-MRI was centered on the moving phantom box or the liver. The imaging parameters for 4D-MRI were as follows: FOV = (300 mm)3; prescribed spatial resolution = (1.56 mm)3; flip angle = 10°; TR/TE = 5.8/2.6 ms; readout bandwidth = 399 Hz/pixel; nonselective 1-2-1 water excitation RF pulse with a duration of 400μs to suppress the bright fat signal (34). The temporal footprint for each respiratory phase varies according to the subject’s average breathing cycle duration, ranging from 300 to 500 ms. Real-time 2D-MRI was performed with a slice that traversed the imaging target (i.e. phantom; healthy: liver; patient: A. fiducial or B. tumor) at a rate of 488 ms per frame for one minute. In-plane spatial resolution was matched to that of 4D-MRI, whereas slice thickness was 3 mm. All other parameters were also matched between 2D and 4D scans except that 2D scans used conventional fat saturation and dark blood (double-inversion) pre-pulses, and a TR/TE of 4.0/1.64 ms. The dark blood pre-pulse was used to avoid image artifacts arising from the inconsistent blood inflow in the 2D imaging plane. Fat suppression applied in both 2D-MRI and 4D-MRI was used to avoid obscuring of imaging targets by the high T1-weighted signals from fat.
Data Analysis
All images were loaded to a standard clinical workstation (Leonardo, Siemens Healthcare, Germany). From the two real-time 2D-MRI scans, the one that showed better delineation of the imaging target was chosen for analyses. From the 4D-MRI scan, a slice with location and thickness matched with 2D imaging was reconstructed from each of phase-resolved 3D image sets. The imaging target refers to the following locations: one of the fiducial markers attached to the moving phantom box, the dome of the right hemi-diaphragm for the healthy volunteers, the gold fiducial in patient A, and the tumor in patient B.
Two-fold analyses were performed to evaluate the accuracy of the 4D-MRI derived motion displacements: 1) comparison of phase-resolved SI displacements between real-time 2D-MRI and 4D-MRI on the phantom, healthy volunteers, and patients; 2) comparison of phase-resolved displacement in SI, anterior-posterior (AP) and left-right (LR) directions between the two imaging scans on the two patients.
Phase-resolved motion displacements were directly measured for 4D-MRI. However, additional processing was required for real-time 2D-MRI that yielded time-resolved rather than phase-resolved displacements over multiple respiratory cycles. Specifically, the displacement time-series was first segmented into individual peak-to-peak respiratory cycles, each of which was then resampled to 11 time points, corresponding to 10 respiratory phases, as in 4D-MRI, and the first respiratory phase (starting peak) of the following respiratory cycle. By averaging the displacements from the same phase over all respiratory cycles, the 2D-MRI displacement at each respiratory phase was determined.
The 10 measured displacements obtained from the two imaging techniques were compared in regard to the motion amplitude, displacement difference (2D-MRI minus 4D-MRI) and absolute displacement difference averaged over 10 phases, as well as cross-correlation between phase-resolved displacements. The 3D motion trajectories for the two patients were also plotted to visualize respiratory hysteresis (35,36).
Further, image sharpness was measured on all subjects for both 4D-MRI and real-time 2D-MRI to allow a quantitative evaluation of image quality. Specifically, on end-expiration images, the sharpness was measured and averaged over three locations across the lung-liver interface using the method proposed in Li et al (37) with an in-house MATLAB program.
In all tests, statistical significance was defined at the p < 0.05 level. The paired Student’s t-test was used to determine any difference and intraclass correlation coefficient (ICC) and cross-correlation were used to assess any agreement in measurements between the two techniques.
RESULTS
The SI motion of the imaging targets was well appreciated on the SG-derived respiratory curves. As expected, the motion phantom showed a strictly sinusoidal respiratory pattern and the human subjects, as illustrated in Fig. 3a (a healthy subject) and Fig. 3b (a patient), showed variations in breathing amplitude and frequency, with the patient showing more irregularity than the healthy volunteer. The proposed retrospective data sorting strategy detected the breathing cycles with abnormal respiratory durations (rectangles on the zoom-in respiratory curve in Fig. 3) or expiratory peaks (vertical ovals) and also identified the outlier with large respiratory phase drift (horizontal oval). As a result, 5–16% of the total k-space data were discarded, with approximately 6000–7000 imaging lines available in each respiratory phase for image reconstruction.
The proposed method offered respiratory phase-resolved volumetric coverage with a high isotropic spatial resolution, which allowed image reformatting for the visualization of respiratory organ motion at arbitrary location and orientation. Selected respiratory phases (1, 3, 5… 9) of the motion phantom, a healthy volunteer and two patients in the coronal and sagittal orientations are shown in Figs 4b, 5a, 6a, and 8a, respectively. Compared with real-time 2D-MRI images (Fig. 4c, 5b, 6b, and 8b), 4D-MRI images provided comparable visualization of the respiratory motion. No severe motion-induced image blurring was observed in each of the multiple phases, suggesting negligible intra-phase motion. The motion of the small fiducial or tumor in patients was clearly depicted in the 4D-MRI images as shown in Fig. 6a and 8a, respectively. Compared with 2D real-time images, however, phase-resolved 3D images exhibited reduced overall image quality (e.g. signal inhomogeneity) and difference in tissue contrast. The reduction in image quality could be attributed to several factors related to the 3D acquisitions such as aggressive undersampling in some irregular-breathing subjects, large k-space jump-induced eddy-current effects, and suboptimal B0 shimming-induced off-resonance effects. As a quantitative measure of image quality, sharpness were measured in both real-time 2D-MRI and 4D-MRI and showed comparable results among all subjects (0.341±0.089 mm−1 vs. 0.359±0.064 mm−1, p = 0.492). On one hand, the regularized non-Cartesian SENSE reconstruction from undersampled data inevitably results in a certain degree of image smoothing (38), therefore, the reconstructed spatial resolution was likely lower than the prescribed one. On the other hand, relatively low temporal resolution (488 ms) and low signal-to-noise ratio may affect the image sharpness in the real-time 2D-MRI images. In this work, these factors appear to have been of comparable importance, leading to comparable sharpness values between the two techniques. Further analysis can be found in Supporting Materials. The variation in tissue contrast could be due to the differences in the two data acquisition methods as mentioned in the above section. In 2D-MRI images, the blood in the arteries and veins were well suppressed by the dark blood pre-pulses, whereas in 4D-MRI images, the blood appeared gray since data were acquired during a steady state. In addition, water excitation pulses may resulted in different fat suppression performances in 4D-MRI images than the conventional fat saturation pulses used in 2D-MRI.
Figure 5.
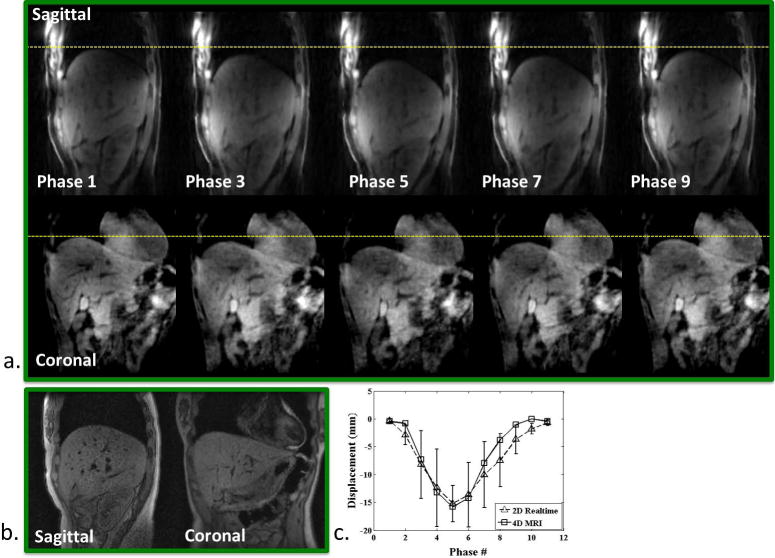
Healthy volunteer. a) Phase-resolved sagittal and coronal images (phase 1, 3, …, 9) reformatted from the 4D MRI image series throughout the entire respiratory cycle. Dashed lines are drawn for better visualization of organ motion at each respiratory phase. b) A single frame of the corresponding real-time 2D-MRI image series. c) Measured SI displacement series, comparing between 4D-MRI and real-time 2D-MRI at each respiratory phase.
Figure 6.
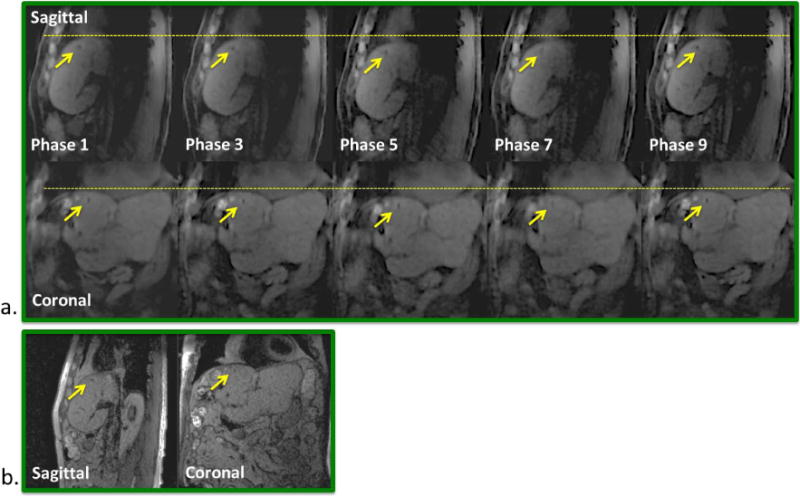
Patient A. a) Phase-resolved sagittal and coronal images (phase 1, 3, …, 9) reformatted from the 4D MRI image series showing well delineated gold fiducial (arrows) throughout the entire respiratory cycle. Dashed lines are drawn for better visualization of organ motion at each respiratory phase. b) A single frame of the corresponding real-time 2D-MRI image series.
Figure 8.
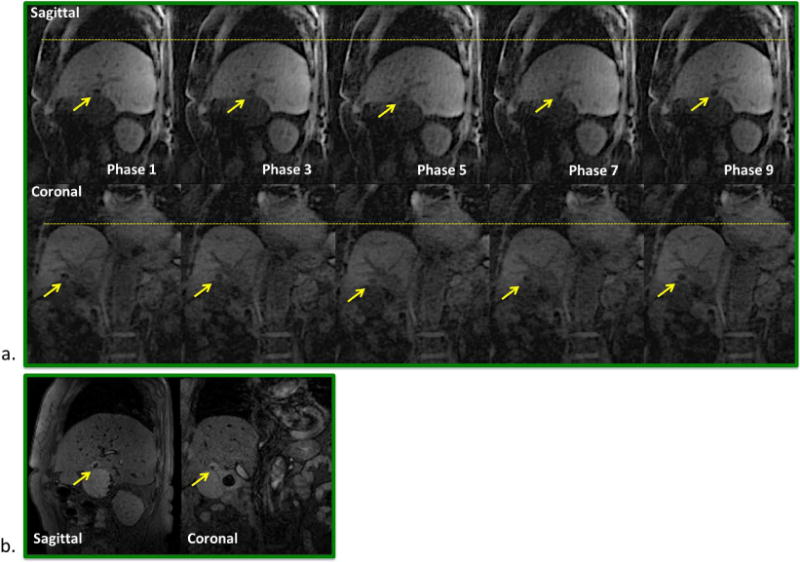
Patient B. a) Phase-resolved sagittal and coronal images (phase 1, 3, …, 9) reformatted from the 4D MRI image series, showing well delineated tumor (arrows) throughout the entire respiratory cycle. Dashed lines are drawn for better visualization of organ motion at each respiratory phase. b) A single frame of the corresponding real-time 2D-MRI image series.
The phase-resolved SI displacements were compared between 4D-MRI and 2D-MRI. As summarized in Table 1, good agreement was observed. For SI motion amplitude, results in the phantom was 1.4% (0.15 mm) less in 2D-MRI, presumably due to a lower temporal resolution in the 2D-MRI scan that might not have fully captured the true respiratory amplitude. In human subjects, however, the difference in amplitude between the two scans ranged from −11% to +16% (−2.23 to +2.06 mm), potentially due to slight breathing pattern variations between 2D and 4D acquisitions. Overall, the SI motion amplitudes between 2D- and 4D-MRI were in a good agreement based on the intra-class correlation coefficient (ICC = 0.935; P < 0.001). When observing the displacement differences over all ten respiratory phases, the mean displacement difference was −0.12 mm in the phantom and ranged from −1.81 – 0.53 mm in humans. The mean absolute displacement difference was 0.64 mm and 0.58–1.81 mm for phantom and humans, respectively. Excellent cross-correlation between the displacements series from the 4D and 2D-MRI was observed in all studies, i.e. 0.985 for the phantom and an average of 0.964 for healthy volunteers and 0.938 for patients. The derived SI displacement series were visually comparable between the two scans, as shown in Figs. 4d, 5c, 7a and 9a. The SI displacements measured from 4D-MRI images at each respiratory phase matched well with those from real-time 2D-MRI images, where the 4D-MRI displacements mostly fell within a range of ±1 standard deviation and all fell within a range of ±2 standard deviation of the phase-matched displacements across all cycles captured by the 1-min 2D-MRI scan.
Table 1.
Summary of SI motion characterization in healthy volunteer and patient studies comparing 4D-MRI and real-time 2D-MRI.
| Mean Displacement Difference (mm) |
Mean Absolute Displacement Difference (mm) |
Cross-correlation Coefficient (CC) |
||
|---|---|---|---|---|
| Volunteer | 1 | −0.566 | 1.038 | 0.968 |
| 2 | −0.973 | 1.409 | 0.974 | |
| 3 | 0.004 | 1.381 | 0.971 | |
| 4 | 0.530 | 0.748 | 0.962 | |
| 5 | −1.814 | 1.814 | 0.944 | |
| 6 | −0.298 | 0.676 | 0.985 | |
| 7 | 0.156 | 0.581 | 0.937 | |
| 8 | −0.680 | 1.035 | 0.968 | |
|
| ||||
| Patient | A | −0.760 | 1.156 | 0.938 |
| B | −0.226 | 0.829 | 0.938 | |
|
| ||||
| Mean ± SD | −0.463±0.66 | 1.067±0.39 | 0.959±0.02 | |
Figure 7.
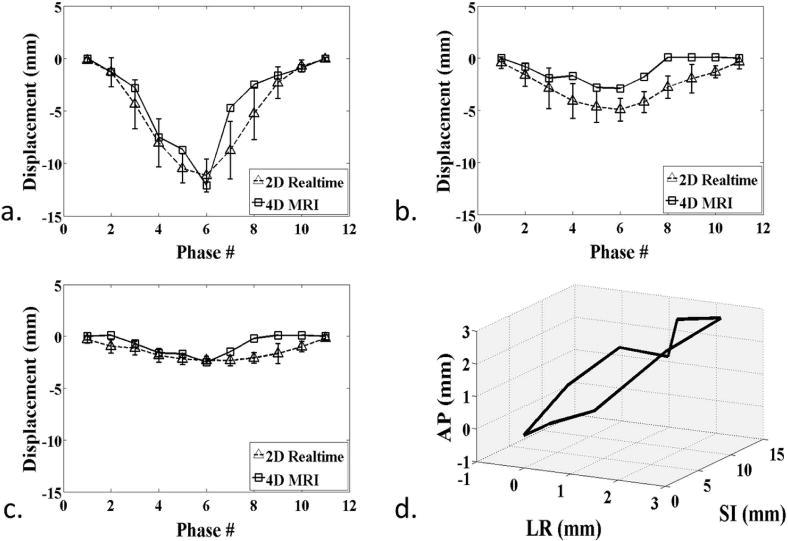
Patient A. a–c) Measured displacement series, comparing between 4D-MRI and real-time 2D-MRI at each respiratory phase for SI (a), AP (b), and LR (c) directions. d) 3D visualization of the fiducial trajectories over ten respiratory phases, showing the hysteresis effect.
Figure 9.
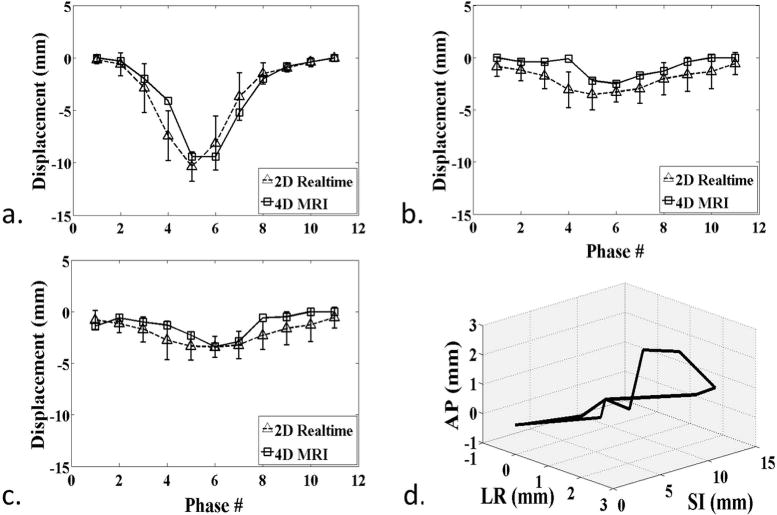
Patient B. a–c) Measured displacement series, comparing between 4D-MRI and real-time 2D-MRI at each respiratory phase for SI (a), AP (b), and LR (c) directions. d) 3D visualization of the tumor trajectories over ten respiratory phases, showing the hysteresis effect.
The phase-resolved AP and LR displacements in patient A and patient B were also compared between 4D-MRI and 2D-MRI. AP and LR displacements were relatively small compare to SI displacements as expected. The mean displacement difference between 4D and 2D-MRI over all ten respiratory phases were −1.59 (AP) and −0.74 mm (LR) for patient A and −1.20/−0.74 mm for patient B. Good cross-correlation between the displacements series from the 4D and 2D-MRI was observed, with 0.867 (AP) and 0.724 (LR) for patient A and 0.785 and 0.815 for patient B. The derived AP/LR displacement series were visually comparable between the two scans as represented in Figs. 7b/c (Patient A) and 9b/c (Patient B).
In addition, the hysteresis effects for both patients are illustrated in Figs. 7d (patient A) and 9d (patient B). The 3D trajectories clearly revealed the different paths of inspiration and expiration for the structure of interest.
DISCUSSION
4D imaging is of interest to the radiation therapy community aiming at focusing a high radiation dose to moving tumors while sparing surrounding normal tissues. Phase-resolved target definition and motion management in three dimensions can be derived from 4D imaging, allowing determination of the ITV in clinical practice. 4D imaging also facilitates better appreciation of the spatial relation between tumors and surrounding tissues at each respiratory phase. This would impact future clinical practice by allowing more optimal treatment margins for individual respiratory phases or selection of the best phases for minimal radiation dose delivery to normal tissues (8,39). 4D-MRI is recently gaining more interests due to its excellent soft-tissue contrast and the lack of ionizing radiation as opposed to 4D-CT. However, due to various technical limitations of the existing techniques as mentioned previously, 4D-MRI has not been widely adopted in radiotherapy treatment planning.
In this work, we proposed a novel self-gated 4D-MRI technique to potentially overcome those limitations and make 4D-MRI more amenable to translate into a clinical setting. Our initial experience from motion phantom and in-vivo liver imaging studies suggested that accurate respiratory motion characterization can be achieved through the respiratory phase-resolved 3D image series obtained from the proposed technique.
The 3D radial acquisition offered a high isotropic spatial resolution for visualizing fine anatomic features, such as liver fiducials, from arbitrary perspectives (Fig. 6a). Furthermore, the 2D golden means k-space ordering offered quasi-uniform k-space sampling for each respiratory phase as well as flexible k-space data sorting and rejection, which is crucial for consistent image quality throughout all respiratory phases. A related strategy has recently been proposed for respiratory phase-resolved liver imaging using a radial-like phase and partition encoding ordering (23). However, our approach allows for a higher and more flexible SG motion-sampling rate throughout the acquisition that could potentially translate to more precise motion estimation. Our studies have demonstrated the feasibility of sampling respiratory motion at approximately every 98 ms, yet higher sampling rates are readily achievable with a slight penalty in scan time.
The detection of respiratory motion via SG, unlike the external (e.g. pneumatic devices) or internal (e.g. respiratory navigator) motion surrogates used in existing 4D-MRI methods (16–21), originates directly from the imaging volume and, in theory, may yield a more accurate motion estimate of the imaging target (31). By using the same excitation RF pulse and imaging parameters, the SG readouts are equivalent to the imaging readouts and, unlike respiratory navigators (40), do not disrupt the magnetization steady-state. Moreover, SG also eliminates the dark saturation bands usually seen on the liver from the respiratory navigator, which can be undesirable when the liver is the organ of interest. The regular and irregular breathing patterns in human subjects were clearly revealed by both the SG projection series and the SG-derived respiratory curves (Fig. 3). The effectiveness of SG was also corroborated by the excellent agreement between the respiratory displacements derived from 4D-MRI images and those derived from real-time 2D-MRI in all of our studies.
It is also noteworthy that the proposed technique utilized k-space sorting in a temporally binned fashion. For previous slice sorting-based techniques, irregular breathing episodes during scanning presented adverse effects on the scan duration (17,18) and resulting image quality (16,19–21). The retrospective k-space sorting-based technique allows for the exclusion of irregular breathing cycles after scanning and facilitates the reconstruction of an averaged phase-resolved volumetric image series that is robust against irregular breathing patterns and maintains image quality. Meanwhile, the combination of 3D radial-sampling and CG-SENSE image reconstruction makes the k-space sorting approach more tolerable to high undersampling factors, which in turn helps maintain consistent image quality throughout all respiratory phases and subjects. Furthermore, the temporal binning strategy, achieved by using a high motion-sampling rate, allows for a uniformly distributed k-space throughout all respiratory phases. An additional advantage with temporal binning rather than SI position binning is the detection of hysteresis within the breathing cycle. Our studies have demonstrated the 3D visualization of the hysteresis trajectories in patients. This suggests a future research opportunity to use the new technique to systematically investigate the influence of this effect on radiotherapy planning.
The performance of the proposed method can be further improved. The current imaging parameters may not be optimal for all subjects. For example, a fixed scan time of 8 min was prescribed in all studies, additional imaging lines would be better for subjects with highly irregular breathing patterns at the expense of longer scan times. The current image reconstruction strategy required approximately 73,005 projections for adequate image quality, and each respiratory phase was reconstructed independently. Further acceleration may be achieved through exploiting the spatiotemporal correlation in the multi-channel dataset (41–46), which may help improve image quality (e.g. extreme respiratory irregularity cases where more data need to be discarded during data sorting), temporal resolution or reduce the total scan time. For image acquisition large gradient jumps in k-space may cause eddy-current effects that could potentially degrade image quality (47). Further developments in smoother k-space trajectories to minimize these effects are desirable. In addition, the off-resonance due to B0 inhomogeneity was perhaps one of factors accounting for image artifacts as the volumetric acquisition required a much larger shimming volume than the 2D protocol, which may degrade the shimming quality. Careful B0 shimming is required and targeted excitation volume may help alleviate these artifacts by suppressing the signal from anatomic structures far away from the isocenter. Furthermore, the proposed pulse sequence used a spoiled GRE readout that offered primarily T1-weighted image contrast. T2-weighting, however, is more suited for tumor delineation (17). Means to include T2-weighting to the image contrast, such as balanced steady-state free precession acquisition (48–50) or T2-preparation techniques, will be further investigated.
Moreover, the clinical significance of this study can also be improved by recruiting more patients. Currently, only two patients participated in human studies. Study of a broader patient population may present more challenges to 4D-MRI such as the subject’s breathing irregularity and inability to stay still for an extended scan time. A larger-scale clinical study is therefore needed to systematically evaluate the accuracy and robustness of the proposed technique. In addition, given that 4D-CT is the current method of choice in clinical radiotherapy planning, comparison of the new 4D-MRI technique with 4D-CT in a clinical setting is necessary in the future.
CONCLUSION
A self-gated 4D-MRI technique has been developed for the characterization of respiratory motion in abdominal organs. Our preliminary studies demonstrated its feasibility in providing respiratory phase-resolved 3D images with several advantages over existing 4D-MRI methods. This approach has the potential to become a viable alternative solution for the assessment of the impact of breathing on tumor and normal tissue motion, thus help improve the precision of radiotherapy treatment planning.
Supplementary Material
Supporting Figure S1. The effect of the number of projections on 4D-MRI image quality. a) 2D real-time image during end-expiration vs. the matched respiratory phase and slice location from the 4D image series, reconstructed using CG-SENSE from 9200, 5000, and 2500 projections, respectively. The data was retrospectively extracted from a single 12 min scan (a total of 120,000 projections). b) Image sharpness of different images, measured at various locations on the lung-liver interface, as indicated by the yellow vertical lines in (a). c) Apparent signal-to-noise ratio (aSNR) of different lambdas, measured at various locations on the liver as indicated by the circles in (a). With fewer projections, both sharpness and aSNR gradually reduced as can be appreciated both visually and from the measured values.
Supporting Figure S2. The effect of L2 regularization weight (λ) on 4D-MRI image sharpness. a) 2D real-time image during end-expiration vs. the matched respiratory phase and slice location from the 4D image series, reconstructed with 5000 projections using CG-SENSE and different values of λ. b) Mean image sharpness averaged from various locations on the lung-liver interface, as indicated by the yellow vertical lines in (a). c) Apparent signal-to-noise ratio (aSNR) values, measured at various locations on the liver as indicated by the circles in (a). As λ decreased, sharpness increased and the aSNR decreased, as can be seen both visually and from the numerical comparisons.
Supporting Table S1. 2D Real-Time vs. 4D-MRI sharpness measurements of all subjects.
Acknowledgments
This work was funded in part by NCI grant 1R03CA173273-01.
References
- 1.Guckenberger M, Richter A, Boda-Heggemann J, Lohr F. Motion Compensation in Radiotherapy. CRB. 2012;40:187–197. doi: 10.1615/CritRevBiomedEng.v40.i3.30. [DOI] [PubMed] [Google Scholar]
- 2.Lambert J, Suchowerska N, McKenzie DR, Jackson M. Intrafractional motion during proton beam scanning. Phys Med Biol. 2005;50:4853–4862. doi: 10.1088/0031-9155/50/20/008. [DOI] [PubMed] [Google Scholar]
- 3.Radiation Therapy for Liver Tumors. (2) 2003:1–10. [Google Scholar]
- 4.Berthelsen AK. What’s new in target volume definition for radiologists in ICRU Report 71? How can the ICRU volume definitions be integrated in clinical practice? Cancer Imaging. 2007;7:104–116. doi: 10.1102/1470-7330.2007.0013. [DOI] [PMC free article] [PubMed] [Google Scholar]
- 5.Keall P. 4-dimensional computed tomography imaging and treatment planning. Seminars in Radiation Oncology. 2004;14:81–90. doi: 10.1053/j.semradonc.2003.10.006. [DOI] [PubMed] [Google Scholar]
- 6.Keall PJ, Joshi S, Vedam SS, Siebers JV, Kini VR, Mohan R. Four-dimensional radiotherapy planning for DMLC-based respiratory motion tracking. Medical Physics. 2005;32:942–951. doi: 10.1118/1.1879152. [DOI] [PubMed] [Google Scholar]
- 7.Low DA, Nystrom M, Kalinin E, et al. A method for the reconstruction of four-dimensional synchronized CT scans acquired during free breathing. Medical Physics. 2003;30:1254–1263. doi: 10.1118/1.1576230. [DOI] [PubMed] [Google Scholar]
- 8.Rietzel E, Chen GTY, Choi NC, Willet CG. Four-dimensional image-based treatment planning: Target volume segmentation and dose calculation in the presence of respiratory motion. International Journal of Radiation Oncology*Biology*Physics. 2005;61:1535–1550. doi: 10.1016/j.ijrobp.2004.11.037. [DOI] [PubMed] [Google Scholar]
- 9.Vedam SS, Keall PJ, Kini VR, Mostafavi H, Shukla HP, Mohan R. Acquiring a four-dimensional computed tomography dataset using an external respiratory signal. Phys Med Biol. 2003;48:45. doi: 10.1088/0031-9155/48/1/304. [DOI] [PubMed] [Google Scholar]
- 10.Watkins WT, Li R, Lewis J, Park JC, Sandhu A. Patient-specific motion artifacts in 4DCT. Medical. 2010 doi: 10.1118/1.3432615. [DOI] [PubMed] [Google Scholar]
- 11.Shimizu S, Shirato H, Xo B, Kagei K, Nishioka T, Hashimoto S, Tsuchiya K, Aoyama H, Miyasaka K. Three-dimensional movement of a liver tumor detected by high-speed magnetic resonance imaging. Radiotherapy and Oncology. 1999;50:367–370. doi: 10.1016/s0167-8140(98)00140-6. [DOI] [PubMed] [Google Scholar]
- 12.Akino Y, Oh R-J, Masai N, Shiomi H, Inoue T. Evaluation of potential internal target volume of liver tumors using cine-MRI. Medical Physics. 2014;41:111704. doi: 10.1118/1.4896821. [DOI] [PubMed] [Google Scholar]
- 13.Blackall JM, Ahmad S, Miquel ME, McClelland JR, Landau DB, Hawkes DJ. MRI-based measurements of respiratory motion variability and assessment of imaging strategies for radiotherapy planning. Phys Med Biol. 2006;51:4147. doi: 10.1088/0031-9155/51/17/003. [DOI] [PubMed] [Google Scholar]
- 14.Dinkel J, Hintze C, Tetzlaff R, Huber PE, Herfarth K, Debus J, Kauczor HU, Thieke C. 4D-MRI analysis of lung tumor motion in patients with hemidiaphragmatic paralysis. Radiotherapy and Oncology. 2009;91:449–454. doi: 10.1016/j.radonc.2009.03.021. [DOI] [PubMed] [Google Scholar]
- 15.Plathow C, Klopp M, Schoebinger M, et al. Monitoring of Lung Motion in Patients With Malignant Pleural Mesothelioma Using Two-Dimensional and Three-Dimensional Dynamic Magnetic Resonance Imaging: Comparison With Spirometry. Investigative Radiology. 2006;41:443–448. doi: 10.1097/01.rli.0000208222.03256.ba. [DOI] [PubMed] [Google Scholar]
- 16.Cai J, Chang Z, Wang Z, Segars WP, Yin F-F. Four-dimensional magnetic resonance imaging (4D-MRI) using image-based respiratory surrogate: A feasibility study. Medical Physics. 2011;38:6384–6394. doi: 10.1118/1.3658737. [DOI] [PMC free article] [PubMed] [Google Scholar]
- 17.Hu Y, Caruthers SD, Low DA, Parikh PJ, Mutic S. Respiratory Amplitude Guided 4-Dimensional Magnetic Resonance Imaging. International Journal of Radiation Oncology*Biology*Physics. 2013;86:198–204. doi: 10.1016/j.ijrobp.2012.12.014. [DOI] [PMC free article] [PubMed] [Google Scholar]
- 18.Tokuda J, Morikawa S, Haque HA, Tsukamoto T, Matsumiya K, Liao H, Masamune K, Dohi T. Adaptive 4D MR imaging using navigator-based respiratory signal for MRI-guided therapy. Magnetic Resonance in Medicine. 2008;59:1051–1061. doi: 10.1002/mrm.21436. [DOI] [PMC free article] [PubMed] [Google Scholar]
- 19.Tryggestad E, Flammang A, Han-Oh S, Hales R, Herman J, McNutt T, Roland T, Shea SM, Wong J. Respiration-based sorting of dynamic MRI to derive representative 4D-MRI for radiotherapy planning. Medical Physics. 2013;40:051909. doi: 10.1118/1.4800808. [DOI] [PubMed] [Google Scholar]
- 20.Siebenthal von M, Székely G, Gamper U, Boesiger P, Lomax A, Cattin P. 4D MR imaging of respiratory organ motion and its variability. Phys Med Biol. 2007;52:1547. doi: 10.1088/0031-9155/52/6/001. [DOI] [PubMed] [Google Scholar]
- 21.Siebenthal von M, Cattin P, Gamper U, Lomax A, Székely G. 4D MR Imaging Using Internal Respiratory Gating. In: Duncan JS, Gerig G, editors. Medical Image Computing and Computer-Assisted Intervention – MICCAI 2005. Springer; Berlin Heidelberg: 2005. pp. 336–343. [DOI] [PubMed] [Google Scholar]
- 22.Yamamoto T, Langner U, Loo BW, Jr, Shen J, Keall PJ. Retrospective Analysis of Artifacts in Four-Dimensional CT Images of 50 Abdominal and Thoracic Radiotherapy Patients. International Journal of Radiation Oncology*Biology*Physics. 2008;72:1250–1258. doi: 10.1016/j.ijrobp.2008.06.1937. [DOI] [PMC free article] [PubMed] [Google Scholar]
- 23.Buerger C, Clough RE, King AP, Schaeffter T, Prieto C. Nonrigid Motion Modeling of the Liver From 3-D Undersampled Self-Gated Golden-Radial Phase Encoded MRI. IEEE Trans Med Imaging. 2012;31:805–815. doi: 10.1109/TMI.2011.2181997. [DOI] [PubMed] [Google Scholar]
- 24.Prieto C, Uribe S, Razavi R, Atkinson D, Schaeffter T. 3D undersampled golden-radial phase encoding for DCE-MRA using inherently regularized iterative SENSE. Magn Reson Med. 2010;64:514–526. doi: 10.1002/mrm.22446. [DOI] [PubMed] [Google Scholar]
- 25.Pang J, Sharif B, Fan Z, Bi X, Arsanjani R, Berman DS, Li D. ECG and navigator-free four-dimensional whole-heart coronary MRA for simultaneous visualization of cardiac anatomy and function. Magn Reson Med. 2014 doi: 10.1002/mrm.25450. n/a–n/a. [DOI] [PMC free article] [PubMed] [Google Scholar]
- 26.Chan RW, Ramsay EA, Cunningham CH, Plewes DB. Temporal stability of adaptive 3D radial MRI using multidimensional golden means. Magnetic Resonance in Medicine. 2009;61:354–363. doi: 10.1002/mrm.21837. [DOI] [PubMed] [Google Scholar]
- 27.Winkelmann S, Schaeffter T, Koehler T, Eggers H, Doessel O. An Optimal Radial Profile Order Based on the Golden Ratio for Time-Resolved MRI. IEEE Trans Med Imaging. 2007;26:68–76. doi: 10.1109/TMI.2006.885337. [DOI] [PubMed] [Google Scholar]
- 28.Bieri O, Markl M, Scheffler K. Analysis and compensation of eddy currents in balanced SSFP. Magnetic Resonance in Medicine. 2005;54:129–137. doi: 10.1002/mrm.20527. [DOI] [PubMed] [Google Scholar]
- 29.Pang J, Sharif B, Arsanjani R, Bi X, Fan Z, Yang Q, Li K, Berman DS, Li D. Accelerated whole-heart coronary MRA using motion-corrected sensitivity encoding with three-dimensional projection reconstruction. Magnetic Resonance in Medicine. 2014 doi: 10.1002/mrm.25097. n/a–n/a. [DOI] [PMC free article] [PubMed] [Google Scholar]
- 30.Stehning C, Börnert P, Nehrke K, Eggers H, Stuber M. Free-breathing whole-heart coronary MRA with 3D radial SSFP and self-navigated image reconstruction. Magnetic Resonance in Medicine. 2005;54:476–480. doi: 10.1002/mrm.20557. [DOI] [PubMed] [Google Scholar]
- 31.Larson AC, White RD, Laub G, McVeigh ER, Li D, Simonetti OP. Self-gated cardiac cine MRI. Magnetic Resonance in Medicine. 2004;51:93–102. doi: 10.1002/mrm.10664. [DOI] [PMC free article] [PubMed] [Google Scholar]
- 32.Odille F, Uribe S, Batchelor PG, Prieto C, Schaeffter T, Atkinson D. Model-based reconstruction for cardiac cine MRI without ECG or breath holding. Magnetic Resonance in Medicine. 2010;63:1247–1257. doi: 10.1002/mrm.22312. [DOI] [PubMed] [Google Scholar]
- 33.Pang J, Bhat H, Sharif B, Fan Z, Thomson LEJ, LaBounty T, Friedman JD, Min J, Berman DS, Li D. Whole-heart coronary MRA with 100% respiratory gating efficiency: self-navigated three-dimensional retrospective image-based motion correction (TRIM) Magn Reson Med. 2014;71:67–74. doi: 10.1002/mrm.24628. [DOI] [PMC free article] [PubMed] [Google Scholar]
- 34.Levitt MH. Composite pulses. Progress in Nuclear Magnetic Resonance. 1986;18:61–122. doi: 10.1016/0079-6565(86)80005-X. [DOI] [Google Scholar]
- 35.Seppenwoolde Y, Shirato H, Kitamura K, Shimizu S, van Herk M, Lebesque JV, Miyasaka K. Precise and real-time measurement of 3D tumor motion in lung due to breathing and heartbeat, measured during radiotherapy. International Journal of Radiation Oncology*Biology*Physics. 2002;53:822–834. doi: 10.1016/S0360-3016(02)02803-1. [DOI] [PubMed] [Google Scholar]
- 36.Kitamura K, Shirato H, Seppenwoolde Y, et al. Tumor location, cirrhosis, and surgical history contribute to tumor movement in the liver, as measured during stereotactic irradiation using a real-time tumor-tracking radiotherapy system. Int J Radiat Oncol Biol Phys. 2003;56:221–228. doi: 10.1016/s0360-3016(03)00082-8. [DOI] [PubMed] [Google Scholar]
- 37.Li D, Carr JC, Shea SM, Zheng J, Deshpande VS, Wielopolski PA, Finn JP. Coronary arteries: magnetization-prepared contrast-enhanced three-dimensional volume-targeted breath-hold MR angiography. Radiology. 2001;219:270–277. doi: 10.1148/radiology.219.1.r01ap37270. [DOI] [PubMed] [Google Scholar]
- 38.Pruessmann KP, Weiger M, Börnert P, Boesiger P. Advances in sensitivity encoding with arbitrary k-space trajectories. Magnetic Resonance in Medicine. 2001;46:638–651. doi: 10.1002/mrm.1241. [DOI] [PubMed] [Google Scholar]
- 39.Hof H, Rhein B, Haering P, Kopp-Schneider A, Debus J, Herfarth K. 4D-CT-based target volume definition in stereotactic radiotherapy of lung tumours: Comparison with a conventional technique using individual margins. Radiotherapy and Oncology. 2009;93:419–423. doi: 10.1016/j.radonc.2009.08.040. [DOI] [PubMed] [Google Scholar]
- 40.Carr JC, Simonetti O, Bundy J, Li D, Pereles S, Finn JP. Cine MR Angiography of the Heart with Segmented True Fast Imaging with Steady-State Precession. 2001:1–7. doi: 10.1148/radiology.219.3.r01jn44828. [DOI] [PubMed] [Google Scholar]
- 41.Sharif B, Bresler Y. AFFINE-CORRECTED PARADISE: FREE-BREATHING PATIENT-ADAPTIVE CARDIAC MRI WITH SENSITIVITY ENCODING. IEEE. 2007:1076–1079. doi: 10.1109/ISBI.2007.357042. [DOI] [PMC free article] [PubMed] [Google Scholar]
- 42.Sharif B, Derbyshire JA, Faranesh AZ, Bresler Y. Patient-adaptive reconstruction and acquisition in dynamic imaging with sensitivity encoding (PARADISE) Magnetic Resonance in Medicine. 2010;64:501–513. doi: 10.1002/mrm.22444. [DOI] [PMC free article] [PubMed] [Google Scholar]
- 43.Hansen MS, Baltes C, Tsao J, Kozerke S, Pruessmann KP, Eggers H. k-t BLAST reconstruction from non-Cartesian k-t space sampling. Magnetic Resonance in Medicine. 2006;55:85–91. doi: 10.1002/mrm.20734. [DOI] [PubMed] [Google Scholar]
- 44.Kim D, Dyvorne HA, Otazo R, Feng L, Sodickson DK, Lee VS. Accelerated phase-contrast cine MRI using k-t SPARSE-SENSE. Magnetic Resonance in Medicine. 2012;67:1054–1064. doi: 10.1002/mrm.23088. [DOI] [PMC free article] [PubMed] [Google Scholar]
- 45.Jung H, Sung K, Nayak KS, Kim EY, Ye JC. k-t FOCUSS: A general compressed sensing framework for high resolution dynamic MRI. Magnetic Resonance in Medicine. 2009;61:103–116. doi: 10.1002/mrm.21757. [DOI] [PubMed] [Google Scholar]
- 46.Tsao J, Boesiger P, Pruessmann KP. k-t BLAST and k-t SENSE: Dynamic MRI with high frame rate exploiting spatiotemporal correlations. Magnetic Resonance in Medicine. 2003;50:1031–1042. doi: 10.1002/mrm.10611. [DOI] [PubMed] [Google Scholar]
- 47.A Golden Angle of 68.75o improves gradient spoiling in radial. GRE. 2014:1–1. [Google Scholar]
- 48.Benkert T, Bartsch AJ, Blaimer M, Jakob PM, Breuer FA. Generating multiple contrasts using single-shot radial T 1sensitive and insensitive steady-state imaging. Magnetic Resonance in Medicine. 2014 doi: 10.1002/mrm.25337. n/a–n/a. [DOI] [PubMed] [Google Scholar]
- 49.Derakhshan JJ, Nour SG, Sunshine JL, Griswold MA, Duerk JL. Resolution enhanced T1-insensitive steady-state imaging. Magnetic Resonance in Medicine. 2011;68:421–429. doi: 10.1002/mrm.23290. [DOI] [PMC free article] [PubMed] [Google Scholar]
- 50.Schmitt P, Jakob PM, Kotas M, Flentje M, Haase A, Griswold MA. T-one insensitive steady state imaging: A framework for purely T2-weighted TrueFISP. Magnetic Resonance in Medicine. 2011;68:409–420. doi: 10.1002/mrm.23239. [DOI] [PubMed] [Google Scholar]
Associated Data
This section collects any data citations, data availability statements, or supplementary materials included in this article.
Supplementary Materials
Supporting Figure S1. The effect of the number of projections on 4D-MRI image quality. a) 2D real-time image during end-expiration vs. the matched respiratory phase and slice location from the 4D image series, reconstructed using CG-SENSE from 9200, 5000, and 2500 projections, respectively. The data was retrospectively extracted from a single 12 min scan (a total of 120,000 projections). b) Image sharpness of different images, measured at various locations on the lung-liver interface, as indicated by the yellow vertical lines in (a). c) Apparent signal-to-noise ratio (aSNR) of different lambdas, measured at various locations on the liver as indicated by the circles in (a). With fewer projections, both sharpness and aSNR gradually reduced as can be appreciated both visually and from the measured values.
Supporting Figure S2. The effect of L2 regularization weight (λ) on 4D-MRI image sharpness. a) 2D real-time image during end-expiration vs. the matched respiratory phase and slice location from the 4D image series, reconstructed with 5000 projections using CG-SENSE and different values of λ. b) Mean image sharpness averaged from various locations on the lung-liver interface, as indicated by the yellow vertical lines in (a). c) Apparent signal-to-noise ratio (aSNR) values, measured at various locations on the liver as indicated by the circles in (a). As λ decreased, sharpness increased and the aSNR decreased, as can be seen both visually and from the numerical comparisons.
Supporting Table S1. 2D Real-Time vs. 4D-MRI sharpness measurements of all subjects.


