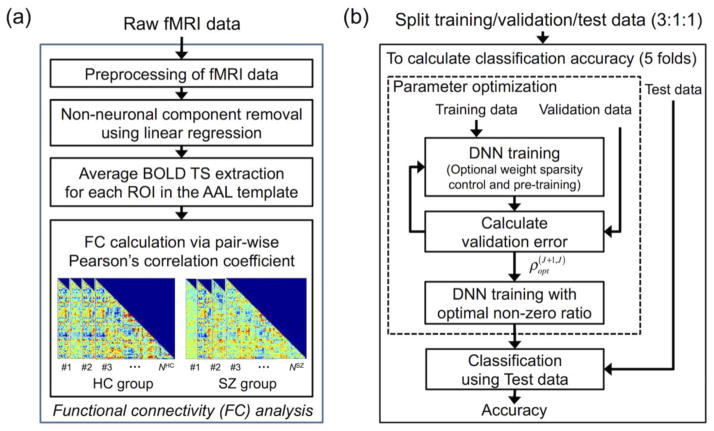
Figure 1.
Overall flow diagram of the functional connectivity (FC) analysis. (a) Raw functional magnetic resonance imaging (fMRI) data were preprocessed, and the input patterns (i.e., whole-brain FC patterns) were extracted. (b) The FC patterns were used as input for the deep neural network (DNN) classifier. In the nested cross-validation scheme, the DNN classifier was trained by using the training (three out of five folds) and validation (one fold) data for parameter optimization employing optional sparsity control of weights and stacked autoencoder (SAE)-based pre-training. The trained DNN classifier was used to estimate classification accuracy using the test data in the remaining fold. BOLD, blood-oxygenation-level-dependent; ROI, region-of-interest; TS, time series; AAL, automated anatomical labeling; HC, healthy control; SZ, schizophrenia, NHC, number of subjects in the HC group; NSZ, number of subjects in the SZ group; , optimal target non-zero ratio of weights between the Jth and (J+1)th hidden layers of the DNN obtained from the inner loop of nested cross validation using the training and validation data.

