ABSTRACT
Epstein-Barr virus (EBV) is an oncogenic human herpesvirus involved in the pathogenesis of Burkitt's lymphoma (BL) and various other lymphoproliferative disorders. In BL, EBV protein expression is restricted to EBV nuclear antigen 1 (EBNA1), but small noncoding RNAs such as EBV-encoded small RNAs (EBERs) and microRNAs (miRNAs) can also be detected. miRNAs play major roles in crucial processes such as proliferation, differentiation, and cell death. It has recently become clear that alterations in the expression profile of miRNAs contribute to the pathogenesis of a number of malignancies. During latent infection, EBV expresses 25 viral pre-miRNAs and modulates the expression of specific cellular miRNAs, such as miR-155 and miR-146, which potentially play a role in oncogenesis. Here, we established the small-RNA expression profiles of three BL cell lines. Using large-scale sequencing coupled to Northern blotting and real-time reverse transcription-PCR (RT-PCR) analysis validation, we demonstrated the differential expression of some cellular and viral miRNAs. High-level expression of the miR-183-96-182 cluster and EBV miR-BamHI A rightward transcript (miR-BART) cluster was significantly associated with EBV type I latency. This expression was not affected by viral reactivation since transforming growth factor β1 (TGF-β1) stimulation did not significantly change the miRNA profiles. However, using several approaches, including de novo infection with a mutant virus, we present evidence that the expression of latent membrane protein 1 (LMP-1) triggered downregulation of the expression of the miR-183-96-182 cluster. We further show that this effect involves the Akt signaling pathway.
IMPORTANCE In addition to expressing their own miRNAs, herpesviruses also impact the expression levels of cellular miRNAs. This regulation can be either positive or negative and usually results in the perturbation of pathways to create a cellular environment that is more “virus-friendly.” For example, EBV induces the expression of miR-155, a well-characterized oncomiR, which leads to increased cell proliferation and decreased cell death. Here, we show that EBV-encoded LMP-1 is also involved in the downregulation of a cluster of three miRNAs, miR-183, -96, and -182, which are known to be also repressed in several cancers. We therefore identify yet another potential player in EBV-induced oncogenesis.
INTRODUCTION
More than 90% of adults worldwide are infected with the Epstein-Barr virus (EBV), a member of the herpesvirus family (1). EBV is linked to the development of various lymphocyte malignancies, including Burkitt's lymphoma (BL), Hodgkin disease (HD), NK/T tumors, and lymphoproliferations linked to immunosuppression, including posttransplant lymphoproliferative disorders (PTLD) and AIDS-associated lymphomas (2). EBV mostly establishes a latent infection in its target cells. The expression pattern of latent genes allows distinguishing among three different latency types termed latency I to latency III. Latency III is characterized by the expression of all the known EBV latent proteins: EBV nuclear antigen 1 (EBNA1), -2, -3A, -3B, -3C, and -leader protein [LP] and latent membrane protein 1 (LMP-1), LMP-2A, and LMP-2B (3). BL expresses only EBNA1 and is categorized as latency I. HD, nasopharyngeal carcinoma, and NK/T-cell lymphoma display a type II latency, which is characterized by the expression of EBNA1, LMP-1, LMP-2A, and LMP-2B.
LMP-1 is considered to be the major oncoprotein of EBV, as it confers tumorigenicity to transformed rodent fibroblasts in nude mice and is expressed in HD, nasopharyngeal carcinoma, and immunosuppression-associated tumors (4, 5). It stimulates gene expression by activating various signaling pathways, such as the nuclear factor p38/mitogen-activated protein kinase (p38/MAPK), nuclear factor (NF)-κB, c-Jun N-terminal kinase (JNK)/activation protein 1 (AP-1), and phosphatidyl inositol 3 kinase (PI3K) pathways (6).
MicroRNAs (miRNAs) are small, ∼22-nucleotide (nt)-long noncoding RNAs which interfere with gene expression through destabilization of mRNA and inhibition of the translation machinery (7). MiRNAs regulate a variety of developmental and physiological processes. Their dysregulation is often found in cancer pathogenesis, where they function as oncogenes or tumor suppressors (8, 9). EBV was the first human virus shown to express miRNAs (10) and is to date the human virus that has been found to encode the most miRNAs, with 25 precursor miRNAs (pre-miRNAs) (11–14). EBV miRNAs are produced from two genomic clusters, BHRF1 and BART, and are expressed at various levels in tumor samples and different cell lines during viral latency (11, 12). Thus, expression of the BHRF1 miRNAs is restricted to type III latency, which is observed in lymphoblastoid cell lines (LCLs) and PTLD, while BART miRNAs are expressed in all latency stages (11, 15, 16).
Viruses often exploit cellular pathways in order to promote their replication cycle. Accordingly, they can also regulate the expression of cellular miRNAs to promote an environment favorable for the virus. Along these lines, some studies have shown a strong correlation between the latency-associated LMP-1 oncoprotein or EBV type III latency and the expression of miR-155 and miR-146a (17–19) but also with the suppression of miR-204 expression (20).
Cellular and EBV miRNA profiling in EBV-positive lymphoma cell lines in the three types of latency states has not been investigated. In this study, we performed small-RNA (sRNA) cloning followed by deep sequencing to analyze the expression profiles of the viral and cellular miRNAs of EBV-positive Mutu, Kem, and Sav BL cell lines treated with transforming growth factor β1 (TGF-β1) or left untreated. Mutu and Kem cells were in latency I as expected and are therefore referred to as Mutu-I and Kem-I. We took advantage of the appearance of a subculture of Sav cells expressing LMP-1 without EBNA2, which we refer to as Sav* cells, to look at the effect of LMP-1 expression in a BL context. In particular, we found that LMP-1 appears to participate in the deregulation of specific miRNAs, including the downregulation of the miR-183-96-182 cluster. We first validated this observation using BL41 cells infected with either the B95.8 or the P3HR1 virus. Because we could not distinguish between the effects mediated by LMP-1 and those mediated by EBNA2 in this context, we turned to de novo infection of EBV-negative Elijah cells with either a wild-type (wt) EBV or a LMP-1-deletion mutant EBV. This allowed us to definitely link the downregulation of the miR-183-96-182 cluster to the expression of LMP-1. We also confirmed that the expression of CYLD and KRAS, known targets of, respectively, miR-182 and miR-96, was inversely correlated with the expression of the miR-183-96-182 cluster. Finally, we showed that Akt was required for the downregulation of miR-183-96-182 expression.
MATERIALS AND METHODS
Cell culture and reagents.
The EBV-positive Burkitt's lymphoma cell lines were maintained in RPMI 1640 medium (Invitrogen, France) supplemented with 2 mM glutamine (Invitrogen, France), 100 μg/ml of primocin (Cayla, Toulouse, France), and 10% heat-inactivated fetal calf serum (FCS) (Invitrogen, France). TGF-β1 stimulation was performed in a formulation of this medium containing a reduced FCS concentration (0.5%). Purified recombinant TGF-β1 from Abcys (France) was added to reach a final concentration of 2 ng/ml.
Construction of the LMP-1-deletion mutant EBV and infection of Elijah cells.
We constructed the LMP-1 knockout mutant by deleting the first 1,086 nucleotides from the LMP-1 open reading frame, as well as 32 nucleotides before its start and the two intervening introns (reference strain NC_007605.1 coordinates 167745 to 169048), using homologous recombination with the B95-8 bacmid (21, 22). The deletion was obtained by exchanging this segment of the EBV genome with a kanamycin cassette flanked by FLP recombination sites cloned in the pCP15 plasmid. This was achieved by PCR amplification of the kanamycin cassette with the underlined sequences in the following composite primers: 5′-GTCATAGTAGCTTAGCTGAACTGGGCCGTGGGGGTCGTCAAACAGCTATGACCATGATTACGCC-3′ and 5′-TACATAAGCCTCTCACACTGCTCTGCCCCCTTCTTTCCTCCCAGTCACGACGTTGTAAAACGAC-3′. The nonunderlined external segments of these primers are homologous to the LMP-1 gene and are used to mediate homologous recombination.
The Elijah cell line was established from an EBV-positive Burkitt's lymphoma cell line. However, cell clones that have lost the EBV genome are available and were reinfected with the EBV wild type or with the LMP-1 knockout. Approximately one-third of cells were infected and expressed green fluorescent protein (GFP). These cells were sorted for GFP positivity on a FACSAria cell sorter (Becton-Dickinson). After sorting, purity exceeded 99%.
Small-RNA cloning and sequencing.
Total RNAs were extracted from untreated (0 h) and TGF-β1-treated (2 h and 24 h posttreatment) Mutu-I, Kem-I, and Sav* cells by using TRIzol reagent. Small-RNA libraries were prepared from 25 μg of total RNA as previously described (23, 24), and deep sequencing was performed at the IGBMC Microarray and Sequencing platform (Illkirch, France), using an Illumina Genome Analyzer IIx instrument with a read length of 36 nt. As the sRNA library deriving from the untreated (0 h) Sav* cells presented with around two times fewer reads than the other libraries, it was sequenced twice and the corresponding reads were pooled prior any analysis.
Deep-sequencing data analysis.
Short sequences produced by the Illumina instrument were preprocessed and annotated using an in-house pipeline. The Dustmasker program (25) and FASTX-Toolkit (http://hannonlab.cshl.edu/fastx_toolkit) were successively applied to filter out low-complexity reads and to remove instances of the 3′ adaptor. Remaining reads of 15 to 32 nt in length were then mapped simultaneously to the human (UCSC repository—assembly version hg19) and the EBV (RefSeq database—GenBank accession number NC_007605.1) genomes using Bowtie 0.12.7 (26) by permitting up to 1 mismatch in the first 15 nucleotides of each read. Only alignments from the lowest mismatch stratum were recorded provided that they did not exceed a total number of 2 mismatches, and reads that could map to more than 50 loci were discarded. From there, all known Homo sapiens and EBV miRNAs (miRBase v.17 [27]) were annotated using BEDTools 2.16.2 (28) by comparing their genomic coordinates to those of the aligned reads and by keeping reads with at least 50% of their length inside the genomic feature. During the quantification process, multiple mapped reads were weighted by the number of mapping sites in genomic features of interest. To allow subsequent comparative expression analysis, miRNA measures were normalized per 105 miRNA reads. Hierarchical clustering with complete linkages and Euclidean distances was performed using the union of the 100 most abundant cellular miRNAs as well as all the viral miRNAs in each compared library and the log2-transformed data.
Northern blot analysis.
Total RNA (10 μg) was mixed with an equal volume of formamide loading dye, and the mixture was heated at 95°C for 30 s prior to separation in a 17.5% urea-acrylamide gel. RNA was transferred to a Hybond-NX membrane (Amersham Biosciences) in Milli-Q water and chemically cross-linked at 65°C by using 1-ethyl-3-[3-dimethylaminopropyl] carbodiimide hydrochloride (EDC) (Sigma) for 90 min. Membranes were prehybridized for 2 h in PerfectHyb Plus solution (Sigma) at 50°C. All primers were synthesized by Sigma-Aldrich (France). All the oligonucleotides were 5′ end labeled with 25 μCi of [γ-32P]dATP by using T4 polynucleotide kinase (Fermentas), and the U6 gene was used as an internal control. The labeled probes were hybridized to the blot overnight at 50°C. The blot was then washed at 50°C twice for 10 min (5× SSC [1× SSC is 0.15 M NaCl plus 0.015 M sodium citrate]–0.1% SDS), followed by an additional wash (1× SSC–0.1% SDS) for 5 min. Northern blots were exposed to phosphorimager plates (Fuji) and scanned using a FLA-5100 series phosphorimager (Fuji).
RNA extraction and RT-quantitative PCR (qPCR) analysis.
Total RNA from Mutu-I, Kem-I, and Sav* cells treated with TGF-β1 or left untreated was extracted using TRIzol (Invitrogen, France) and was reverse transcribed with a miScript reverse transcription kit (Qiagen). The resulting cDNAs from 1 μg of total RNA were used for quantification of miRNA (miR-146a, miR-155, miR-96, miR-182, and miR-183), CYLD, and KRAS expression by real-time PCR.
For SYBR green real-time PCR, reactions were performed in triplicate with a miScript SYBR green PCR kit (Qiagen), using the manufacturer's protocol, on a LightCycler system (MxPro-Mx3005P; Agilent, France). All primers were synthesized by Sigma-Aldrich (France).
Relative expression values were calculated according to the comparative threshold cycle (ΔCT) method, with GAPDH (glyceraldehyde-3-phosphate dehydrogenase) (for CYLD and KRAS) or U6 (for miRNAs) as the endogenous reference (relative expression = 2−ΔCT; ΔCT values = average CT values of target − average CT values of endogenous reference).
Western blot analysis.
Detection of LMP-1, EBNA2, and GAPDH by Western blot analysis was performed using a 12% sodium dodecyl sulfate-polyacrylamide gel. Equal amounts of protein were loaded in all lanes. The proteins were transferred onto a nitrocellulose membrane (VWR, France), blocked in phosphate-buffered saline (PBS) containing 5% nonfat dry milk, and incubated with primary antibody overnight at 4°C. The anti-LMP-1 S12 monoclonal antibody was kindly provided by Nadira Delhem (Institut Pasteur de Lille). The antibody against EBNA2 was obtained from Dako (France). The anti-GAPDH antibody, rabbit peroxidase-conjugated IgG, and mouse peroxidase-conjugated IgG were purchased from Ozyme (St Quentin-en-Yvelines, France). The antitubulin monoclonal antibody was obtained from Sigma. The membrane was washed in PBS–0.1% Tween 20, incubated in secondary antibody (horseradish peroxidase-conjugated goat anti-mouse or horseradish peroxidase-conjugated goat anti-rabbit) for 1 h at room temperature, and then washed. Antibody binding was detected by enhanced chemiluminescence (West Pico or Femto; Pierce Biotechnology). Images were captured using a CCD camera (LAS-1000; Fuji System).
Akt inhibition.
Cells were treated with Akt inhibitor X (Calbiochem) at a final concentration of 5 μM for 48 h and then tested for viability using trypan blue before total RNA was extracted and used for mRNA and miRNA quantification.
Accession numbers.
The sequencing data discussed in this publication have been deposited in NCBI's Gene Expression Omnibus (29) and are accessible through GEO Series accession number GSE65752.
RESULTS
Comparison of miRNA profiles of Mutu-I, Kem-I, and Sav* cells.
While characterizing the BL cell lines that we had in the laboratory, we noticed that the Sav cell line was expressing LMP-1 whereas the Mutu-I and Kem-I cells were expressing neither LMP-1 nor EBNA2, as expected (Fig. 1). This did not represent a true latency III type, because there was no expression of EBNA2, and we do not know whether it is a latency II type, because, for technical reasons, we could not measure the expression levels of LMP-2A and LMP-2B. We therefore renamed this Sav-derivative cell line Sav* and decided to take advantage of this to measure the impact of LMP-1 on miRNA profiles in a BL context. In addition, in order to look at the effect of lytic induction, we treated the cells for 2 and 24 h with TGF-β1. Therefore, we extracted total RNA from Mutu-I, Kem-I, and Sav* cells before and after TGF-β1 treatment and performed small-RNA cloning and sequencing as previously described (23, 24). Figure 2 shows the results of comparisons of the expression levels of the most abundant cellular and viral miRNAs in all libraries. Although it strongly induced the lytic cycle, as assessed by measurement of the ZEBRA protein expression (Fig. 1), the TGF-β1 treatment appeared to have only a limited effect in all three cell lines (Fig. 2). However, the miRNA profile of the Sav* cells clearly showed that they were distinct from the profiles of the Mutu-I and Kem-I cells. This was true for both cellular and viral miRNAs. While Mutu-I and Kem-I cells showed a high level of expression of the BamHI A rightward transcript (BART) miRNAs and a low level of expression of the BHRF-1 miRNAs, Sav* cells displayed the opposite expression levels of viral miRNAs (see Table S1 in the supplemental material). Intriguingly, however, the level of miR–BHRF1-3 remained low in the Sav* cells. Among the most highly deregulated cellular miRNAs, we could observe that miR-146a and miR-155 were strongly upregulated in Sav* cells, as expected from the presence of LMP-1 in these cells. In addition, we also noticed that other miRNAs were strongly downregulated, among them miR-182 (Fig. 2). Regulation of this specific cellular miRNA by LMP-1 has not been reported before; we therefore decided to focus our attention on this observation.
FIG 1.
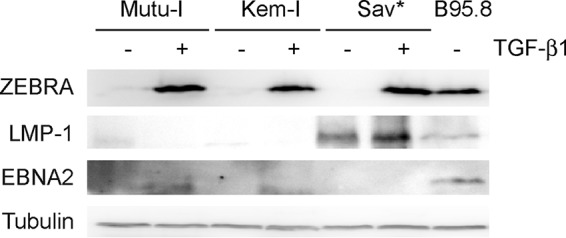
TGF-β1 treatment readily induced expression of the ZEBRA lytic gene in all treated cell lines. Results of Western blot analysis for detection of the indicated proteins in Mutu-I, Kem-I, and Sav* cells treated with TGF-β1 or left untreated are shown. B95.8 cells were used as a positive control, and tubulin was used as a loading control.
FIG 2.
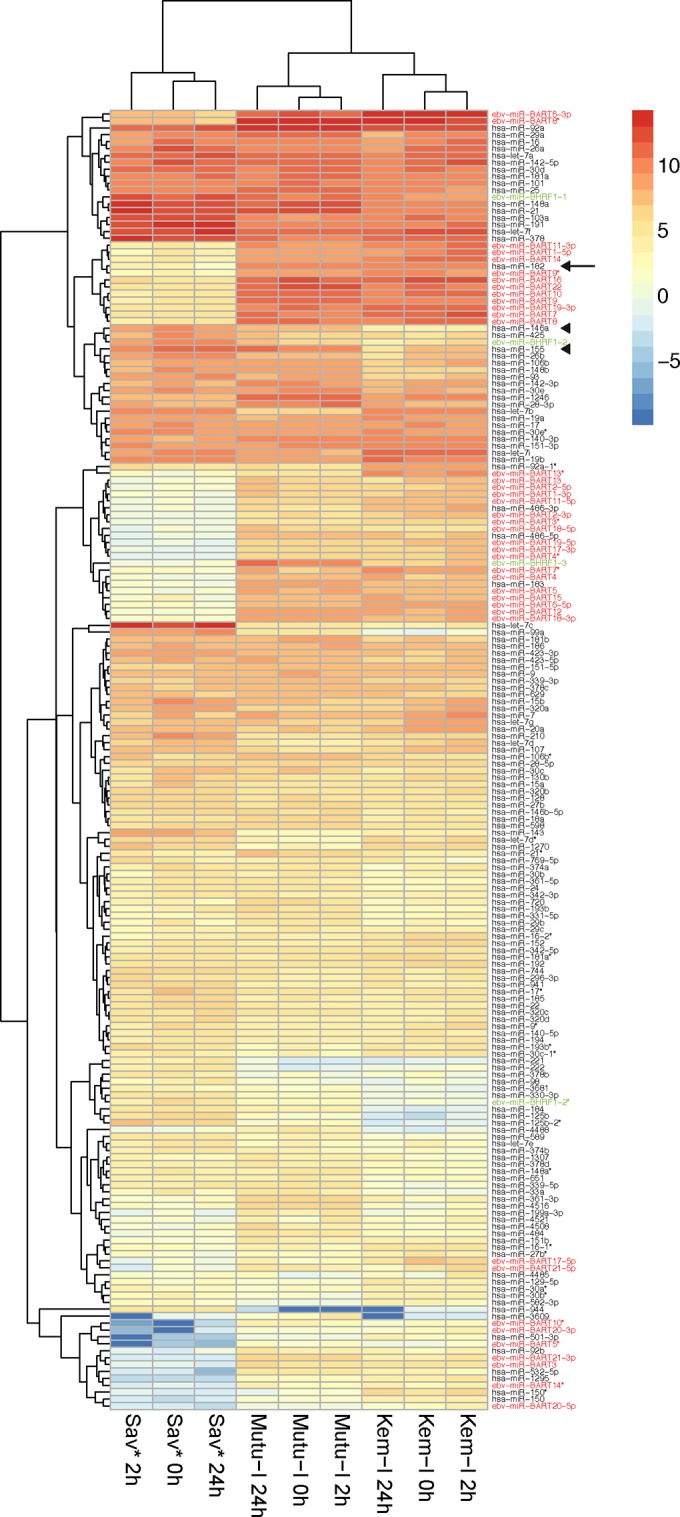
Cellular and viral miRNA profiling in EBV-positive BL cell lines. The heat map shows hierarchical clustering of the different samples and of the 100 most abundant cellular miRNAs and viral miRNAs in each sample on the basis of their expression profile. High relative miRNA expression (log2 transformed) is indicated by red shading and low expression by blue shading. BART miRNAs are indicated in red, BHRF1 miRNAs are indicated in green, miR-182 is indicated by an arrow, and miR-146a and miR-155 are indicated by arrowheads. hsa, Homo sapiens.
Validation of the small-RNA sequencing data.
According to the deep-sequencing results, the general miRNA profile revealed strong differences between the two BL cell lines exhibiting type I latency and the Sav* cell line. In order to validate these observations, we performed Northern blot analysis of RNA extracted from Mutu-I, Kem-I, and Sav* cells before and after induction with TGF-β1. As shown in Fig. 3, we confirmed that the Sav* cells expressed large amounts of miR–BHRF1-2 but no miR-BART22, while Mutu-I and Kem-I showed the opposite results. We also confirmed the strong overexpression of miR-146a and miR-155 in Sav* cells compared to Mutu-I and Kem-I cells. Our analysis also allowed us to validate the absence of a measurable effect of TGF-β1 treatment on miRNA levels in all three cell lines. Finally, we validated the very low levels of miR-182 in Sav* cells, whereas this miRNA was expressed at significant levels in the two other cell lines.
FIG 3.
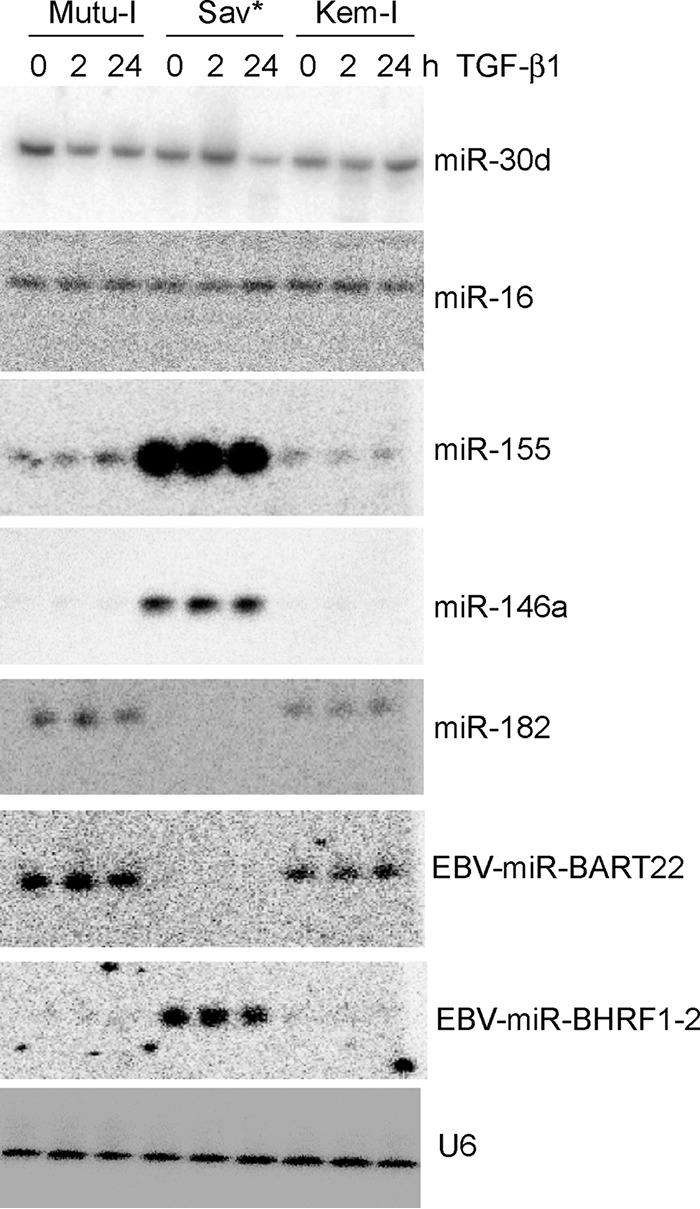
Effect of TGF-β1 expression on a selected subset of miRNAs. Results of Northern blot analysis of total RNA extracted from Mutu-I, Kem-I, and Sav* cells before and after induction (at 2 h and 24 h) with TGF-β1 are shown. Specific probes to measure the level of mature miRNAs miR-30d, miR-16, miR-155, miR-146a, miR-182, EBV-miR-BART22, and EBV–miR–BHRF1-2 were used. U6 snRNA was used as a loading control.
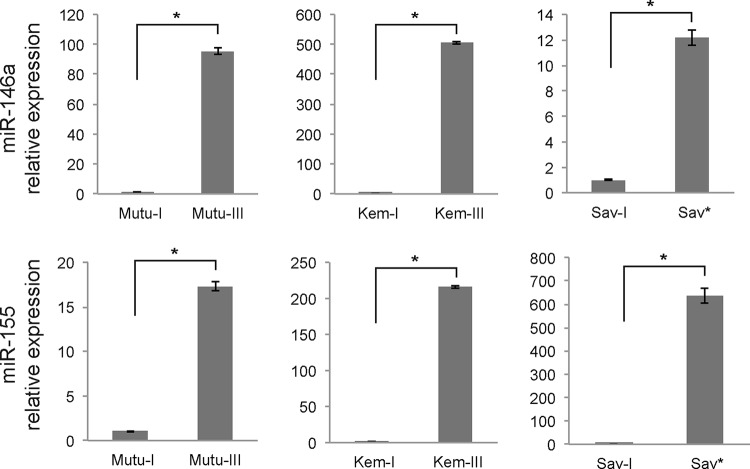
In order to make sure that the difference between the Sav* cells and the Mutu-I and Kem-I cells was not a peculiarity of this specific cell line, we then included Mutu-III, Kem-III, and Sav-I cell lines in our analysis to compare the latency I and latency III types in the same cellular background. Using real-time RT-PCR analysis, we measured the levels of miR-146a and miR-155 and observed that for all of the cell lines (i.e., Mutu, Kem, and Sav), there was a strong overexpression of these two miRNA in latency III versus latency I or between Sav* and Sav-I cells (Fig. 4). This indicates that the LMP-1-mediated effect is not limited to the Sav cells but can be generalized to other cell lines.
FIG 4.
Differential expression of miR-146a and miR-155 in latency I and III cell lines versus Sav* cells. Relative expression of the indicated miRNAs was assessed by RT-qPCR analysis of total RNA extracted from latency I and latency III Mutu and Kem cells and from Sav-I and Sav* cells. Results were normalized to U6 snRNA expression. *, P < 0.001 (Student t test).
miR-182, -96, and -183 are specifically repressed by LMP-1.
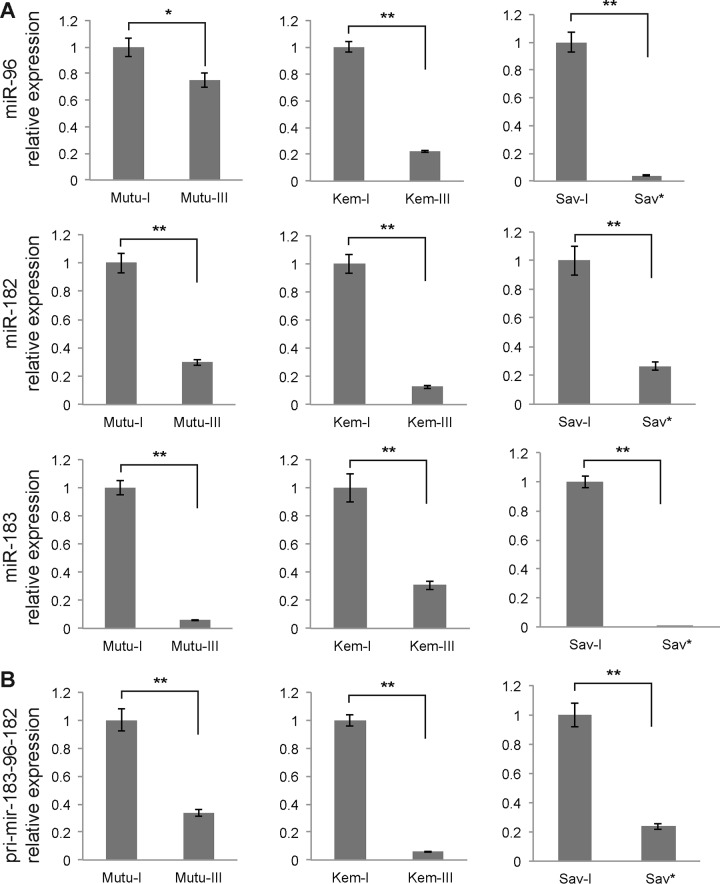
We next measured the expression of miR-182 by RT-qPCR. We also looked at the expression of two miRNAs, miR-96 and miR-183, which derive from the same genomic locus and which are therefore expressed in a cluster with miR-182 on the same primary transcript. The analysis of miR-182 expression confirmed the Northern blot results and showed that this miRNA is downregulated in the latency III Mutu and Kem cell lines and in the Sav* cells compared to the latency I cell lines (Fig. 5A). Similarly, miR-96 and miR-183 expression levels were lower than those seen with the latency I cells in all three cell lines tested. To confirm that the downregulation of these three miRNAs occurred at the level of the primary transcript, before Drosha processing, we then measured the level of the pri-mir-183-96-182 transcript by RT-qPCR. Again, its level was strongly downregulated in Mutu-III, Kem-III, and Sav* cells compared to the latency I cells (Fig. 5B). These results thus suggest that LMP-1 expression interferes with expression of the miR-183-96-182 cluster.
FIG 5.
Real-time PCR analysis of the expression levels of members of the miR-183-96-182 cluster in Mutu, Kem, and Sav cell lines. (A) Relative expression of the mature forms of miR-96, miR-182, and miR-183 as assessed by real-time PCR and after normalization to U6 snRNA. (B) Quantification of the expression of the pri-mir-183-96-182 primary transcript by RT-qPCR after normalization to GAPDH. *, P < 0.05; **, P < 0.01 (Student t test).
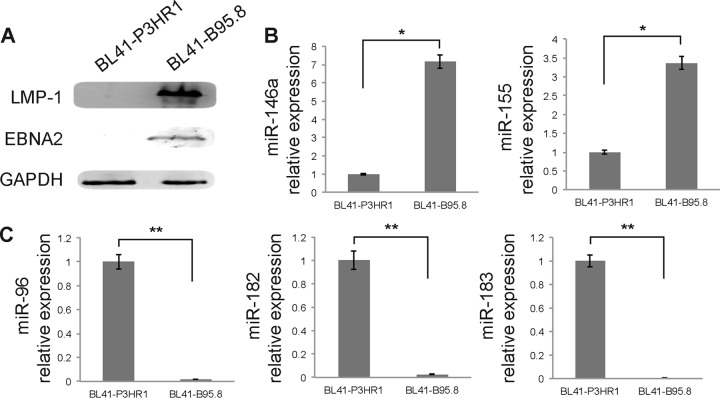
In order to expand further the observation that LMP-1 indeed downregulated the expression of miR-96, -182, and -183, we then analyzed miRNAs from BL41 cells infected with either the EBV B95.8 laboratory strain or the P3HR1 strain, which presents a deletion of the BamHI WYH region and consequently lacks the coding sequence for EBNA2. The lack of EBNA2 results in the absence of LMP-1 expression, as we confirmed by Western blot analysis (Fig. 6A), and we therefore looked at the effect of the two EBV strains on miRNA expression. We confirmed that BL41-B95.8 cells showed strongly increased expression of both miR-146a and miR-155 compared to BL41-P3HR1 cells (Fig. 6B). Quantification of miR-96, -182, and -183 by RT-qPCR also confirmed that in this setup, the presence of LMP-1 results in a strong downregulation of the expression of these miRNAs (Fig. 6C).
FIG 6.
Effect of LMP-1 expression on miRNA expression in BL41 cells. (A) Expression of LMP-1 and EBNA2 in BL41-P3HR1 and BL41-B95.8 cells was measured by Western blot analysis. GAPDH was used as an internal control. (B) RT-qPCR analysis of the expression of mature miRNAs miR-146a and miR-155 in BL41 cells infected with the B95.8 or P3HR1 strain of EBV. (C) RT-qPCR analysis of miR-96, -182, and -183 expression in BL41-B95.8 and BL41-P3HR1 cells. *, P < 0.01; **, P < 0.0001 (Student t test).
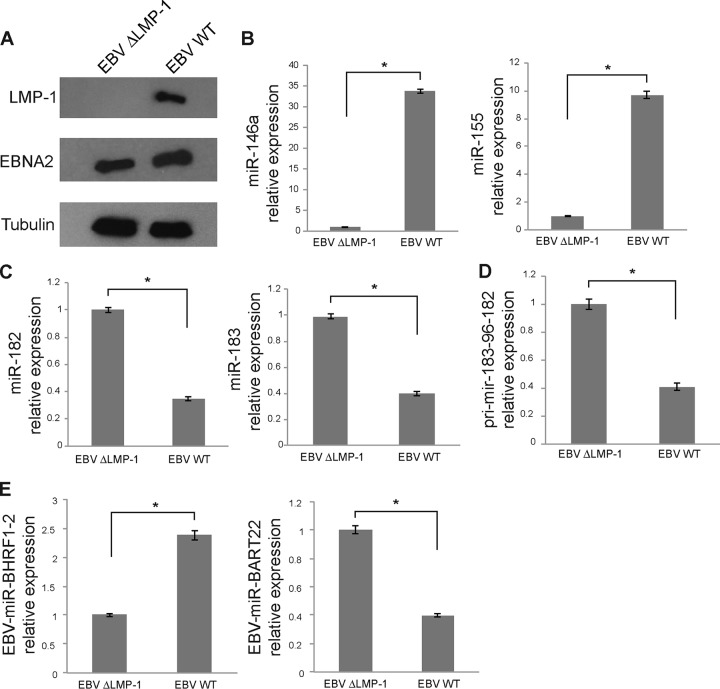
We then tried to complement the lack of LMP-1 in the BL41-P3HR1 cells to see whether we could reverse the effect on miR-96, -182, and -183. To this end, we transduced BL41-P3HR1 cells with the pLenti6–LMP-1 lentivirus. However, we did not manage to affect expression of miR-183-96-182 in this setup, probably due to a suboptimal level of LMP-1 expression (data not shown). In order to circumvent this problem, we thus turned to the use of a B95.8 virus in which the LMP-1 gene had been knocked out by deletion of a roughly 1-kb fragment of the coding sequence. We used this mutant virus or the parental wild-type (wt) virus to infect EBV-negative subclone 5E5 of the Burkitt's lymphoma Elijah cell line. After 4 weeks of infection, about one-third of the cells were positive for GFP; we thus sorted the cells by fluorescence-activated cell sorter (FACS) analysis to obtain a pure population of EBV-infected cells for further analysis. We confirmed that cells infected with the ΔLMP-1 mutant virus did not express LMP-1 but did express EBNA2, while cells infected with the wt virus expressed both proteins (Fig. 7A). We then measured the expression of miR-146 and miR-155 by RT-qPCR to confirm that deletion of LMP-1 had had the expected effect. Our analysis revealed that expression of both miRNAs was strongly induced in cells infected by the wt virus compared to cells infected with the mutant virus (Fig. 7B). We monitored the impact of LMP-1 in this context on miR-182 and miR-183 expression and observed that cells infected with the wt virus expressed significantly less of both miRNAs than cells infected with the ΔLMP-1 virus (Fig. 7C). We also measured the expression of the pri-mir-183-96-182 primary transcript by RT-qPCR and also observed its downregulation in cells infected by the wt virus compared to cells infected with the mutant virus (Fig. 7D). Finally, quantification of EBV–miR–BHRF1-2 and miR-BART22 revealed that, similarly to the results of the experiments performed with Sav* cells versus Mutu-I and Kem-I cells, their expression was also controlled by LMP-1 (Fig. 7E). Taken together, these results therefore indicate that, in EBV-positive BL cell lines, LMP-1 is necessary for the aforementioned regulation of miRNA expression.
FIG 7.
Characterization of Elijah cells infected with the ΔLMP-1 or wt EBV. (A) Western blot analysis of LMP-1 and EBNA2 expression in Elijah cells infected with the LMP-1 mutant or wt virus. Actin was used as a loading control. (B) RT-qPCR analysis of miR-146a and miR-155 expression in Elijah cells infected with either an LMP-1 knockout virus (ΔLMP-1) or wt EBV B95.8. (C) RT-qPCR analysis of miR-182 and miR-183 expression in the same cells. Results of miRNA RT-qPCR were normalized to U6 snRNA expression. (D) Quantification of the expression of the pri-mir-183-96-182 primary transcript by RT-qPCR after normalization to GAPDH in cells infected with the EBV ΔLMP-1 mutant or the wt virus. (E) RT-qPCR quantification of EBV–miR–BHRF1-2 and -BART22 in the same cells. U6 snRNA was used as a normalizer. *, P < 0.01 (Student t test).
The expression of miR-182 and miR-96 targets is upregulated by LMP-1.
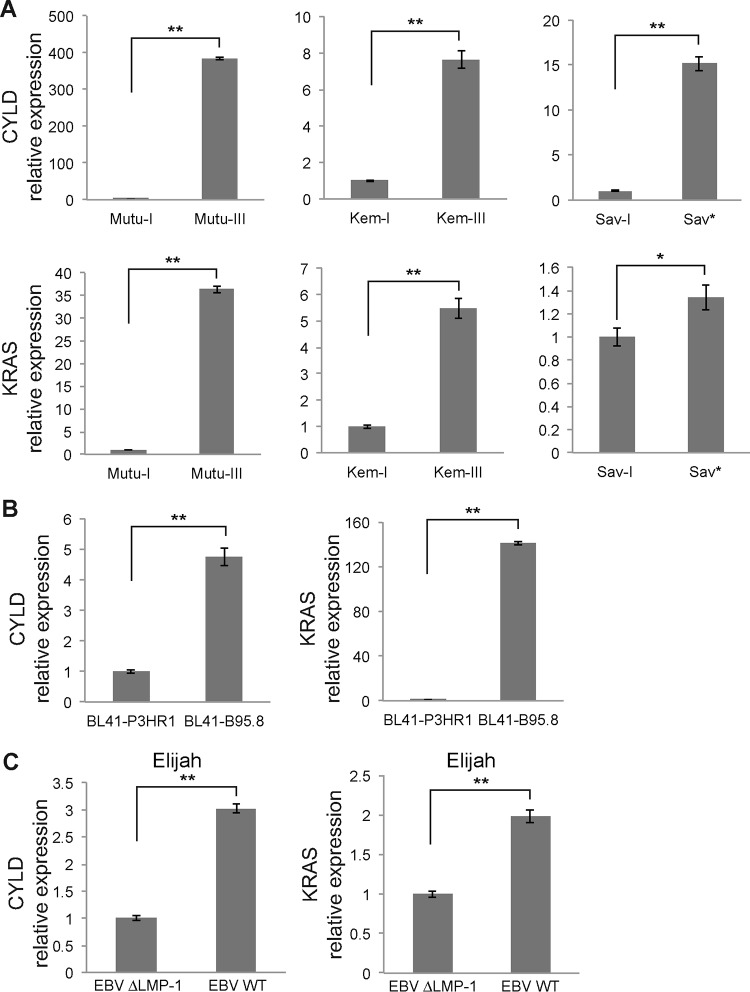
Having validated the importance of LMP-1 in the downregulation of miR-96, -182, and -183, we next looked at the functional implications of this effect. To do so, we tested known targets of these miRNAs to check whether their expression was inversely correlated with that of the regulated miRNAs. Namely, we analyzed the expression of CYLD and KRAS. CYLD is a K63-specific deubiquitinase that was previously shown to be involved in switching off NF-κB signaling (30, 31) and was recently reported to be a direct target of miR-182 in glioma (32, 33). KRAS is one of the three RAS oncogene family members, which encode small GTPases that are involved in cellular signal transduction (34). Yu et al. reported that miR-96 targets the KRAS oncogene and functions as a tumor-suppressing miRNA in pancreatic cancer cells. Ectopic expression of miR-96 through a synthetic miRNA precursor inhibited KRAS, dampened Akt signaling, and triggered apoptosis in cells (35). We measured the expression of CYLD and KRAS mRNAs by RT-qPCR analysis in Mutu-I and -III, Kem-I and -III, and Sav-I and Sav* cells using the GAPDH gene as an internal control. The results indicated that the expression levels of these two genes are strongly upregulated in latency III and Sav* cells (Fig. 8A). In addition, we made the same observation in BL41 cells, where both CYLD and KRAS mRNAs were upregulated in cells infected with the B95.8 virus, which expresses LMP-1 (Fig. 8B). Finally, we also measured CYLD and KRAS mRNA levels in Elijah cells infected with wt or ΔLMP-1 EBV and observed that they were upregulated when LMP-1 was expressed (Fig. 8C).
FIG 8.
Quantification of CYLD and KRAS mRNA expression by RT-qPCR. (A) Expression of CYLD and KRAS mRNAs in Mutu-I and -III, Kem-I and -III, and Sav-I and Sav*. (B) Expression of CYLD and KRAS mRNAs in BL41 cells infected with the P3HR1 virus or the B95.8 virus. (C) RT-qPCR quantification of CYLD and KRAS mRNAs in Elijah cells infected with the ΔLMP-1 virus or the wt virus. GAPDH was used as a normalizer. *, P < 0.05; **, P < 0.01 (Student t test).
LMP-1 represses expression of the miR-183-96-182 cluster through Akt signaling.
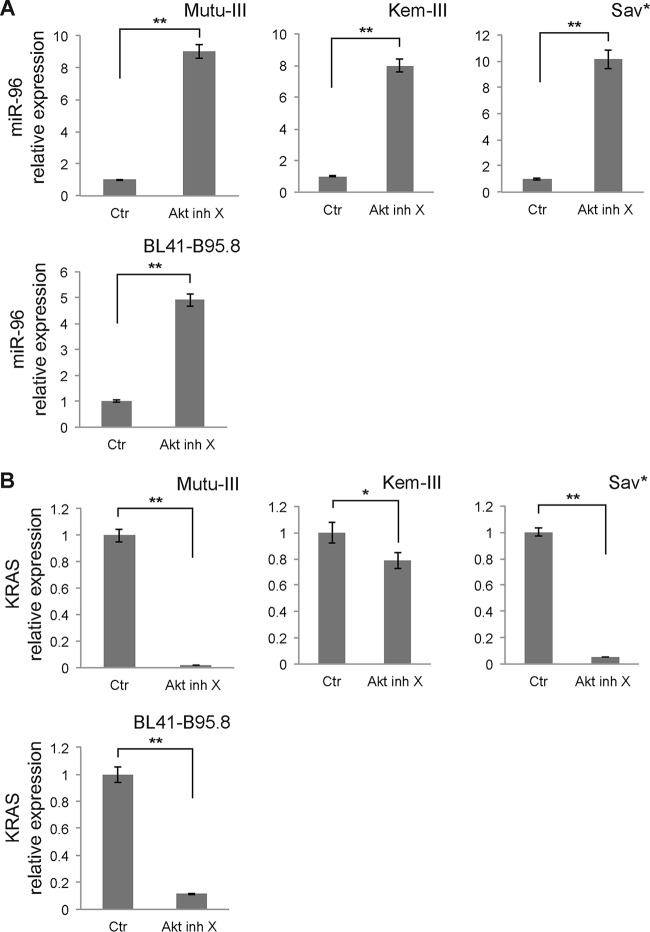
Several studies indicate that LMP-1 activates phosphatidylinositol 3 kinase (PI3K)/Akt signaling and that this activation is required for transformation of rodent fibroblasts (36, 37). We therefore looked into the involvement of Akt in the regulation of miR-96, -182, and -183 by LMP-1. We treated Mutu-III, Kem-III, Sav*, and BL41-B95.8 cells with Akt inhibitor X for 48 h and measured miRNA expression by RT-qPCR. We observed strong upregulation of miR-96 expression in cells treated with the inhibitor (Fig. 9A). A similar effect was observed for miR-182 and -183 (data not shown).
FIG 9.
Role of Akt signaling in LMP-1-induced regulation of the miR-183-96-182 cluster. Mutu-III, Kem-III, Sav*, and BL41-B95.8 cells were treated with Akt inhibitor X (Akt inh X) for 48 h. (A) Effect of Akt inhibition on miR-96 expression in the indicated cell lines. Results were normalized to U6 snRNA expression. Ctr, control. (B) RT-qPCR quantification of KRAS mRNA expression in the same cell lines treated with the Akt inhibitor or left untreated. Transcript levels were normalized to GAPDH expression. *, P < 0.05; **, P < 0.01 (Student t test).
In parallel, we also measured the expression of KRAS by RT-qPCR in Mutu-III, Kem-III, Sav*, and BL41-B95.8 cells treated with Akt inhibitor X or left untreated. As expected, decreased levels of KRAS mRNA in the presence of the inhibitor were measured in all cell lines (Fig. 9B). Taken together, these results therefore indicate that PI3K/Akt signaling is essential for the modulation of the miR-183-96-182 cluster by LMP-1.
DISCUSSION
Viruses are experts in manipulating the machinery of the host for all of the molecular processes required for their multiplication and propagation. The miRNA pathway is no exception to this hijacking rule, and there is now ample evidence that viruses interact extensively with these small regulatory RNAs. In addition to the direct use of the host miRNA biogenesis machinery to express their own miRNAs, viruses have also evolved strategies to modulate the expression of cellular miRNAs. This regulation can be either positive or negative, and, as recently pointed out in a review by Guo and Steitz, we can distinguish between the destroyer, the booster, and the hijacker when we invoke the impact of viruses on host miRNA (38). For example, two viruses, herpesvirus saimiri (HSV) and mouse cytomegalovirus, have been shown to trigger active degradation of the mature form of cellular miR-27 (39, 40). In the case of HSV, this regulation is needed to prevent the regulatory effect of miR-27 on the T-cell receptor signaling pathway (41). In contrast to this “destroyer” mode of action, other viruses boost the expression of host miRNAs. One of the better-studied examples is that of the induction of miR-155 expression by EBV, which can be as high as 1,000-fold in latently infected B lymphocytes (42). This overexpression is due to the activation of pri-mir-155 transcription by LMP-1 through the NF-κB pathway (43). It has been postulated that high miR-155 levels are partly responsible for the immortalization of B cells by EBV (44) and for its oncogenic properties. Indeed, transgenic mice expressing high levels of this miRNA develop B-cell leukemia and lymphoma (45). Similarly, miR-146a is also strongly induced by LMP-1, although the implications of this deregulation are not yet known (19).
In this study, we confirmed the upregulation of miR-155 and miR-146a by EBV LMP-1, and we also report for the first time that this viral protein is responsible for the acute downregulation of a cluster of three miRNAs, miR-96, miR-182, and miR-183. Others have monitored the miRNA profiles of Mutu-I cells but did not identify the downregulation of these miRNAs, most probably because they compared these cells to LCLs (46). We provide clear evidence that, interestingly, the repression of these miRNAs occurs only in cells that are latently infected with EBV and which express LMP-1 at sufficiently high levels. We were able to identify a direct link with the role of LMP-1 in this regulation, as infection of EBV-negative cells with a mutant virus deleted of LMP-1 does not result in the repression of the miR-183-96-182 that is observed with a wt virus. We also show that known targets of miR-96 and miR-182 are regulated in opposite directions as the result of LMP-1 expression. The latter result provides some indications regarding the impact of this miRNA regulation, as, for example, we show that the KRAS oncogene is strongly induced in EBV-infected cells expressing LMP-1. Our observations are therefore in favor of a role for miR-183-96-182 as a tumor suppressor that operates in a manner similar to what has been reported in cases of oncogenic disorders such as pancreatic cancer (35) and breast cancer (47). It should be noted, however, that in other cases, such as that of classical HD, the expression of this cluster can be upregulated (48). Nonetheless, in the latter study, most cases were EBV negative; thus, it would be interesting to look at the impact of EBV and LMP-1 in HD cell lines. It could very well be that the expression of this cluster is increased in some tumor cells but can be repressed by LMP-1. Interestingly, it was recently shown that another virus, human cytomegalovirus, could induce the expression of the miR-183-96-182 cluster, although in this case, it was a lytic infection (49) and the outcome of the infection was an arrest of the cell cycle, which would be the opposite of the outcome of EBV infection.
Finally, our results also allowed us to link the effect of LMP-1 on the expression of the miR-183-96-182 cluster to the PI3K/Akt signaling pathway. We showed that treatment with Akt inhibitor X could prevent downregulation of this miRNA cluster. Akt kinases are known to be key mediators of signal transduction pathways, and inhibition of Akt signaling induces apoptosis (see reference 50 for a review). It has been shown that one of the signaling domains of LMP-1, the carboxy-terminal activating region which mediates Akt activation, was necessary for LMP-1-mediated transformation of rat and human fibroblasts (37) and of B lymphocytes (51). Taken together, our results are consistent with the assumption that downregulation of the expression of the miR-183-96-182 cluster is key for EBV-mediated transformation.
Supplementary Material
ACKNOWLEDGMENTS
This work was supported by a grant from the Institut National du Cancer (INCa-PLBIO-2009-173) and by the European Research Council (ERC Starting Grant ncRNAVIR 260767).
We thank Eva Klein for providing us with cell lines, which allowed us to reinforce our conviction of the role of the miR-183-96-182 cluster in LMP-1-induced transformation. We thank Malek Alioua and Mélanie Messmer for essential help with the real-time PCR analysis. We also thank Valérie Cognat and the BioImage facility (IBMP, Strasbourg, France) for help with the initial analysis of the deep sequencing data and the personnel of the IGBMC Microarray and Sequencing platform, a member of the France Genomique program, for the sequencing of our libraries. Finally, we thank the personnel of the DKFZ Immunology Core Facility for performing the cell sorting.
Footnotes
Supplemental material for this article may be found at http://dx.doi.org/10.1128/JVI.01757-15.
REFERENCES
- 1.Yao QY, Tierney RJ, Croom-Carter D, Dukers D, Cooper GM, Ellis CJ, Rowe M, Rickinson AB. 1996. Frequency of multiple Epstein-Barr virus infections in T-cell-immunocompromised individuals. J Virol 70:4884–4894. [DOI] [PMC free article] [PubMed] [Google Scholar]
- 2.Raab-Traub N, Flynn K. 1986. The structure of the termini of the Epstein-Barr virus as a marker of clonal cellular proliferation. Cell 47:883–889. doi: 10.1016/0092-8674(86)90803-2. [DOI] [PubMed] [Google Scholar]
- 3.Hiraki A, Fujii N, Masuda K, Ikeda K, Tanimoto M. 2001. Genetics of Epstein-Barr virus infection. Biomed Pharmacother 55:369–372. doi: 10.1016/S0753-3322(01)00084-1. [DOI] [PubMed] [Google Scholar]
- 4.Wang D, Liebowitz D, Kieff E. 1985. An EBV membrane protein expressed in immortalized lymphocytes transforms established rodent cells. Cell 43:831–840. doi: 10.1016/0092-8674(85)90256-9. [DOI] [PubMed] [Google Scholar]
- 5.Pathmanathan R, Prasad U, Chandrika G, Sadler R, Flynn K, Raab-Traub N. 1995. Undifferentiated, nonkeratinizing, and squamous cell carcinoma of the nasopharynx. Variants of Epstein-Barr virus-infected neoplasia. Am J Pathol 146:1355–1367. [PMC free article] [PubMed] [Google Scholar]
- 6.Li H-P, Chang Y-S. 2003. Epstein-Barr virus latent membrane protein 1: structure and functions. J Biomed Sci 10:490–504. doi: 10.1007/BF02256110. [DOI] [PubMed] [Google Scholar]
- 7.Mannick JB, Asano K, Izumi K, Kieff E, Stamler JS. 1994. Nitric oxide produced by human B lymphocytes inhibits apoptosis and Epstein-Barr virus reactivation. Cell 79:1137–1146. doi: 10.1016/0092-8674(94)90005-1. [DOI] [PubMed] [Google Scholar]
- 8.Kloosterman WP, Plasterk RH. 2006. The diverse functions of microRNAs in animal development and disease. Dev Cell 11:441–450. doi: 10.1016/j.devcel.2006.09.009. [DOI] [PubMed] [Google Scholar]
- 9.Zhang B, Pan X, Cobb GP, Anderson TA. 2007. microRNAs as oncogenes and tumor suppressors. Dev Biol 302:1–12. doi: 10.1016/j.ydbio.2006.08.028. [DOI] [PubMed] [Google Scholar]
- 10.Pfeffer S, Zavolan M, Grasser FA, Chien M, Russo JJ, Ju J, John B, Enright AJ, Marks D, Sander C, Tuschl T. 2004. Identification of virus-encoded microRNAs. Science 304:734–736. doi: 10.1126/science.1096781. [DOI] [PubMed] [Google Scholar]
- 11.Cai X, Schäfer A, Lu S, Bilello JP, Desrosiers RC, Edwards R, Raab-Traub N, Cullen BR. 2006. Epstein-Barr virus microRNAs are evolutionarily conserved and differentially expressed. PLoS Pathog 2:e23. doi: 10.1371/journal.ppat.0020023. [DOI] [PMC free article] [PubMed] [Google Scholar]
- 12.Lung RW-M, Tong JH-M, Sung Y-M, Leung P-S, Ng DC-H, Chau S-L, Chan AW-H, Ng EK-O, Lo K-W, To K-F. 2009. Modulation of LMP2A expression by a newly identified Epstein-Barr virus-encoded microRNA miR-BART22. Neoplasia 11:1174–1184. doi: 10.1593/neo.09888. [DOI] [PMC free article] [PubMed] [Google Scholar]
- 13.Zhu JY, Pfuhl T, Motsch N, Barth S, Nicholls J, Grässer F, Meister G. 2009. Identification of novel Epstein-Barr virus microRNA genes from nasopharyngeal carcinomas. J Virol 83:3333–3341. doi: 10.1128/JVI.01689-08. [DOI] [PMC free article] [PubMed] [Google Scholar]
- 14.Chen S-J, Chen G-H, Chen Y-H, Liu C-Y, Chang K-P, Chang Y-S, Chen H-C. 2010. Characterization of Epstein-Barr virus miRNAome in nasopharyngeal carcinoma by deep sequencing. PLoS One 5:e12745. doi: 10.1371/journal.pone.0012745. [DOI] [PMC free article] [PubMed] [Google Scholar]
- 15.Pratt ZL, Kuzembayeva M, Sengupta S, Sugden B. 2009. The microRNAs of Epstein-Barr virus are expressed at dramatically differing levels among cell lines. Virology 386:387–397. doi: 10.1016/j.virol.2009.01.006. [DOI] [PMC free article] [PubMed] [Google Scholar]
- 16.Amoroso R, Fitzsimmons L, Thomas WA, Kelly GL, Rowe M, Bell AI. 2011. Quantitative studies of Epstein-Barr virus-encoded microRNAs provide novel insights into their regulation. J Virol 85:996–1010. doi: 10.1128/JVI.01528-10. [DOI] [PMC free article] [PubMed] [Google Scholar]
- 17.Jiang J, Lee EJ, Schmittgen TD. 2006. Increased expression of microRNA-155 in Epstein-Barr virus transformed lymphoblastoid cell lines. Genes Chromosomes Cancer 45:103–106. doi: 10.1002/gcc.20264. [DOI] [PubMed] [Google Scholar]
- 18.Kluiver J, Haralambieva E, de Jong D, Blokzijl T, Jacobs S, Kroesen BJ, Poppema S, van den Berg A. 2006. Lack of BIC and microRNA miR-155 expression in primary cases of Burkitt lymphoma. Genes Chromosomes Cancer 45:147–153. doi: 10.1002/gcc.20273. [DOI] [PubMed] [Google Scholar]
- 19.Cameron JE, Yin Q, Fewell C, Lacey M, McBride J, Wang X, Lin Z, Schaefer BC, Flemington EK. 2008. Epstein-Barr virus latent membrane protein 1 induces cellular microRNA miR-146a, a modulator of lymphocyte signaling pathways. J Virol 82:1946–1958. doi: 10.1128/JVI.02136-07. [DOI] [PMC free article] [PubMed] [Google Scholar]
- 20.Ma L, Deng X, Wu M, Zhang G, Huang J. 2014. Down-regulation of miRNA-204 by LMP-1 enhances CDC42 activity and facilitates invasion of EBV-associated nasopharyngeal carcinoma cells. FEBS Lett 588:1562–1570. doi: 10.1016/j.febslet.2014.02.039. [DOI] [PubMed] [Google Scholar]
- 21.Delecluse HJ, Hilsendegen T, Pich D, Zeidler R, Hammerschmidt W. 1998. Propagation and recovery of intact, infectious Epstein-Barr virus from prokaryotic to human cells. Proc Natl Acad Sci U S A 95:8245–8250. doi: 10.1073/pnas.95.14.8245. [DOI] [PMC free article] [PubMed] [Google Scholar]
- 22.Hutzinger R, Feederle R, Mrazek J, Schiefermeier N, Balwierz PJ, Zavolan M, Polacek N, Delecluse H-J, Hüttenhofer A. 2009. Expression and processing of a small nucleolar RNA from the Epstein-Barr virus genome. PLoS Pathog 5:e1000547. doi: 10.1371/journal.ppat.1000547. [DOI] [PMC free article] [PubMed] [Google Scholar]
- 23.Pfeffer S. 2007. Identification of virally encoded microRNAs. Methods Enzymol 427:51–63. doi: 10.1016/S0076-6879(07)27003-X. [DOI] [PubMed] [Google Scholar]
- 24.Tuddenham L, Jung JS, Chane-Woon-Ming B, Dölken L, Pfeffer S. 2012. Small RNA deep sequencing identifies microRNAs and other small noncoding RNAs from human herpesvirus 6B. J Virol 86:1638–1649. doi: 10.1128/JVI.05911-11. [DOI] [PMC free article] [PubMed] [Google Scholar]
- 25.Morgulis A, Gertz EM, Schäffer AA, Agarwala R. 2006. A fast and symmetric DUST implementation to mask low-complexity DNA sequences. J Comput Biol 13:1028–1040. doi: 10.1089/cmb.2006.13.1028. [DOI] [PubMed] [Google Scholar]
- 26.Langmead B, Trapnell C, Pop M, Salzberg SL. 2009. Ultrafast and memory-efficient alignment of short DNA sequences to the human genome. Genome Biol 10:R25. doi: 10.1186/gb-2009-10-3-r25. [DOI] [PMC free article] [PubMed] [Google Scholar]
- 27.Griffiths-Jones S. 2004. The microRNA registry. Nucleic Acids Res 32:D109–D111. doi: 10.1093/nar/gkh023. [DOI] [PMC free article] [PubMed] [Google Scholar]
- 28.Quinlan AR, Hall IM. 2010. BEDTools: a flexible suite of utilities for comparing genomic features. Bioinformatics 26:841–842. doi: 10.1093/bioinformatics/btq033. [DOI] [PMC free article] [PubMed] [Google Scholar]
- 29.Edgar R, Domrachev M, Lash AE. 2002. Gene Expression Omnibus: NCBI gene expression and hybridization array data repository. Nucleic Acids Res 30:207–210. doi: 10.1093/nar/30.1.207. [DOI] [PMC free article] [PubMed] [Google Scholar]
- 30.Kovalenko A, Chable-Bessia C, Cantarella G, Israël A, Wallach D, Courtois G. 2003. The tumour suppressor CYLD negatively regulates NF-kappaB signalling by deubiquitination. Nature 424:801–805. doi: 10.1038/nature01802. [DOI] [PubMed] [Google Scholar]
- 31.Trompouki E, Hatzivassiliou E, Tsichritzis T, Farmer H, Ashworth A, Mosialos G. 2003. CYLD is a deubiquitinating enzyme that negatively regulates NF-kappaB activation by TNFR family members. Nature 424:793–796. doi: 10.1038/nature01803. [DOI] [PubMed] [Google Scholar]
- 32.Jiang L, Mao P, Song L, Wu J, Huang J, Lin C, Yuan J, Qu L, Cheng S-Y, Li J. 2010. miR-182 as a prognostic marker for glioma progression and patient survival. Am J Pathol 177:29–38. doi: 10.2353/ajpath.2010.090812. [DOI] [PMC free article] [PubMed] [Google Scholar]
- 33.Song L, Liu L, Wu Z, Li Y, Ying Z, Lin C, Wu J, Hu B, Cheng S-Y, Li M, Li J. 2012. TGF-β induces miR-182 to sustain NF-κB activation in glioma subsets. J Clin Invest 122:3563–3578. doi: 10.1172/JCI62339. [DOI] [PMC free article] [PubMed] [Google Scholar]
- 34.Hall A. 1990. The cellular functions of small GTP-binding proteins. Science 249:635–640. doi: 10.1126/science.2116664. [DOI] [PubMed] [Google Scholar]
- 35.Yu S, Lu Z, Liu C, Meng Y, Ma Y, Zhao W, Liu J, Yu J, Chen J. 2010. miRNA-96 suppresses KRAS and functions as a tumor suppressor gene in pancreatic cancer. Cancer Res 70:6015–6025. doi: 10.1158/0008-5472.CAN-09-4531. [DOI] [PubMed] [Google Scholar]
- 36.Dawson CW, Tramountanis G, Eliopoulos AG, Young LS. 2003. Epstein-Barr virus latent membrane protein 1 (LMP1) activates the phosphatidylinositol 3-kinase/Akt pathway to promote cell survival and induce actin filament remodeling. J Biol Chem 278:3694–3704. doi: 10.1074/jbc.M209840200. [DOI] [PubMed] [Google Scholar]
- 37.Mainou BA, Everly DN Jr, Raab-Traub N. 2005. Epstein-Barr virus latent membrane protein 1 CTAR1 mediates rodent and human fibroblast transformation through activation of PI3K. Oncogene 24:6917–6924. doi: 10.1038/sj.onc.1208846. [DOI] [PubMed] [Google Scholar]
- 38.Guo YE, Steitz JA. 2014. Virus meets host microRNA: the destroyer, the booster, the hijacker. Mol Cell Biol 34:3780–3787. doi: 10.1128/MCB.00871-14. [DOI] [PMC free article] [PubMed] [Google Scholar]
- 39.Cazalla D, Yario T, Steitz JA, Steitz J. 2010. Down-regulation of a host microRNA by a herpesvirus saimiri noncoding RNA. Science 328:1563–1566. doi: 10.1126/science.1187197. [DOI] [PMC free article] [PubMed] [Google Scholar]
- 40.Marcinowski L, Tanguy M, Krmpotic A, Rädle B, Lisnić VJ, Tuddenham L, Chane-Woon-Ming B, Ruzsics Z, Erhard F, Benkartek C, Babic M, Zimmer R, Trgovcich J, Koszinowski UH, Jonjic S, Pfeffer S, Dölken L. 2012. Degradation of cellular mir-27 by a novel, highly abundant viral transcript is important for efficient virus replication in vivo. PLoS Pathog 8:e1002510. doi: 10.1371/journal.ppat.1002510. [DOI] [PMC free article] [PubMed] [Google Scholar]
- 41.Guo YE, Riley KJ, Iwasaki A, Steitz JA. 2014. Alternative capture of noncoding RNAs or protein-coding genes by herpesviruses to alter host T cell function. Mol Cell 54:67–79. doi: 10.1016/j.molcel.2014.03.025. [DOI] [PMC free article] [PubMed] [Google Scholar]
- 42.Yin Q, McBride J, Fewell C, Lacey M, Wang X, Lin Z, Cameron J, Flemington EK. 2008. MicroRNA-155 is an Epstein-Barr virus-induced gene that modulates Epstein-Barr virus-regulated gene expression pathways. J Virol 82:5295–5306. doi: 10.1128/JVI.02380-07. [DOI] [PMC free article] [PubMed] [Google Scholar]
- 43.Gatto G, Rossi A, Rossi D, Kroening S, Bonatti S, Mallardo M. 2008. Epstein-Barr virus latent membrane protein 1 trans-activates miR-155 transcription through the NF-kappaB pathway. Nucleic Acids Res 36:6608–6619. doi: 10.1093/nar/gkn666. [DOI] [PMC free article] [PubMed] [Google Scholar]
- 44.Linnstaedt SD, Gottwein E, Skalsky RL, Luftig MA, Cullen BR. 2010. Virally induced cellular microRNA miR-155 plays a key role in B-cell immortalization by Epstein-Barr virus. J Virol 84:11670–11678. doi: 10.1128/JVI.01248-10. [DOI] [PMC free article] [PubMed] [Google Scholar]
- 45.Costinean S, Zanesi N, Pekarsky Y, Tili E, Volinia S, Heerema N, Croce CM. 2006. Pre-B cell proliferation and lymphoblastic leukemia/high-grade lymphoma in E(mu)-miR155 transgenic mice. Proc Natl Acad Sci U S A 103:7024–7029. doi: 10.1073/pnas.0602266103. [DOI] [PMC free article] [PubMed] [Google Scholar]
- 46.Cameron JE, Fewell C, Yin Q, McBride J, Wang X, Lin Z, Flemington EK. 2008. Epstein-Barr virus growth/latency III program alters cellular microRNA expression. Virology 382:257–266. doi: 10.1016/j.virol.2008.09.018. [DOI] [PMC free article] [PubMed] [Google Scholar]
- 47.Shimono Y, Zabala M, Cho RW, Lobo N, Dalerba P, Qian D, Diehn M, Liu H, Panula SP, Chiao E, Dirbas FM, Somlo G, Pera RAR, Lao K, Clarke MF. 2009. Downregulation of miRNA-200c links breast cancer stem cells with normal stem cells. Cell 138:592–603. doi: 10.1016/j.cell.2009.07.011. [DOI] [PMC free article] [PubMed] [Google Scholar]
- 48.Xie L, Ushmorov A, Leithäuser F, Guan H, Steidl C, Färbinger J, Pelzer C, Vogel MJ, Maier HJ, Gascoyne RD, Möller P, Wirth T. 2012. FOXO1 is a tumor suppressor in classical Hodgkin lymphoma. Blood 119:3503–3511. doi: 10.1182/blood-2011-09-381905. [DOI] [PubMed] [Google Scholar]
- 49.Stark TJ, Arnold JD, Spector DH, Yeo GW. 2012. High-resolution profiling and analysis of viral and host small RNAs during human cytomegalovirus infection. J Virol 86:226–235. doi: 10.1128/JVI.05903-11. [DOI] [PMC free article] [PubMed] [Google Scholar]
- 50.Cheng JQ, Lindsley CW, Cheng GZ, Yang H, Nicosia SV. 2005. The Akt/PKB pathway: molecular target for cancer drug discovery. Oncogene 24:7482–7492. doi: 10.1038/sj.onc.1209088. [DOI] [PubMed] [Google Scholar]
- 51.Kaye KM, Izumi KM, Mosialos G, Kieff E. 1995. The Epstein-Barr virus LMP1 cytoplasmic carboxy terminus is essential for B-lymphocyte transformation; fibroblast cocultivation complements a critical function within the terminal 155 residues. J Virol 69:675–683. [DOI] [PMC free article] [PubMed] [Google Scholar]
Associated Data
This section collects any data citations, data availability statements, or supplementary materials included in this article.


