

ABSTRACT
Dengue is one of the main public health concerns worldwide. Recent estimates indicate that over 390 million people are infected annually with the dengue virus (DENV), resulting in thousands of deaths. Among the DENV nonstructural proteins, the NS1 protein is the only one whose function during replication is still unknown. NS1 is a 46- to 55-kDa glycoprotein commonly found as both a membrane-associated homodimer and a soluble hexameric barrel-shaped lipoprotein. Despite its role in the pathogenic process, NS1 is essential for proper RNA accumulation and virus production. In the present study, we identified that glyceraldehyde-3-phosphate dehydrogenase (GAPDH) interacts with intracellular NS1. Molecular docking revealed that this interaction occurs through the hydrophobic protrusion of NS1 and the hydrophobic residues located at the opposite side of the catalytic site. Moreover, addition of purified recombinant NS1 enhanced the glycolytic activity of GAPDH in vitro. Interestingly, we observed that DENV infection promoted the relocalization of GAPDH to the perinuclear region, where NS1 is commonly found. Both DENV infection and expression of NS1 itself resulted in increased GAPDH activity. Our findings indicate that the NS1 protein acts to increase glycolytic flux and, consequently, energy production, which is consistent with the recent finding that DENV induces and requires glycolysis for proper replication. This is the first report to propose that NS1 is an important modulator of cellular energy metabolism. The data presented here provide new insights that may be useful for further drug design and the development of alternative antiviral therapies against DENV.
IMPORTANCE Dengue represents a serious public health problem worldwide and is caused by infection with dengue virus (DENV). Estimates indicate that half of the global population is at risk of infection, with almost 400 million cases occurring per year. The NS1 glycoprotein is found in both the intracellular and the extracellular milieus. Despite the fact that NS1 has been commonly associated with DENV pathogenesis, it plays a pivotal but unknown role in the replication process. In an effort to understand the role of intracellular NS1, we demonstrate that glyceraldehyde-3-phosphate dehydrogenase (GAPDH) interacts with NS1. Our results indicate that NS1 increases the glycolytic activity of GAPDH in vitro. Interestingly, the GAPDH activity was increased during DENV infection, and NS1 expression alone was sufficient to enhance intracellular GAPDH activity in BHK-21 cells. Overall, our findings suggest that NS1 is an important modulator of cellular energy metabolism by increasing glycolytic flux.
INTRODUCTION
Dengue is one of the major health problems in tropical regions. It is estimated that over 390 million people are infected annually with one of the four dengue virus (DENV) serotypes (1). The absence of both an effective tetravalent vaccine and therapeutic agents worsens the impact of the dengue burden. DENV, the most threatening member of the Flaviviridae family, is an enveloped, single-strand, positive-sense RNA virus. It has a 10.7-kb genome, which codes for three structural proteins (C, prM, and E) and seven nonstructural proteins (NS1, NS2a, NS2b, NS3, NS4a, NS4b, and NS5) (2). As with all flaviviruses, the structural and nonstructural proteins compose the virus particle and the replication machinery, respectively.
NS1 is a 46- to 55-kDa glycoprotein commonly found as both a membrane-associated homodimer and a soluble hexameric barrel-shaped lipoprotein (3, 4). The hexameric NS1 protein is detected at variable levels in the serum of infected patients and is therefore used as a target for early dengue diagnosis (5, 6). Secreted NS1 (sNS1) also plays a role in both DENV pathogenesis and protection. It binds several complement components and its regulators, contributing directly to viral immune evasion (7–12). Furthermore, the anti-NS1 antibodies elicited at high titers during infection may form immune complexes with NS1, which trigger the inflammatory response and bind some coagulation elements to deregulate vascular permeability (13, 14). Conversely, active or passive immunization with NS1 promotes the survival of DENV-challenged mice, making it an attractive target for vaccine development (15–17). However, only a few studies have succeeded in determining its function during replication.
A previous report on intracellular NS1 (iNS1) showed that deletion of the NS1 sequence is lethal to the flaviviruses (18). Similarly, mutations in the NS1 sequence, specifically, in the β-roll domain and connector subdomain, impair plaque formation and RNA accumulation, resulting in decreased virus yield (19–22). Nevertheless, complementation with exogenous NS1 allows RNA replication and virus particle production to be recovered in a truncated West Nile virus (WNV) lacking NS1 (23), indicating its importance in the replication process. Electron microscopy studies have demonstrated a close association between NS1 and double-stranded RNA (24, 25), suggesting that NS1 is involved in the early stages of replication, likely by arranging the membrane for replication complex assembly. Despite this structural role, further studies focusing on the function of NS1 during replication are urgently needed.
In the present study, we used a coimmunoprecipitation (co-IP) approach to determine the proteins that interact with iNS1 in an attempt to assess its role in the replication process. We identified the glycolytic enzyme glyceraldehyde-3-phosphate dehydrogenase (GAPDH) to be an iNS1 binding partner. The presence of NS1 increased the glycolytic activity of GAPDH both in vitro and in vivo, indicating that the NS1 protein acts to increase glycolytic flux and, consequently, energy production. As far as we know, this is the first report to propose that iNS1 is an important modulator of cellular energy metabolism.
MATERIALS AND METHODS
Cell culture and infection.
Baby hamster kidney fibroblasts (BHK-21 cells; ATCC, USA) and human umbilical vein endothelial cells (HUVEC-C cells; ATCC) were cultured in alpha minimal essential medium (α-MEM; Gibco, USA) and Ham's F-12K medium (Gibco) supplemented with 0.1 mg/ml heparin (Sigma-Aldrich, USA) and 0.03 to 0.05 mg/ml endothelial cell growth supplement (ECGS; Sigma-Aldrich), respectively. Both media were supplemented with 10% fetal bovine serum (FBS; Invitrogen, USA), 50 units/liter of penicillin (Invitrogen), and 50 μg/liter of streptomycin (Invitrogen). The cells were incubated in a humid chamber at 37°C with 5% CO2. After 2 days, the BHK-21 and HUVEC-C cells were mock infected or infected with DENV serotype 2 (DENV2) strain 16681 at a multiplicity of infection of 2. All experiments were performed at 48 h postinfection.
Transient-transfection assay.
BHK-21 cells were seeded in a 6-well plate at a density of 2 × 10⁵ cells/well and cultured in α-MEM with 10% FBS for 1 day before transient transfection. A mixture containing 2 μg of the empty pcDNA plasmid or the pcDNA-NS1 plasmid (containing the ns1 gene from DENV2 strain 16681), Lipofectamine 2000 (Invitrogen), and Opti-MEM medium (Gibco) was added to the cell culture. After 5 h of incubation, the transfection medium was replaced by fresh α-MEM with 10% FBS, and the culture was maintained for 24 or 48 h in a humid chamber at 37°C with 5% CO2.
Co-IP.
Approximately 5 × 10⁵ HUVEC-C cells were cultured and infected as described above. After 48 h of infection, the medium was removed and the cells were washed twice with 0.01 M phosphate-buffered saline (PBS) prior to detachment using a cell scraper. The suspension was centrifuged at 1,200 × g for 10 min, and the pellet was resuspended in 1 ml of immunoprecipitation (IP) lysis buffer (Pierce, USA) containing protease inhibitors (1 mM phenylmethylsulfonyl fluoride, 0.02 mM pepstatin A, 0.01 mM leupeptin, 0.01 mM aprotinin, 0.01 mM bestatin, 0.02 mM E64), 0.025 mg/ml RNase, and 0.025 mg/ml DNase. The cell extracts were incubated on ice for 15 min, followed by centrifugation at 13,000 × g for 20 min at 4°C. The supernatant was collected, and the proteins were quantified by the micro-bicinchoninic acid method (Pierce, USA). Coimmunoprecipitation (co-IP) was performed as previously described (12). Briefly, approximately 80 μg/column of purified anti-NS1 polyclonal antibody was attached to AminoLink Plus coupling resin (Pierce co-IP kit), followed by equilibration and incubation with 0.8 mg of mock- or DENV2-infected HUVEC-C cell extracts overnight at 4°C. The columns were washed again, and the protein complexes bound to the antibodies were eluted with the elution buffer provided in the co-IP kit.
In-gel digestion.
The elution fractions from three independent co-IP experiments were pooled, and the proteins were precipitated with 100% trichloroacetic acid to a final concentration of 10%. The pelleted proteins were then resuspended in 20 μl of SDS-PAGE loading buffer, and half of this volume was loaded onto a 12% SDS-polyacrylamide gel, followed by Coomassie brilliant blue staining. The sample-containing lane was arbitrarily divided into approximately 2- to 5-mm sections (guided by the molecular mass standards) that were further subjected to in-gel proteolysis with trypsin. First, the gel pieces were destained with 25 mM NH4HCO3 in 50% acetonitrile for 12 h. The slices obtained from the nonreduced gels were then reduced in a 10 mM dithiothreitol (DTT)–25 mM NH4HCO3 solution for 1 h at 56°C and then alkylated with a 55 mM iodoacetamide–25 mM NH4HCO3 solution for 45 min with protection from light. The solution was removed, and the spots were washed with 25 mM NH4HCO3 in 50% acetonitrile and then dehydrated with 100% acetonitrile. Finally, the gel spots were air dried and rehydrated with a solution of NH4HCO3 containing 100 ng of trypsin. The gel spots were digested overnight at 37°C. The tryptic peptides were then collected in 10 μl of a 0.1% trifluoroacetic acid–50% acetonitrile solution.
Nano LC-MS/MS.
The peptides extracted from the one-dimensional SDS-polyacrylamide gel spots were loaded into a Waters Nano-Acquity system (Waters). The peptides were desalted online using a Waters Opti-Pak C18 trap column. The sample injection volume was fixed at 10 μl, and liquid chromatography (LC) was performed using a NanoEase C18 column (150 mm by 75 μm; Waters) with elution (0.4 μl/min) with a linear gradient (10 to 50%) of acetonitrile containing 0.1% formic acid. Electrospray ionization tandem mass spectra were recorded using a Q-Tof quadrupole/orthogonal acceleration time-of-flight spectrometer (Waters) interfaced to the Nano-Acquity system capillary chromatograph. The electrospray ionization voltage was set at 3,500 V using a metal needle, the source temperature was 100°, and the cone voltage was 100 V. Instrument control and data acquisition were conducted by the use of a MassLynx data system (version 4.1; Waters); experiments were performed by scanning from a mass-to-charge ratio (m/z) of 200 to one of 2,000 using a scan time of 1 s, applied during the entire chromatographic process. The mass spectra corresponding to each signal from the total ion current (TIC) chromatogram were averaged. The exact mass was determined automatically by the use of a Q-Tof LockSpray (Waters) and a Q-Tof Ultima API mass spectrometer (Waters). Data-dependent tandem mass spectrometry (MS/MS) acquisitions were performed on precursors with charge states of 2, 3, or 4 over a range of 50 to 2,000 m/z and under a 2-m/z window. For MS/MS, a maximum of three ions was selected from a single MS survey. The Na+ and K+ adduct masses were automatically excluded. Collision-induced dissociation (CID) MS/MS spectra were obtained using argon as the collision gas at a pressure of 13 lb/in2; the collision voltage varied between 18 and 45 V, depending on the mass of the precursor. The scan rate was 1 scan/s. All data were processed using the ProteinLynx Global server (version 2.0; Waters). The processing automatically corrected the m/z scale of both the MS and MS/MS data for the lock mass utilizing the lock spray reference ion. The MS/MS data were also charge state deconvoluted and deisotoped with a maximum entropy algorithm (MaxEnt, version 3; Waters).
Mass spectrometry data analysis.
The proteins were identified by analyzing the tandem mass spectra using MASCOT software (version 2.1; Matrix Science) and the Swiss-Prot database. One missed cleavage per peptide was allowed, and an initial mass tolerance of 0.05 Da was used in all searches. Cysteines were assumed to be carbamidomethylated, and a variable modification of methionine (oxidation) was allowed. Positive identification was considered when at least two peptides matched with a mass accuracy of less than 0.2 Da.
Direct binding enzyme-linked immunosorbent assay (ELISA).
Microtiter plates (MaxSorp; Nunc) were coated with human GAPDH (10 μg/ml; Sigma-Aldrich) or bovine serum albumin (BSA; 10 μg/ml; Sigma-Aldrich) overnight at 4°C. After five washes with PBS, nonspecific binding sites were blocked with 200 μl of 1% BSA in PBS containing 0.05% Tween 20 (PBST) for 1 h at 37°C, followed by five washes with PBST. Specific concentrations of the recombinant NS1 (rNS1) protein in dimeric form, the protocol (protocol IV) for the purification of which was published elsewhere (26), were added to each well, and the plates were incubated for 2 h at 37°C. The plates were then washed five times with PBST, followed by a 1-h incubation with an anti-NS1 polyclonal antibody (produced in a mouse in-house) diluted in PBS. (The Ethics Committee for Animal Use at the Health Science Center of UFRJ approved the protocols for the production of polyclonal antibodies.) After five washes with PBST, anti-mouse IgG conjugated to horseradish peroxidase (Promega, USA) was added for 1 h at 37°C. After five final washes with PBST, the signal was developed by adding 100 μl of 0.4 mg/ml o-phenylenediamine (OPD) and 50 μl of a 9 N sulfuric acid stop solution to each well. The optical density at 490 nm (OD490) was determined by a 96-well plate reader.
Pulldown assay.
A pulldown assay was carried out using approximately 80 μg/column of purified homemade anti-NS1 polyclonal antibody (26) attached to an AminoLink Plus coupling resin (co-IP kit; Pierce, USA). The resin was incubated overnight with 200 μl of a mixture containing 2.5 μM rNS1 protein and 2.5 μM GAPDH (Sigma, USA), 2.5 μM rNS1 protein and 2.5 μM hemopexin (HPX; Millipore, USA), or 2.5 μM rNS1 protein and 1 mg BHK-21 cell extract in buffer containing 50 mM Tris-HCl, pH 7.5, 150 mM NaCl. On the next day, the resin was spun down at 13,000 × g, and the supernatant (named the flowthrough [FT]) was stored to be applied onto an SDS-polyacrylamide gel. The resin was then washed 3 times with 200 μl of the same buffer. The elution of the proteins was carried out upon addition of the elution buffer solution provided by the co-IP kit. The input mixture and elution fractions were analyzed by Western blotting using mouse anti-NS1 and rabbit anti-GAPDH polyclonal antibodies (or mouse anti-hemopexin monoclonal antibody) (Abcam, USA). The control experiments were performed following the same protocol described above, using a control IgG antibody (Sigma-Aldrich, USA) bound to resin and anti-NS1 resin without addition of the rNS1 protein.
Cross-linking assay.
The rNS1 and GAPDH proteins were incubated alone (3 and 6 μg, respectively) or in various mass ratios (1:1, 1:1.3, 1:2, and 1:4) in PBS in the presence or absence of 1 mM EGS [ethylene glycol bis(succinimidyl succinate)] for 30 min at room temperature. The reactions were stopped by adding 30 mM Tris-HCl, pH 8, prior to Western blot analysis.
Western blot assay.
The samples were separated by 12% SDS-PAGE and transferred onto a Hybond enhanced chemiluminexcence nitrocellulose membrane (GE Healthcare, Sweden). The membrane was blocked with 5% nonfat milk diluted in 0.1% Tween 20 in Tris-buffered saline (TBS; 25 mM Tris-HCl, pH 7.6, 3 mM KCl, 140 mM NaCl) (TBST) for 1 h, followed by an overnight incubation with an anti-NS1 polyclonal antibody diluted in blocking solution. The membrane was then washed three times with TBST and incubated with anti-mouse IgG conjugated to horseradish peroxidase (Promega) in blocking solution for 1 h at room temperature. The membrane was washed again, developed with a SuperSignal West Pico kit (Pierce, USA), and exposed to Kodak MXG/Plus film. The stripping for reprobing of the antibody was performed by incubating the membrane twice in a buffer containing 200 mM Glycine and 0.1% SDS, pH 2.2, for 10 min each time. The membrane was then washed twice with both PBS and TBST for 5 min each time. After washing, the membrane was blocked again and incubation of the antibody was performed as described above.
Immunofluorescence staining and confocal microscopy.
Mock- or DENV2-infected BHK-21 cells were cultured on glass coverslips, washed twice in PBS, and fixed for 30 min with freshly prepared 4% formaldehyde solution diluted in PBS. The cells were permeabilized with 0.1% Triton X-100 in PBS for 10 min. The slides were incubated in blocking solution containing 1.5% BSA in PBS and then with purified anti-NS1 mouse polyclonal (26), anti-GAPDH rabbit monoclonal, anti-GAPDH mouse monoclonal or anticalreticulin (calreticulin is an endoplasmic reticulum [ER] marker) rabbit monoclonal antibody (Abcam) that had been diluted in blocking solution for 1 h. The cells were washed and incubated for 45 min with an Alexa Fluor 488-conjugated goat anti-mouse IgG antibody (Invitrogen) or an Alexa Fluor 546-conjugated goat anti-rabbit IgG antibody (Invitrogen) diluted in blocking solution. The cells were subsequently incubated with 5 mM 4′,6-diamidino-2-phenylindole (DAPI; Sigma-Aldrich) for 5 min at room temperature. Cells in ProLong Gold antifade reagent (Life Technologies) were mounted onto the slides and observed using a Leica TCS SP5 confocal microscope. All images were collected with LAS AF Lite (version 2.6) software (Leica Microsystems).
In vitro measurement of GAPDH activity.
To measure the GAPDH activity, 33.4 nM the human GAPDH protein (Sigma-Aldrich) was added to a solution containing 50 mM Tris-HCl, pH 7.4, 2 mM MgCl2, 1 mM ATP, 1 mM EDTA, 0.25 mM β-NADH, and 13 units/ml phosphoglycerate kinase (PGK) in the absence or presence of the rNS1 protein (0.5 or 2 μM) or in the presence of 2 μM BSA. The reactions were started by adding 5 mM 3-phosphoglycerate (PG). The baseline was followed for 3 min for all reactions. The fluorescence intensity was measured on a plate reader (SpectraMax) at excitation and emission wavelengths of 352 and 464 nm, respectively.
In vivo measurement of GAPDH activity.
The measurement of GAPDH activity in cell culture was performed as previously described (27). Briefly, approximately 106 mock- or DENV2-infected or pcDNA- or pcDNA-NS1-transfected BHK-21 cells were lysed by adding 200 μl of IP lysis buffer (Pierce), followed by a 10-min incubation in an ice bath and centrifugation at 17,900 × g for 15 min. Thirty micrograms of the supernatant (cell extract) was added to the reaction mixture, composed of 13 mM sodium pyrophosphate, 26 mM sodium arsenate, 10 mM DTT, 750 μM β-NAD+, and 15 mM d,l-glyceraldehyde-3-phosphate (G3P; Sigma-Aldrich). The reaction was monitored by determination of the change in the absorbance at 340 nm every 10 s for 1 min. The absorbance units were converted into the amount of NADH produced using the molar absorptivity of NADH of 6.22 mM−1 cm−1. One unit of GAPDH activity was defined as the reduction of 1 μM β-NAD+/min.
Molecular modeling.
The three-dimensional (3D) model of the NS1 protein was obtained on the basis of the crystal structure of NS1 from DENV2 strain 16681 (Protein Data Bank [PDB] accession number 4O6B) (21). The predicted 3D model of human GAPDH was obtained by comparative modeling (PDB accession number 1ZNQ). Analyses of the secondary structures were performed with the PSIPRED program (28). Sequence alignment and model building were performed with the MODELLER (version 9) program (29, 30). The models were ranked by MODELLER using the discrete optimized protein energy (DOPE) score, and the Ramachandran plot was prepared by the PROCHECK program (31). Additionally, the root mean square deviation (RMSD) between the models and the template and other analyses were performed with the PyMOL program (PyMOL molecular graphics system, version 1.7.4; Schrödinger, LLC).
Molecular docking.
Molecular docking assays were performed with the web-based server ClusPro (version 2.0) (32–35). The 3D model of DENV2 NS1 was used as the receptor for human GAPDH (O chain; PDB accession number 1ZNQ). The supporting information was rendered using the PyMOL program.
Statistical analysis.
Data sets were compared with a two-tailed, unpaired Student's t test, and statistical significance was achieved when P values were <0.05. Multiple comparisons were performed using one-way or two-way analysis of variance (ANOVA) (Bonferroni posttest), and the asterisks in the figures indicate significant differences from the control.
RESULTS
Identification of GAPDH as a partner interacting with NS1.
To identify the proteins that interact with iNS1, iNS1 was coimmunoprecipitated with its potential ligands from the extracts of DENV2-infected cells of the HUVEC-C cell line, which is an endothelial cell line that is permissive for DENV infection. Extracts of mock-infected HUVEC-C cells were used to identify unspecific interactions (negative control). The material that eluted under both conditions was separated by SDS-PAGE (Fig. 1A), and excised bands were analyzed by Q-Tof MS/MS. The results of MS analysis are shown in Fig. 1B. A distinct m/z peak of 706.395 (corresponding to a charge of +2), identified only under the DENV-infected condition, was selected for peptide sequencing. The identified peptide (GALQNIIPASTGAAK) was analyzed by MASCOT software (using the sequences in the Swiss-Prot database) and corresponded to the glyceraldehyde-3-phosphate dehydrogenase (GAPDH) protein (Fig. 1C).
FIG 1.

Identification of GAPDH as an iNS1-interacting partner. (A) Extracts from mock-infected (Mock) and DENV2-infected (DENV) HUVEC-C cells were added to a column containing immobilized anti-NS1, and the eluted fractions were separated by SDS-PAGE prior to band excision and in-gel digestion. (B) The trypsinized peptides were subjected to Q-Tof MS/MS analysis under both mock infection and DENV infection conditions. MM, molecular mass. (C) The peak corresponding to the most abundant peptide was identified and selected for a second round of MS. The peptide sequence (with z being equal to 2) was then analyzed by use of the Mascot algorithm, using the sequences in the Swiss-Prot database for protein identification. The identified peptide corresponded to a unique fragment of the GAPDH protein, which was confirmed by a search of the NCBI database. The results presented here are representative of those from two independent experiments.
Confirmation of NS1 and GAPDH interaction.
GAPDH is a highly abundant cytoplasmic protein that can also be found in the nucleus or attached to vesicular compartments and the plasma membrane (36). The NS1 protein, in turn, is known to interact with a myriad of intracellular and extracellular proteins (37). To determine whether the interaction between iNS1 and GAPDH was a false-positive result or if a direct interaction occurs, a direct binding ELISA was performed with both purified recombinant NS1 (rNS1) (26) and GAPDH proteins. In this experiment, either GAPDH or BSA (control) was adsorbed onto a plate and incubated with increasing concentrations of the rNS1 protein. The interaction was then detected using an anti-NS1 polyclonal antibody. A significant increase in the OD490 values was measured when NS1 and GAPDH were incubated together (Fig. 2A), and no variation in the OD490 values was detected in the control samples, indicating a real and direct interaction between these two proteins. Additionally, the formation of a complex between rNS1 and GAPDH in solution was also assessed by pulldown assays using purified proteins (Fig. 2B) and extracts from mock- and DENV-infected cells (Fig. 2D). A control using hemopexin, which does not bind NS1, was also carried out to confirm that the pulldown of GADPH did not result from a nonspecific interaction with the column (Fig. 2C).
FIG 2.
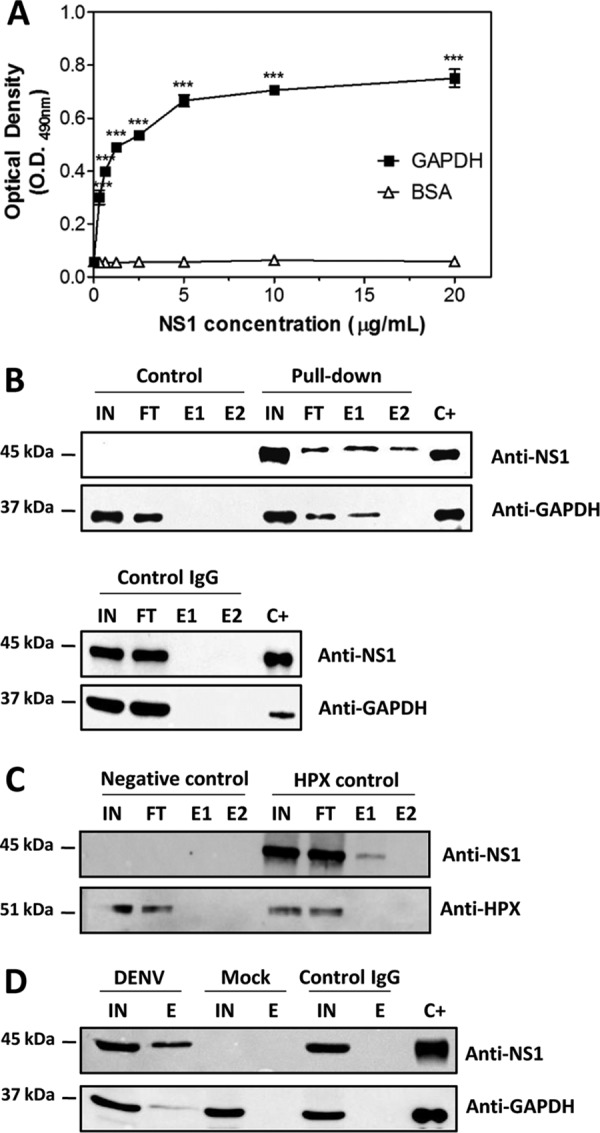
Confirmation of the NS1-GAPDH interaction by direct binding ELISA and a pulldown assay. (A) Microtiter plates were coated with purified GAPDH (10 μg/ml), and increasing amounts of recombinant DENV2 NS1 were added. The bound NS1 was detected using an anti-NS1 polyclonal antibody. BSA was used as a negative control. The error bars indicate the standard deviations from three independent experiments, and the asterisks indicate significant differences from the control using two-way ANOVA and the Bonferroni posttest. ***, P < 0.001. (B) For the pulldown assay, the rNS1 and GAPDH proteins at a concentration of 2.5 μM each were incubated overnight at 4°C with anti-NS1 polyclonal antibody covalently coupled to an amino-linked agarose resin. Elution was carried out with the elution buffer provided in the co-IP kit (Pierce). The control reaction was carried out following the same protocol described above, except that only GAPDH was incubated with the resin. The same procedure was performed using control IgG coupled to an amino-linked agarose resin. (C) As described in the legend to panel B, except that the GAPDH protein was replaced by the HPX protein, which does not interact with NS1. (D) Pulldown assay using extracts of mock- and DENV2-infected BHK-21 cells. IN, input; FT, flowthrough; E1 and E2, 1st and 2nd elution fractions, respectively; C+, positive control (rNS1 and GAPDH). The results presented here are representative of those from three independent experiments.
A third experiment was carried out to confirm the interaction between the NS1 and GAPDH proteins. A cross-linking assay was performed in which different concentrations of GAPDH and rNS1 were incubated in the presence or absence of a cross-linking agent, EGS, followed by Western blot analysis with anti-GAPDH and anti-NS1 antibodies. As expected, bands at approximately 40 kDa and greater than 118 kDa were observed when GAPDH was incubated in the absence and presence of EGS, respectively, with these bands indicating the monomer and tetramer, respectively (Fig. 3A). Interestingly, when GAPDH was incubated with rNS1 at different ratios in the presence of the cross-linking agent, two additional bands were observed at approximately 70 kDa and 80 kDa (Fig. 3A). To ascertain whether these bands represent the direct interaction between NS1 and GAPDH, the membrane was stripped and reprobed with an anti-NS1 antibody. Two bands were observed at approximately 45 kDa and 38 kDa when the rNS1 protein was incubated in the absence of EGS, and both of these bands correspond to monomers (Fig. 3B), which is in accord with the findings of our previous study (26). In the presence of EGS, these bands shifted to higher molecular masses, appearing as bands of 45 kDa, 90 kDa, and greater than 118 kDa that corresponded to the monomer, the dimer, and a possible tetramer, respectively (Fig. 3B). When both proteins were incubated in the presence of EGS, two additional bands were observed at approximately 70 kDa and 80 kDa (Fig. 3B); these are similar to the bands observed in Fig. 3A. The molecular masses of these bands corresponded to either the 38-kDa monomer with the GAPDH monomer or the 45-kDa NS1 monomer with the GAPDH monomer, respectively. Together, these results demonstrate that NS1 and GAPDH directly interact.
FIG 3.
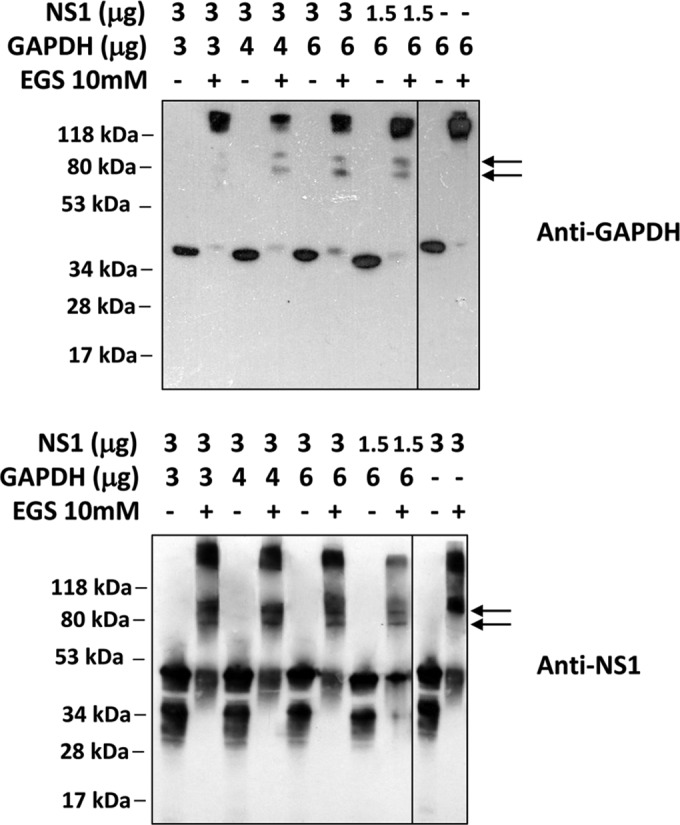
Confirmation of the NS1-GAPDH interaction by a cross-linking assay using the cross-linking reagent EGS. Different amounts of the rNS1 (1.5 or 3 μg) and GAPDH (3, 4, or 6 μg) proteins were incubated in the absence or presence of 10 mM EGS. The samples were incubated for 30 min at room temperature prior to analysis by Western blotting using anti-GAPDH (A) or anti-NS1 (B) antibodies. As a control, both GAPDH (6 μg) and rNS1 (3 μg) were incubated alone in either the absence or the presence of 10 mM EGS, followed by Western blot analysis with their respective antibodies. The results presented here are representative of those from two independent experiments.
DENV2 NS1 modeling and molecular docking of the NS1-GAPDH interaction.
To identify the molecular contact surfaces with which NS1 and GAPDH interact, a three-dimensional dimeric NS1 model was constructed on the basis of the atomic coordinates of the crystal structure described by Akey and coworkers (21) that is deposited in the Protein Data Bank (PDB accession number 4O6B). The sequence alignment between DENV2 NS1 from PDB and the DENV2 NS1 sequence used in this work revealed an identity of 97.35% (data not shown). The dimeric NS1 model was generated using Modeler Align2d software, which was set to construct 100 candidate models. The best model showed an RMSD of 0.425 Å and a DOPE score of −69,659.352. The Ramachandran plot showed that 89% of the residues were in the most favored region, 9.4% were in additional allowed regions, 1.6% were in generously allowed regions, and no residues were in disallowed regions (data not shown).
To perform the molecular docking, ClusPro (version 2.0) software was used and was set to consider the NS1 model as the system's receptor and GAPDH (PDB accession number 1ZNQ) as the ligand. To determine if the GAPDH monomer and tetramer interact similarly with dimeric NS1, both the complete GAPDH structure (tetramer) and the O chain alone (the monomer, according to the PDB model) were probed. All systems showed a strong tendency to occur (Table 1), indicating that both monomeric GAPDH and tetrameric GAPDH are able to interact with NS1. Interestingly, the interface of the interaction was similar in both systems (Fig. 4A and B), occurring at the hydrophobic protrusion of NS1 (Fig. 4C and D), located at the β-roll domain (21), and at the hydrophobic residues of GAPDH. The amino acid residues of NS1 involved in the surface contact with the GAPDH structure are Cys4, Val5, Val6, Asn10, Lys11, Leu13, Lys14, Cys15, and Trp28 of one monomer and Gly3, Cys4, Val5, Glu12, Leu13, Lys14, Cys15, Gly161, Val162, Phe163, and Thr164 of the other monomer (Fig. 4C and D). As GAPDH has two important catalytic residues, cysteine 152 (Cys152) and histidine 179 (His179) (38), these were also highlighted (in green) to evaluate whether the interaction may affect this region. It was observed that NS1 interacted on the opposite side of the GAPDH catalytic site (Fig. 4A and B), suggesting that if NS1 affects GAPDH activity, it is not because the catalytic site is blocked.
TABLE 1.
Scores for NS1, NS1mut, and GAPDH docking
| System | Cluster no. | No. of representatives | Balanced score |
|
|---|---|---|---|---|
| Center | Lowest energy | |||
| DENV2 NS1 + GAPDH monomer | 0 | 84 | −938.2 | −1,068.5 |
| DENV2 NS1 + GAPDH tetramer | 0 | 34 | −832.9 | −941.2 |
| DENV2 NS1mut + GAPDH monomer | 1 | 69 | −895.4 | −1,024.6 |
FIG 4.

Molecular docking of NS1 and GAPDH. The constructed model of dimeric DENV2 NS1 (blue) was used as the system's ligand, and both the GAPDH monomer (pink) (A) and the GAPDH tetramer (B) were set as the receptors. GAPDH catalytic residues Cys152 and His179 are marked in green. In both cases, the interaction interface was the same and did not obscure the GAPDH catalytic site. (C) Expanded view of the contact surface region between dimeric NS1 and GAPDH (shown in panel A) in which the amino acid residues of NS1 involved in the contact are shown in orange. (D) The same view as that in panel C, except that the dimeric NS1 structure is rotated 90° clockwise and the GAPDH structure is not represented for clarity. (E) Three-dimensional model of dimeric DENV2 NS1mut (Asn10Ala, Lys11Ala, Gly161Asp, and Val162Asp), represented in blue, interacting with the monomeric state of GAPDH (orange). The structure of GADPH (pink) is in the same orientation as that which occurs when it interacts with wild-type NS1. The mutated residues are colored in green. (F) The same view as that in panel E with the structure rotated 90° counterclockwise and with deletion of the NS1mut protein for clarity. Docking structures were generated by the web-based server ClusPro (version 2.0) and displayed with PyMOL.
Mutations at residues Asn10 and Lys11 (located at the NS1 β-roll domain) and in the region of Gly159-Phe-Gly-Val162 (connector subdomain) were previously found to be associated with defective flavivirus replication (20–22). To evaluate the importance of the β-roll domain for complex formation between NS1 and GAPDH, a three-dimensional model of dimeric NS1 containing the mutations Asn10Ala, Lys11Ala, Gly161Asp, and Val162Asp (NS1mut) was constructed as described above, and NS1mut was used as the system's receptor and GAPDH (O chain) was used as the ligand. The sequence alignment between DENV2 NS1 from PDB and DENV2 NS1mut revealed an identity of 97.0%. The best model showed an RMSD of 0.547 Å and a DOPE score of −68,963.289. The Ramachandran plot showed that 89.6% of the residues were in the most favored region, 8.1% were in additional allowed regions, 2.3% were in generously allowed regions, and no residues were in disallowed regions (data not shown). The molecular docking revealed that this system still has a strong tendency to occur, albeit the tendency is less strong than that observed when wild-type NS1 is used as the system's receptor (Table 1). Interestingly, NS1mut interacts with the same hydrophobic residues of GAPDH; however, the GAPDH orientation was significantly altered (Fig. 4E and F). These results indicate that the Asn10, Lys11, Gly161, and Val162 residues are not essential to the interaction with GAPDH but they are important for the correct GAPDH orientation. Unfortunately, the conformational effects of this association could not be determined.
Effect of the NS1 protein on GAPDH glycolytic activity in vitro.
To evaluate the influence of the NS1-GAPDH interaction on GAPDH glycolytic activity, an in vitro enzymatic assay was performed using both purified rNS1 and GAPDH proteins. GAPDH catalyzes a reversible oxidoreductase reaction in which glyceraldehyde-3-phosphate (G3P) is converted into 1,3-biphosphoglycerate (1,3-BPG) in the presence of nicotinamide ADP (NAD+) and inorganic phosphate (Pi), with the release of NADH. Thus, the GAPDH activity was measured by adding the GAPDH protein alone, in the presence of the rNS1 protein, or in the presence of BSA (negative control) to a reaction mixture containing β-NADH, ATP, phosphoglycerate kinase (PGK), and phosphoglycerate (PG). β-NAD+ production was monitored by determination of the decrease of its fluorescence intensity. The oxidation of the β-NADH molecules was observed to be more rapid in experiments with 0.5 μM or 2 μM rNS1 than in experiments without rNS1 or with 2 μM BSA (Fig. 5A). The relative fluorescence intensity curves were then converted into the percentage of GAPDH activity. The presence of either 0.5 μM or 2 μM rNS1 significantly increased GAPDH activity (P < 0.05 and P < 0.001, respectively, Fig. 5B). These results suggest that the NS1 protein increases the GAPDH glycolytic activity.
FIG 5.
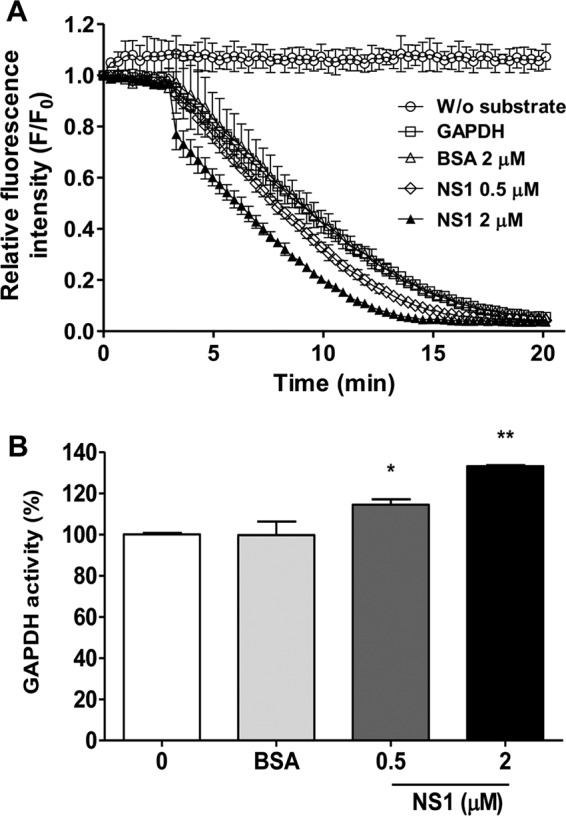
Effects of NS1 binding on GAPDH activity. Different amounts of NS1 (0.5 or 2 μM) were used to evaluate the effect of NS1 binding on human GAPDH activity. The negative control was performed with 2 μM BSA. (A) GAPDH activity is represented as the decrease of the relative fluorescence intensity of NADH after its conversion to NAD+. The data were obtained in three independent experiments, and the bars indicate the standard errors. F/F0 is the relative fluorescence intensity, in which F0 and F correspond to the fluorescence intensity at the initial time point and each different time point, respectively. Measurements were performed without (W/o) substrate (circles), without NS1 (squares), and in the presence of 2 μM BSA (triangles), 0.5 μM NS1 (diamonds), or 2 μM NS1 (solid triangles). The reaction mixtures were incubated at 25°C for 20 min with 50 mM Tris-HCl (pH 7.4), 2 mM MgCl2, 1 mM ATP, 1 mM EDTA, 0.25 mM β-NADH, 13 units/ml PGK, 33 0.4 nM human GAPDH, and 5 mM 3-phosphoglycerate. (B) The data in panel A were converted to percentages using a representative time point of each reaction (10 min) to better show the increase in GAPDH activity as a function of the NS1 concentration. The data were analyzed for statistically significant differences using a two-tailed, unpaired Student's t test. *, P < 0.05; **, P < 0.01.
Colocalization of GAPDH and NS1 during DENV infection.
As iNS1 is primarily found in the perinuclear region and GAPDH is primarily found in the cytoplasm, it was important to investigate whether both proteins colocalize during DENV infection. Thus, an immunofluorescence assay was performed in which mock- or DENV2-infected BHK-21 cells and BHK-21 cells transfected with either the empty pcDNA plasmid or the pcDNA-NS1 plasmid, which contains the ns1 gene from DENV2 strain 16681, were labeled with both anti-NS1 and anti-GAPDH antibodies. As expected, NS1 labeling was observed only in DENV2-infected cells, with the labeling primarily appearing in the perinuclear region, and in the cells transfected with the pcDNA-NS1 plasmid, where NS1 staining was more diffuse in the cytoplasm, whereas the presence of GAPDH was detected under all conditions (Fig. 6). Interestingly, GAPDH labeling was diffuse in the mock-infected cells and in the cells transfected with either the pcDNA or pcDNA-NS1 plasmid, confirming its presence throughout the cytoplasm. In contrast, GAPDH was found to be more localized at the perinuclear region in DENV2-infected cells, as observed by ER labeling (Fig. 6), suggesting that DENV2 infection but not NS1 overexpression alone promoted the relocalization of GAPDH. After merging the images, we observed that NS1 and GAPDH strongly colocalized in the perinuclear region of DENV2-infected cells. These results suggest that NS1 and GAPDH colocalize in vivo and that DENV2 infection, but not NS1 alone, is able to promote the perinuclear localization of GAPDH.
FIG 6.

Colocalization of iNS1, GAPDH, and calreticulin proteins visualized by confocal microscopy. Mock- or DENV2-infected BHK-21 cells and BHK-21 cells transfected with pcDNA3.1 or pcDNA3.1-NS1 were cultivated for 48 h prior to immunofluorescence analysis. The cells were fixed in formaldehyde prior to permeabilization with Triton X-100. After blocking, the cells were labeled with anti-GAPDH rabbit monoclonal (red stain), anti-GAPDH mouse monoclonal (green stain), anti-NS1 mouse polyclonal (green stain), and anticalreticulin rabbit monoclonal (calreticulin is an ER marker; red stain) antibodies. DAPI labeling was used to identify the nuclei. In the merged images, the yellow staining corresponds to the sites of iNS1 and GAPDH or GAPDH and calreticulin colocalization. All images are representative of those from three independent experiments. For better visualization, the cells identified by a white arrowhead were enlarged, and the images are displayed as insets. Bars, 20 μm.
Both DENV infection and NS1 overexpression increase GAPDH glycolytic activity.
On the basis of the results presented above, it was important to investigate whether GAPDH activity is increased in DENV2-infected cells. The cytosolic fractions of the cellular extract from mock- or DENV2-infected BHK-21 cells were used to analyze intracellular GAPDH activity. After 24 h of infection, β-NADH production was significantly increased in DENV2-infected cells compared with that in the mock-infected cells (Fig. 7A; P < 0.05). However, after 48 h of infection, the levels of β-NADH production were similar under both conditions (Fig. 7B). The level of β-NADH production was then converted into GAPDH activity, revealing a significant increase in GAPDH activity after 24 h of DENV2 infection (Fig. 7C).
FIG 7.

Measurement of intracellular GAPDH activity. The kinetics of intracellular GAPDH activity were monitored by determination of the increase in absorbance at 340 nm every 10 s for 60 s, using 30 μg of the cell extract as the source of the enzyme. The conversion of absorbance units to NADH production was done by use of the molar absorptivity of NADH (6.22 mM−1 cm−1). Mock- or DENV2-infected and pcDNA- or pcDNA-NS1-transfected BHK-21 cells were cultivated for 24 h (A and D, respectively) or 48 h (B and E, respectively) prior to analyzing the enzyme activity. At the end of the curve, the concentration of NADH was converted into GAPDH activity, where 1 unit of enzyme activity corresponds to the reduction of 1 μM β-NAD/min. The GAPDH activity was determined for both the infected (C) and the transfected (F) BHK-21 cells. The data were analyzed for statistically significant differences using a two-tailed, unpaired Student's t test. *, P < 0.05. (G to J) The levels of NS1 and GAPDH expression from the transfected (G and I) or infected (H and J) BHK-21 cells were determined by Western blotting (WB) using an anti-NS1 antibody. Approximately 30 μg of the cell extract from each condition was used to determine iNS1 expression, and 15 μl of the culture supernatant was used to determine sNS1 levels in the transfected cells. The loading control for the Western blot assay was anti-β-actin. The Western blots are representative of those from three independent experiments, and the error bars indicate the standard deviations from three independent experiments.
The direct influence of NS1 on GAPDH activity was evaluated by measuring the enzymatic activity in BHK-21 cells transfected with either the empty pcDNA plasmid or the pcDNA-NS1 plasmid. An increase in the level of β-NADH production was measured in the NS1-expressing cells at 24 h (Fig. 7D) and 48 h (Fig. 7E) after transfection. GAPDH activity was increased in the NS1-expressing cells at both time points, but it was statistically significantly increased only after 24 h of expression (Fig. 7F). These results indicate that both DENV2 and NS1 expression increase GAPDH activity.
The expression of the NS1 protein was also analyzed in the transfected and infected BHK-21 cells to correlate NS1 production with the increased GAPDH activity. It was observed that iNS1 expression was higher in the first 24 h after transfection. However, at 48 h after transfection, the levels of iNS1 decreased concomitantly with the increased sNS1 levels (Fig. 7G), indicating that iNS1 modulated the glycolytic GAPDH activity in a concentration-dependent manner. However, we did not observe any differences in iNS1 levels over the course of the DENV2 infection (Fig. 7H). No differences in GAPDH expression levels were observed under any of the conditions analyzed when the levels were compared with the level of the actin loading control (Fig. 7I and J), indicating that the increased GAPDH activity is not due to increased protein expression. Together, these results suggest that NS1 is an important modulator of GAPDH activity.
DISCUSSION
Although iNS1 is essential for the proper assembly of flaviviruses, there are still no consistent data regarding its role during the replication process. Most studies have focused on the extracellular interactions of the NS1 protein to explain its involvement in DENV pathogenesis (10–12). Here, we propose that iNS1 increases glycolytic flux and, consequently, energy production by increasing GAPDH glycolytic activity. We demonstrated by co-IP followed by mass spectrometry that GAPDH interacts with intracellular NS1, and we confirmed the interaction by direct binding ELISA, co-IP (i.e., a pulldown assay), and cross-linking assays. GAPDH is well-known to be a multifunctional protein that is involved in different cellular processes, such as transcriptional and posttranscriptional gene regulation, vesicular trafficking, maintenance of DNA integrity, and others (39). It also plays an essential role in cellular energy metabolism, participating in the sixth step of glycolysis. The GAPDH protein catalyzes the reversible conversion of G3P into 1,3-BPG in the presence of NAD+ and Pi, generating one energy-rich NADH molecule per G3P unit, which is further used in the mitochondrial electron transport chain to generate ATP.
The reaction catalyzed by GAPDH starts with the production of a thiohemiacetal intermediate at the Cys152 residue, followed by the formation of a high-energy thioester that is then attacked by Pi to generate BPG. After thioester formation, a hydride is transferred to an NAD+ molecule with the aid of the His179 residue, which acts as a base catalyst (38). The molecular docking results suggest that the NS1-GAPDH interaction occurs through hydrophobic protrusions in the NS1 β-roll domain and the hydrophobic residues of GAPDH, located on the opposite side of the catalytic site. This finding is interesting because the β-roll domain is responsible for the NS1 interaction with the ER membrane (21). Mutations in this region impair virus replication, either by affecting the NS1 interaction with NS4b or by preventing NS1 retention in the ER lumen (20–22). Indeed, mutation of the Asn10, Lys11, Gly161, and Val162 residues, located at the β-roll domain and connector subdomain, decreased the tendency for the interaction to occur without abolishing it. Although the interface of the interaction was not affected, the GAPDH orientation changed considerably. Therefore, it is plausible to presume that the interactions mediated by this domain have important impacts on the replication of flaviviruses.
As obligatory parasites, viruses rely on the host metabolism to obtain the constituents needed to generate their progeny. Energy production modulation is a remarkable feature that improves the ATP supply required to support active viral replication and assembly. Glycolysis is a common metabolic route explored by viruses to enhance the production of energy-rich molecules. Mayaro virus and herpes simplex virus 1 (HSV-1), for example, enhance glucose uptake and glycolytic flux by modulating the rate-limiting glycolytic enzyme 6-phosphofructo-1-kinase (PFK-1) (40, 41). Hepatitis C virus (HCV), in turn, enhances glucose consumption and glycolytic flux through the interaction of viral NS5A with hexokinase 2 (HK2), the first rate-limiting enzyme of glycolysis (42). In this regard, we observed here that purified rNS1 increased β-NAD+ production and, consequently, GAPDH activity in vitro.
DENV infection induces mitochondrial alterations that result in decreased ATP production. It was hypothesized that DENV compensates for this loss by increasing glycolytic flux (43). Indeed, a recent report showed that DENV activates glycolysis to provide an energy source to support proper viral replication. Glucose deprivation or pharmacological inhibition of glycolysis disrupts DENV replication and virion production (44). Our results indicate that DENV alters subcellular GAPDH localization and increases the intracellular GAPDH activity only in the first 24 h of infection. This is in accord with the data of Fontaine and colleagues, who showed increased levels of glycolytic metabolites, mainly dihydroxyacetone phosphate and GAPDH downstream metabolites, early in DENV infection (44). It is expected that the establishment of a successful infection relies on the ability of DENV to modulate the metabolism of the entire host to its own purposes. Recurrent replication and protein synthesis require an increased and rapid energy supply. The modulation of glycolysis is usually the most attractive alternative, because glycolysis is almost exclusively dependent on glucose uptake. Therefore, the simplest mechanism for its regulation is to activate or increase the activity of rate-limiting enzymes. In fact, DENV infection upregulates glucose transporter 1 and HK2 (44). Although GAPDH is not classically defined as a rate-limiting enzyme, recent reports have identified it to be a bottleneck in the aerobic glycolysis process because it can be regulated by important glycolytic intermediates, such as ATP and NAD+ (45). Together, our finding that DENV infection increases GAPDH activity shows that increased GAPDH activity represents an additional mechanism used by this virus to enhance glycolysis and thereby establish a successful infection.
Considering the importance of GAPDH to glycolysis, that dimeric rNS1 increased GAPDH activity in vitro, and that NS1 expression was sufficient to enhance intracellular GAPDH activity in a concentration-dependent manner, the results reported here represent the first evidence of a metabolic modulator role for iNS1. Thus, we hypothesize that NS1 is responsible for modulating the host metabolism by increasing GAPDH glycolytic activity during the early steps of infection. In conclusion, this report not only represents a gain of knowledge about the role of the NS1 protein during flavivirus replication but also provides new insights and a platform for further drug design and alternative antiviral therapies for DENV infection.
ACKNOWLEDGMENTS
We thank the following Brazilian funding agencies for financial support: INCT-INBEB, CAPES, CNPq, and FAPERJ.
REFERENCES
- 1.Bhatt S, Gething PW, Brady OJ, Messina JP, Farlow AW, Moyes CL, Drake JM, Brownstein JS, Hoen AG, Sankoh O, Myers MF, George DB, Jaenisch T, Wint GRW, Simmons CP, Scott TW, Farrar JJ, Hay SI. 2013. The global distribution and burden of dengue. Nature 496:504–507. doi: 10.1038/nature12060. [DOI] [PMC free article] [PubMed] [Google Scholar]
- 2.Whitehead SS, Blaney JE, Durbin AP, Murphy BR. 2007. Prospects for a dengue virus vaccine. Nat Rev Microbiol 5:518–528. doi: 10.1038/nrmicro1690. [DOI] [PubMed] [Google Scholar]
- 3.Gutsche I, Coulibaly F, Voss JE, Salmon J, d'Alayer J, Ermonval M, Larquet E, Charneau P, Krey T, Megret F, Guittet E, Rey FA, Flamand M. 2011. Secreted dengue virus nonstructural protein NS1 is an atypical barrel-shaped high-density lipoprotein. Proc Natl Acad Sci U S A 108:8003–8008. doi: 10.1073/pnas.1017338108. [DOI] [PMC free article] [PubMed] [Google Scholar]
- 4.Muller DA, Landsberg MJ, Bletchly C, Rothnagel R, Waddington L, Hankamer B, Young PR. 2012. Structure of the dengue virus glycoprotein non-structural protein 1 by electron microscopy and single-particle analysis. J Gen Virol 93:771–779. doi: 10.1099/vir.0.039321-0. [DOI] [PubMed] [Google Scholar]
- 5.Alcon S, Talarmin A, Debruyne M, Falconar A, Deubel V, Flamand M. 2002. Enzyme-linked immunosorbent assay specific to dengue virus type 1 nonstructural protein NS1 reveals circulation of the antigen in the blood during the acute phase of disease in patients experiencing primary or secondary infections. J Clin Microbiol 40:376–381. doi: 10.1128/JCM.40.02.376-381.2002. [DOI] [PMC free article] [PubMed] [Google Scholar]
- 6.Allonso D, Meneses MDF, Fernandes CA, Ferreira DF, Mohana-Borges R. 2014. Assessing positivity and circulating levels of NS1 in samples from a 2012 dengue outbreak in Rio de Janeiro, Brazil. PLoS One 9:e113634. doi: 10.1371/journal.pone.0113634. [DOI] [PMC free article] [PubMed] [Google Scholar]
- 7.Avirutnan P, Punyadee N, Noisakran S, Komoltri C, Thiemmeca S, Auethavornanan K, Jairungsri A, Kanlaya R, Tangthawornchaikul N, Puttikhunt C, Pattanakitsakul S-N, Yenchitsomanus P-T, Mongkolsapaya J, Kasinrerk W, Sittisombut N, Husmann M, Blettner M, Vasanawathana S, Bhakdi S, Malasit P. 2006. Vascular leakage in severe dengue virus infections: a potential role for the nonstructural viral protein NS1 and complement. J Infect Dis 193:1078–1088. doi: 10.1086/500949. [DOI] [PubMed] [Google Scholar]
- 8.Chung KM, Liszewski MK, Nybakken G, Davis AE, Townsend RR, Fremont DH, Atkinson JP, Diamond MS. 2006. West Nile virus nonstructural protein NS1 inhibits complement activation by binding the regulatory protein factor H. Proc Natl Acad Sci U S A 103:19111–19116. doi: 10.1073/pnas.0605668103. [DOI] [PMC free article] [PubMed] [Google Scholar]
- 9.Kurosu T, Chaichana P, Yamate M, Anantapreecha S, Ikuta K. 2007. Secreted complement regulatory protein clusterin interacts with dengue virus nonstructural protein 1. Biochem Biophys Res Commun 362:1051–1056. doi: 10.1016/j.bbrc.2007.08.137. [DOI] [PubMed] [Google Scholar]
- 10.Avirutnan P, Hauhart RE, Somnuke P, Blom AM, Diamond MS, Atkinson JP. 2011. Binding of flavivirus nonstructural protein NS1 to C4b binding protein modulates complement activation. J Immunol 187:424–433. doi: 10.4049/jimmunol.1100750. [DOI] [PMC free article] [PubMed] [Google Scholar]
- 11.Avirutnan P, Fuchs A, Hauhart RE, Somnuke P, Youn S, Diamond MS, Atkinson JP. 2010. Antagonism of the complement component C4 by flavivirus nonstructural protein NS1. J Exp Med 207:793–806. doi: 10.1084/jem.20092545. [DOI] [PMC free article] [PubMed] [Google Scholar]
- 12.Silva EM, Conde JN, Allonso D, Nogueira ML, Mohana-Borges R. 2013. Mapping the interactions of dengue virus NS1 protein with human liver proteins using a yeast two-hybrid system: identification of C1q as an interacting partner. PLoS One 8:e57514. doi: 10.1371/journal.pone.0057514. [DOI] [PMC free article] [PubMed] [Google Scholar]
- 13.Falconar AK. 1997. The dengue virus nonstructural-1 protein (NS1) generates antibodies to common epitopes on human blood clotting, integrin/adhesin proteins and binds to human endothelial cells: potential implications in haemorrhagic fever pathogenesis. Arch Virol 142:897–916. doi: 10.1007/s007050050127. [DOI] [PubMed] [Google Scholar]
- 14.Falconar AKI. 2007. Antibody responses are generated to immunodominant ELK/KLE-type motifs on the nonstructural-1 glycoprotein during live dengue virus infections in mice and humans: implications for diagnosis, pathogenesis, and vaccine design. Clin Vaccine Immunol 14:493–504. doi: 10.1128/CVI.00371-06. [DOI] [PMC free article] [PubMed] [Google Scholar]
- 15.Schlesinger JJ, Brandriss MW, Walsh EE. 1987. Protection of mice against dengue 2 virus encephalitis by immunization with the dengue 2 virus non-structural glycoprotein NS1. J Gen Virol 68(Pt 3):853–857. doi: 10.1099/0022-1317-68-3-853. [DOI] [PubMed] [Google Scholar]
- 16.Costa SM, Freire MS, Alves AMB. 2006. DNA vaccine against the non-structural 1 protein (NS1) of dengue 2 virus. Vaccine 24:4562–4564. doi: 10.1016/j.vaccine.2005.08.022. [DOI] [PubMed] [Google Scholar]
- 17.Wu S-F, Liao C-L, Lin Y-L, Yeh C-T, Chen L-K, Huang Y-F, Chou H-Y, Huang J-L, Shaio M-F, Sytwu H-K. 2003. Evaluation of protective efficacy and immune mechanisms of using a non-structural protein NS1 in DNA vaccine against dengue 2 virus in mice. Vaccine 21:3919–3929. doi: 10.1016/S0264-410X(03)00310-4. [DOI] [PubMed] [Google Scholar]
- 18.Lindenbach BD, Rice CM. 1997. trans-Complementation of yellow fever virus NS1 reveals a role in early RNA replication. J Virol 71:9608–9617. [DOI] [PMC free article] [PubMed] [Google Scholar]
- 19.Muylaert IR, Chambers TJ, Galler R, Rice CM. 1996. Mutagenesis of the N-linked glycosylation sites of the yellow fever virus NS1 protein: effects on virus replication and mouse neurovirulence. Virology 222:159–168. doi: 10.1006/viro.1996.0406. [DOI] [PubMed] [Google Scholar]
- 20.Youn S, Li T, McCune BT, Edeling MA, Fremont DH, Cristea IM, Diamond MS. 2012. Evidence for a genetic and physical interaction between nonstructural proteins NS1 and NS4B that modulates replication of West Nile virus. J Virol 86:7360–7371. doi: 10.1128/JVI.00157-12. [DOI] [PMC free article] [PubMed] [Google Scholar]
- 21.Akey DL, Brown WC, Dutta S, Konwerski J, Jose J, Jurkiw TJ, DelProposto J, Ogata CM, Skiniotis G, Kuhn RJ, Smith JL. 2014. Flavivirus NS1 structures reveal surfaces for associations with membranes and the immune system. Science 343:881–885. doi: 10.1126/science.1247749. [DOI] [PMC free article] [PubMed] [Google Scholar]
- 22.Akey DL, Brown WC, Jose J, Kuhn RJ, Smith JL. 2015. Structure-guided insights on the role of NS1 in flavivirus infection. Bioessays 37:489–494. doi: 10.1002/bies.201400182. [DOI] [PMC free article] [PubMed] [Google Scholar]
- 23.Young LB, Melian EB, Khromykh AA. 2013. NS1′ colocalizes with NS1 and can substitute for NS1 in West Nile virus replication. J Virol 87:9384–9390. doi: 10.1128/JVI.01101-13. [DOI] [PMC free article] [PubMed] [Google Scholar]
- 24.Mackenzie JM, Jones MK, Young PR. 1996. Immunolocalization of the dengue virus nonstructural glycoprotein NS1 suggests a role in viral RNA replication. Virology 220:232–240. doi: 10.1006/viro.1996.0307. [DOI] [PubMed] [Google Scholar]
- 25.Westaway EG, Mackenzie JM, Kenney MT, Jones MK, Khromykh AA. 1997. Ultrastructure of Kunjin virus-infected cells: colocalization of NS1 and NS3 with double-stranded RNA, and of NS2B with NS3, in virus-induced membrane structures. J Virol 71:6650–6661. [DOI] [PMC free article] [PubMed] [Google Scholar]
- 26.Allonso D, da Silva Rosa M, Coelho DR, da Costa SM, Nogueira RMR, Bozza FA, Santos FBD, de Barcelos Alves AM, Mohana-Borges R. 2011. Polyclonal antibodies against properly folded dengue virus NS1 protein expressed in E. coli enable sensitive and early dengue diagnosis. J Virol Methods 175:109–116. doi: 10.1016/j.jviromet.2011.04.029. [DOI] [PubMed] [Google Scholar]
- 27.Hwang NR, Yim S-H, Kim YM, Jeong J, Song EJ, Lee Y, Lee JH, Choi S, Lee K-J. 2009. Oxidative modifications of glyceraldehyde-3-phosphate dehydrogenase play a key role in its multiple cellular functions. Biochem J 423:253–264. doi: 10.1042/BJ20090854. [DOI] [PubMed] [Google Scholar]
- 28.McGuffin LJ, Bryson K, Jones DT. 2000. The PSIPRED protein structure prediction server. Bioinformatics 16:404–405. doi: 10.1093/bioinformatics/16.4.404. [DOI] [PubMed] [Google Scholar]
- 29.Sali A, Blundell TL. 1993. Comparative protein modelling by satisfaction of spatial restraints. J Mol Biol 234:779–815. doi: 10.1006/jmbi.1993.1626. [DOI] [PubMed] [Google Scholar]
- 30.Eswar N, Eramian D, Webb B, Shen M-Y, Sali A. 2008. Protein structure modeling with MODELLER. Methods Mol Biol 426:145–159. doi: 10.1007/978-1-60327-058-8_8. [DOI] [PubMed] [Google Scholar]
- 31.Laskowski RA, MacArthur MW, Moss DS. 1993. PROCHECK: a program to check the stereochemical quality of protein structures. J Appl Crystallogr 26:283–291. doi: 10.1107/S0021889892009944. [DOI] [Google Scholar]
- 32.Kozakov D, Brenke R, Comeau SR, Vajda S. 2006. PIPER: an FFT-based protein docking program with pairwise potentials. Proteins 65:392–406. doi: 10.1002/prot.21117. [DOI] [PubMed] [Google Scholar]
- 33.Kozakov D, Beglov D, Bohnuud T, Mottarella SE, Xia B, Hall DR, Vajda S. 2013. How good is automated protein docking? Proteins 81:2159–2166. doi: 10.1002/prot.24403. [DOI] [PMC free article] [PubMed] [Google Scholar]
- 34.Comeau SR, Gatchell DW, Vajda S, Camacho CJ. 2004. ClusPro: an automated docking and discrimination method for the prediction of protein complexes. Bioinformatics 20:45–50. doi: 10.1093/bioinformatics/btg371. [DOI] [PubMed] [Google Scholar]
- 35.Comeau SR, Gatchell DW, Vajda S, Camacho CJ. 2004. ClusPro: a fully automated algorithm for protein-protein docking. Nucleic Acids Res 32:W96–W99. doi: 10.1093/nar/gkh354. [DOI] [PMC free article] [PubMed] [Google Scholar]
- 36.Seidler NW. 2013. Compartmentation of GAPDH. Adv Exp Med Biol 985:61–101. doi: 10.1007/978-94-007-4716-6_3. [DOI] [PubMed] [Google Scholar]
- 37.Muller DA, Young PR. 2013. The flavivirus NS1 protein: molecular and structural biology, immunology, role in pathogenesis and application as a diagnostic biomarker. Antiviral Res 98:192–208. doi: 10.1016/j.antiviral.2013.03.008. [DOI] [PubMed] [Google Scholar]
- 38.Ismail SA, Park HW. 2005. Structural analysis of human liver glyceraldehyde-3-phosphate dehydrogenase. Acta Crystallogr D Biol Crystallogr 61:1508–1513. doi: 10.1107/S0907444905026740. [DOI] [PubMed] [Google Scholar]
- 39.Sirover MA. 1999. New insights into an old protein: the functional diversity of mammalian glyceraldehyde-3-phosphate dehydrogenase. Biochim Biophys Acta 1432:159–184. doi: 10.1016/S0167-4838(99)00119-3. [DOI] [PubMed] [Google Scholar]
- 40.El-Bacha T, Menezes MMT, Azevedo e Silva MC, Sola-Penna M, Da Poian AT. 2004. Mayaro virus infection alters glucose metabolism in cultured cells through activation of the enzyme 6-phosphofructo 1-kinase. Mol Cell Biochem 266:191–198. doi: 10.1023/B:MCBI.0000049154.17866.00. [DOI] [PubMed] [Google Scholar]
- 41.Abrantes JL, Alves CM, Costa J, Almeida FCL, Sola-Penna M, Fontes CFL, Souza TML. 2012. Herpes simplex type 1 activates glycolysis through engagement of the enzyme 6-phosphofructo-1-kinase (PFK-1). Biochim Biophys Acta 1822:1198–1206. doi: 10.1016/j.bbadis.2012.04.011. [DOI] [PubMed] [Google Scholar]
- 42.Ramière C, Rodriguez J, Enache LS, Lotteau V, André P, Diaz O. 2014. Activity of hexokinase is increased by its interaction with hepatitis C virus protein NS5A. J Virol 88:3246–3254. doi: 10.1128/JVI.02862-13. [DOI] [PMC free article] [PubMed] [Google Scholar]
- 43.El-Bacha T, Midlej V, Pereira da Silva AP, Silva da Costa L, Benchimol M, Galina A, Da Poian AT. 2007. Mitochondrial and bioenergetic dysfunction in human hepatic cells infected with dengue 2 virus. Biochim Biophys Acta 1772:1158–1166. doi: 10.1016/j.bbadis.2007.08.003. [DOI] [PubMed] [Google Scholar]
- 44.Fontaine KA, Sanchez EL, Camarda R, Lagunoff M. 2015. Dengue virus induces and requires glycolysis for optimal replication. J Virol 89:2358–2366. doi: 10.1128/JVI.02309-14. [DOI] [PMC free article] [PubMed] [Google Scholar]
- 45.Shestov AA, Liu X, Ser Z, Cluntun AA, Hung YP, Huang L, Kim D, Le A, Yellen G, Albeck JG, Locasale JW. 2014. Quantitative determinants of aerobic glycolysis identify flux through the enzyme GAPDH as a limiting step. eLife 3:03342. doi: 10.7554/eLife.03342. [DOI] [PMC free article] [PubMed] [Google Scholar]