Abstract
Background and Aims:
Central venous catheters are in situ in most of the intensive care unit (ICU) patients, which may be an alternative for determining acid-base status and can reduce complications from prolonged arterial cannulation. The aim of this study was to examine the reliability between adjusted central venous blood gas (aVBG) and arterial blood gas (ABG) samples for pH, partial pressure of carbon-di-oxide (pCO2), bicarbonate (HCO3−), base excess (BE) and lactates in paediatric cardiac surgical ICU.
Methods:
We applied blood gas adjustment rule, that is aVBG pH = venous blood gas (VBG) pH +0.05, aVBG CO2 = VBG pCO2 - 5 mm Hg from the prior studies. In this study, we validated this relationship with simultaneous arterial and central venous blood obtained from 30 patients with four blood sample pairs each in paediatric cardiac surgical ICU patients.
Results:
There was a strong correlation (R i.e., Pearson's correlation) between ABG and aVBG for pH = 0.9544, pCO2 = 0.8738, lactate = 0.9741, HCO3− = 0.9650 and BE = 0.9778. Intraclass correlation co-efficients (ICCs) for agreement improved after applying the adjustment rule to venous pH (0.7505 to 0.9454) and pCO2 (0.4354 to 0.741). Bland Altman showed bias (and limits of agreement) for pH: 0.008 (−0.04 to + 0.057), pCO2: −3.52 (–9.68 to +2.65), lactate: −0.10 (−0.51 to +0.30), HCO3−: −2.3 (–5.11 to +0.50) and BE: −0.80 (−3.09 to +1.49).
Conclusion:
ABG and aVBG samples showed strong correlation, acceptable mean differences and improved agreement (high ICC) after adjusting the VBG. Hence, it can be promising to use trend values of VBG instead of ABG in conjunction with a correction factor under stable haemodynamic conditions.
Keywords: Adjusted venous blood gas, arterial blood gas, venous blood gas
INTRODUCTION
Assessment of acid-base balance is essential for most patients who are admitted to paediatric cardiac surgical intensive care unit (ICU) every day and this need is routinely accomplished by arterial blood gas (ABG) analysis. The long-term arterial catheter in situ has possible complications such as bleeding, arterial spasm, embolism, thrombosis, haematoma, aneurysm formation and reflex sympathetic dystrophy.[1] Insertion of a central venous catheter (CVC) is required for central venous pressure (CVP) measurement, sampling of blood for investigation, venous blood gas analysis (VBG) and for drug administration in ICU. There are studies in the adult population showing correlation between ABG and VBG blood values with respect to pH, partial pressure of carbon dioxide (pCO2), bicarbonate (HCO3−) and base excess (BE) in emergency department, patients with acute respiratory failure, diabetic ketoacidosis, uremic acidosis, acute exacerbation of chronic obstructive lung disease and tricyclic anti-depressant poisoning.[2] Some of these studies showed good correlation and others were controversial about the reliability of VBG values for predicting ABG values. Besides, they were predominantly limited to adult population or a number of diseases.
A study involving patients in paediatric ICU showed good correlation between arterial and venous blood samples for pH, pCO2 and HCO3−. However, this study included wide spectrum of diseases including 19 different diagnoses and their results cannot be generalized to every disease category because of the inappropriate distribution of studied patients and a small number in each disease group.[3]
The relation between venous and arterial lactate is less clear, with conflicting evidence. In a retrospective study done in adult patients of ICU showed that central venous lactate collected within a 30-min range are interchangeable with arterial lactate for clinical practice.[4] However, there is limited information about interchangeability of central venous and arterial lactate in the paediatric population.
Rang et al., studied arterial and VBG correlation in adult patients of the emergency department and concluded that venous and arterial results are not equivalent, cannot be interchanged. However, by the use of a correction factor derived from their data or other studies might allow physicians to adjust venous results to derive values within acceptable tolerance level.[5]
The aim of this study was to evaluate the reliability between adjusted central VBG (aVBG) value and ABG value for pH, pCO2, HCO3−, BE and lactate in a group of paediatric cardiac surgical ICU patients.
METHODS
After hospital Research Ethical Committee approval, this study was done in paediatric cardiac surgical ICU patients, whose parents had given consent for surgery and post-operative care, at a tertiary care hospital. A total of 30 paediatric patients requiring ABG and VBG analyses as a part of their clinical care were eligible for inclusion in the study. From each patient, four random samples were taken in the first post-operative day. Eligible patients had an arterial blood sample drawn from an in situ arterial catheter placed in the femoral artery and a venous sample drawn from an in situ central venous catheter placed in femoral vein simultaneously. Syringes containing blood samples were analysed using ICU based analysers which were calibrated according to standard quality assurance protocols. A registered nurse or a doctor withdrew blood samples and prepared it for analysis, a routine practice in our ICU. We had excluded blood sample pairs of ABG and VBG if difference between the sodium levels was >10% or haemoglobin difference was >0.5 g/dl (differences suggest an imperfect blood sampling technique) and also excluded patients with low cardiac output or unstable haemodynamics.
Based on the study by Walkey et al.,[6] aVBG was calculated using the rule of aVBG pH = VBG pH +0.05, aVBG CO2 = VBG pCO2 −5 mm Hg. These adjustment equations were formulated by them, through calculation of the weighted mean differences between arterial and venous pH and CO2 from prior ICU-based studies of central venous blood. HCO3, lactate and BE were not adjusted. Hence, aVBG values for HCO3−, lactate and BE were taken same as VBG HCO3−, lactate and BE.
MedCalc version 11.3.0.0 was used for statistical analysis. Based on the previous study,[7] considering α error of 0.05 and β error of 0.20 with a difference between a correlation value of R = 0.8 (not correlated well enough) versus R = 0.95 (strongly correlated) for pH, pCO2 and lactate, a sample size of 25 patients was calculated. We had enrolled total of 30 patients from whom four random blood gas samples from arterial and venous lines were drawn. The pH, pCO2, lactate, HCO3− and BE values from both samples were analysed with the Pearson test of correlation (R) to determine the strength of relationship between aVBG and ABG values. Correlation co-efficient values range from being negatively correlated (−1) to uncorrelated (0) to positively correlated (+1). (0.0 is no association, +0.2 is weakly positive, +0.5 is moderately positive, +0.8 is strongly positive, +1.0 is perfectly positive).
Linear regression analysis was then used to create a graphic representation of this relationship with the formula of the "best fit" line allowing the arterial pH, pCO2, lactate, HCO3− and BE values to be calculated from the adjusted central venous pH, pCO2, lactate, HCO3− and BE values respectively [Figures 1a, 2a, 3a, 4a and 5a]. The co-efficient of determination (r2) is the proportion of variation in the dependent variable (arterial) explained by a linear regression model using the independent variable (venous). For all analysis, P <0.05 was considered statistically significant.
Figure 1.
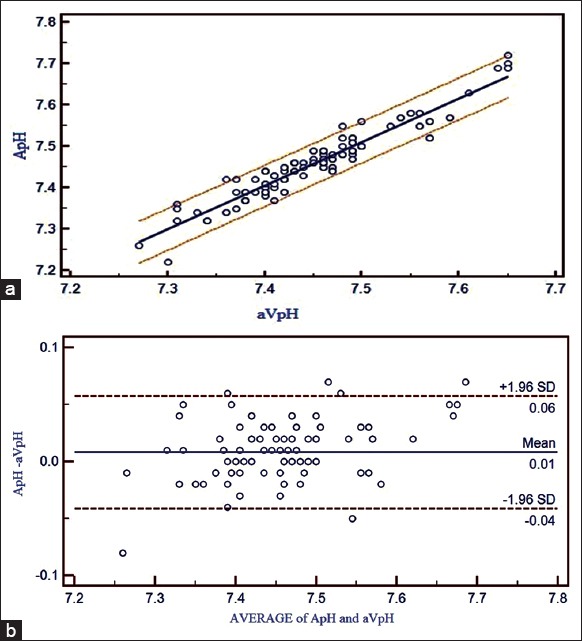
(a) Correlation between adjusted central venous blood gas and arterial blood gas values and linear regression with 95% confidence interval lines on both sides for pH. (b) Bland Altman bias plots of adjusted central venous blood gas and arterial blood gas for pH showing mean difference and 95% limits of agreement (ApH = arterial pH, aVpH = adjusted central venous pH)
Figure 2.
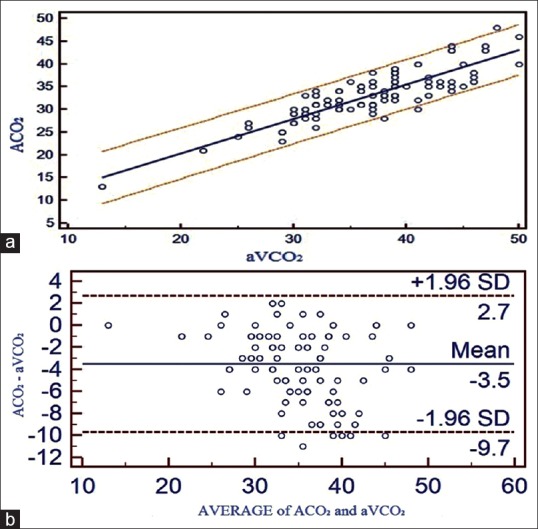
(a) Correlation between adjusted central venous blood gas and arterial blood gas values and linear regression with 95% confidence interval lines on both sides for pCO2. (b) Bland Altman bias plots of adjusted central venous blood gas and arterial blood gas for pCO2 showing mean difference and 95% limits of agreement (ACO2 = arterial pCO2, aVCO2 = adjusted central venous pCO2)
Figure 3.
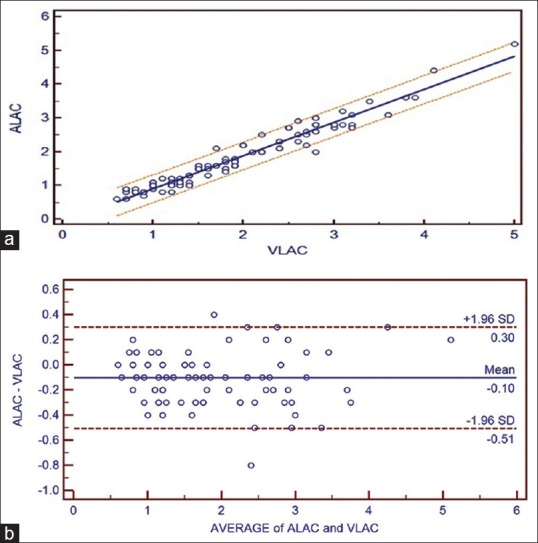
(a) Correlation between adjusted central venous blood gas and arterial blood gas values and linear regression with 95% confidence interval lines on both sides for lactate. (b) Bland Altman bias plots of adjusted central venous blood gas and arterial blood gas for lactate showing mean difference and 95% limits of agreement (ALAC = arterial lactate, VLAC = central venous lactate)
Figure 4.
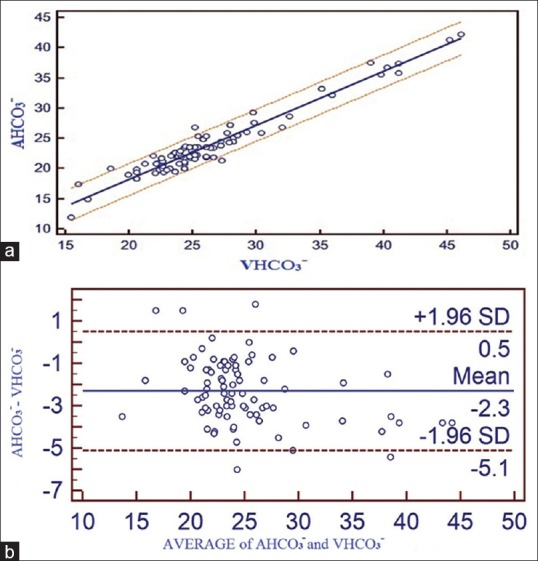
(a) Correlation between adjusted central venous blood gas and arterial blood gas values and linear regression with 95% confidence interval lines on both sides for bicarbonate. (b) Bland Altman bias plots of adjusted central venous blood gas and arterial blood gas for bicarbonate showing mean difference and 95% limits of agreement (AHCO3− = arterial bicarbonate, VHCO3− = central venous bicarbonate)
Figure 5.
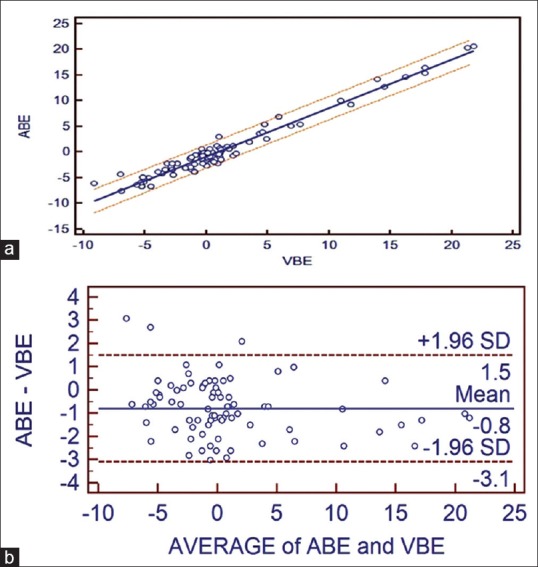
(a) Correlation between adjusted central venous blood gas and arterial blood gas values and linear regression with 95% confidence interval lines on both sides for base excess. (b) Bland Altman bias plots of adjusted central venous blood gas and arterial blood gas for base excess showing mean difference and 95% limits of agreement (ABE = arterial BE, VBE = central venous BE)
Intraclass correlation co-efficients (ICCs)[8] combine measures of association and bias. This allowed for a statistical understanding of the relationships between ABG and VBG pH and pCO2, as well as an assessment of whether agreement between ABG and VBG improved after applying the adjustment formula. ICC is interpreted as follows: Poor (0–0.2), fair (0.3–0.4), moderate (0.5–0.6), strong (0.7–0.8) and almost perfect (>0.8).
Bland Altman[9] limits of agreement (LOA) plots [Figures 1b, 2b, 3b, 4b and 5b] were constructed for these data. LOA plots visually represent the bias (mean difference) and variability (95% LOA) between two methods of measurement. Ninety-five percent LOA were determined by 1.96 × standard deviation (SD) of the mean difference between ABG and aVBG values, as previously described by Bland Altman.
RESULTS
A total of 17 patients were males and 13 were females. Among them, eight patients were <1 year, 13 patients between 1 and 5 years and nine patients between 5 and 10 years. Among 30 patients, 18 patients were subjected to mechanical ventilation. Of 30 patients, 13 patients had undergone ventricular septal defect closure, eight patients had undergone atrial septal defect closure, four patients had undergone patent ductus arteriosus ligation and five patients had undergone tetrology of Fallot repair.
A total of 120 sets of blood gas samples were analysed for pH, pCO2, lactate, HCO3− and BE obtained from ABG and aVBG samples [Table 1]. None of the blood gas samples was excluded from the study.
Table 1.
Summary of pH, pCO2, lactate, HCO3− and BE between ABG and aVBG

A strong positive correlation was seen between ABG and aVBG values for pH (R = 0.9544), pCO2 (R = 0.8738), lactates (R = 0.9741), HCO3− (R = 0.9650) and BE (R = 0.9778). Linear regression equations were derived to estimate ABG values from aVBG values for pH, pCO2, lactates, HCO3− and BE and their co-efficient of determination (r2) as follows [Figures 1a, 2a, 3a, 4a and 5a]:
Arterial pH = −0.3778 + 1.0518 × adjusted central venous pH (r2 = 0.9108, P ≤ 0.001)
Arterial pCO2 = 5.2923 + 0.7574 × adjusted central venous pCO2, (r2 = 0.7636, P ≤ 0.001)
Arterial lactate = −0.06089 + 0.9775 × central venous lactate, (r2 = 0.9488, P ≤ 0.001)
Arterial HCO3− = 0.4083 + 0.8950 × central venous HCO3−, (r2 = 0.9312, P ≤ 0.001)
Arterial BE = −0.7564 + 0.9447 central venous BE, (r2 = 0.9562, P ≤ 0.001).
Bland Altman bias plots showed mean difference ± SD and LOA for pH: 0.008 ± 0.0252 and −0.04 to +0.057, pCO2: −3.52 ± 3.15 and –9.68 to +2.65, lactate: −0.10 ± 0.21 and –0.51 to +0.30, HCO3−: −2.3 ± 1.43 and –5.11 to +0.50 and BE: −0.80 ± 1.17 and –3.09 to +1.49 between ABG and aVBG. This means that there is 95% chance of predicted ABG values of pH, pCO2, lactates, HCO3− and BE to lie within LOA of aVBG pH, pCO2, lactates, HCO3− and BE values [Figures 1b, 2b, 3b, 4b and 5b].
The ICC significantly increased after adjustment of VBG from 0.7505 to 0.9454 for pH and from 0.4354 to 0.741 for pCO2 (both comparison between absolute ICCs).
DISCUSSION
An important part of the assessment of clinical status and progress of critically ill patients is analysis of pH, pCO2, HCO3−, BE and lactate. It is not possible to obtain arterial samples always. Arterial puncture and long-term in situ arterial catheters pose a small but significant risk of complications.[10] Patients in paediatric cardiac surgical ICU often have CVC. Blood gases sampled from existing CVC potentially represent an alternative to ABG testing. This study prospectively validated a "VBG-to-ABG adjustment rule" (aVBG) intended to improve ABG-VBG agreement based on the previously described arterio-venous gradients for pH and pCO2.[6]
ICC showed improvement in agreement after applying adjustment rule to venous pH and pCO2.
ABG and aVBG values for pH correlated satisfactorily (R = 0.9544) and had LOAs that were moderate enough to allow substitution (−0.04134 to 0.05750). For example, if aVBG value of 7.20 were obtained, we can roughly calculate the arterial value to be as low as 7.16 or as high as 7.25. Nonetheless, in general, one can be 95% confident that the arterial value will not be more than 0.04 lower than the adjusted central venous value, which would allow acidotic patients to be identified.
With respect to pCO2 values, ABG and aVBG values correlated satisfactorily (R = 0.8738), but their 95% LOAs were too wide to allow substitution (−9.6885 to 2.6552). For example, if an adjusted central venous pCO2 value of 40 mm Hg were to be obtained, the arterial value might be as low as 30 mm Hg or as high as 42 mm Hg. However, hypercarbia (arterial pCO2 >45 mm Hg) can be ruled out with a central venous pCO2 of 50 mm Hg or less, as all three patients in our study, with an arterial pCO2 >45 mm Hg also had adjusted central venous value >45 mm Hg. The study by Walkey et al.[6] showed high agreement (LOA = −6.5 to 7.5) between aVBG pCO2 and ABG pCO2 in adult patients of medical, surgical and cardiac ICU. Given that the blood gas values should be interpreted in the context of the individual patient's clinical status and that frequently serial blood gases are obtained to help assess a patient's course, central venous pCO2 largely should be able to replace arterial pCO2 in the most clinical circumstances.
ABG and aVBG values for HCO3− showed a good correlation (R = 0.9650). The difference in venous pH is generally lower than arterial pH and venous pCO2 generally higher than arterial pCO2, mean venous HCO3− was unexpectedly higher than the mean arterial value. We conclude that HCO3−, a calculated value, was influenced more by the CO2 level on which the calculation is based rather by the pH. Serum HCO3− is accurately quantified when measured directly as a part of an electrolyte assay.[11] The mean difference between ABG and aVBG for HCO3− was 2.3033 which was within clinically acceptable limits according to Rang et al.[5] In this study, LOA (−5 to 0.5) was wide which was close to LOA by Treger et al.[12] (−4 to 2.4), who have concluded as an excellent agreement between arterial and venous HCO3−.
Regarding BE, the ABG and aVBG values correlated well (R = 0.9778), but their 95% LOAs were again too wide to allow substitution (−3.0998 to 1.4). The arteriovenous difference in the study 0.19 mmol/L by Middleton et al.[13] and 0.18 mmol/L by Malinoski et al.[7] were small. LOA (VBG–ABG) was similar in both studies but Malinoski et al. (LOA = −2.2 to 1.8) considered as wide LOA and Middleton et al. (−1.86 to 2.24) considered as narrow LOA. The LOA for BE in the present study was close to above two studies.
In this study, lactate values in ABG and aVBG correlated well (R = 0.9741), mean differences and LOA (ABG–aVBG) [Table 1] were close as seen in Middleton et al.[13] study (mean difference of 0.08 mmol/L and LOA between −0.27 and 0.42 for VBG–ABG). There was narrow LOA in our study as compared to Réminiac et al.[4] (LOA between −1.2 mmol/L and 1.2 mmol/L) study. Both these studies concluded interchangeability in lactate values between central VBG and ABG in adult patients. Gallagher et al.[14] study showed wider arteriovenous difference (0.22 mmol/L) and LOA (−1.3 to 1.7 mmol/L) as the venous blood was obtained from peripheral vein instead of the central vein.
To the best of our knowledge, there is limited literature on aVBG values to allow substitution for ABG values in paediatric patients.
The study by Walkey et al.[6] have showed significant agreement between aVBG and ABG values in adult patients. The simple formula of aVBG pH = VBG pH +0.05 and aVBG pCO2 = VBG pCO2 - 5 mm Hg has the advantage of ease of use and similar accuracy compared with regression equations.
In the present study, which showed improved agreement (high ICC) after adjusting VBG, this could be promising to use aVBG in paediatric patients with indwelling CVC in a recovery phase or ventilator weaning phase. This can reduce serious complications associated with long-term arterial catheterization. Due to good correlation, acceptable mean differences and high ICC, the present study can suggest that changes in venous gases from a baseline value would reflect changes in the corresponding arterial values and therefore can be used for trending purposes.
Since paediatric patients in post-operative cardiac surgical ICU already have an in situ central venous line required for blood sampling, CVP measurement and drug administration during and after surgical procedure; we should try to take advantage the most of it in a reliable way and try to eliminate as soon as possible other sites of side effects.
Limitations of the study included a small proportion of patients with abnormal blood gas values. Further study of the differences in the clinical decision making based on aVBGs from a patient population with a likelihood of abnormal blood gases is necessary before recommending routine use of an abnormal aVBG. Further a clinical trial comparing central VBG to ABG utilisation strategies would be necessary to determine whether routine central VBG use decreases complication rates in the critical care setting.
CONCLUSION
Adjusting the VBG pH up by 0.05 and pCO2 down by 5 mm Hg satisfactorily improves the agreement between the central VBG and ABG. This adjustment allows for the promising prediction of ABG from aVBG under normal conditions and early removal of in situ arterial catheter from patients in paediatric cardiac surgical ICU.
Financial support and sponsorship
Nil.
Conflicts of interest
There are no conflicts of interest.
REFERENCES
- 1.Mortensen JD. Clinical sequelae from arterial needle puncture, cannulation, and incision. Circulation. 1967;35:1118–23. doi: 10.1161/01.cir.35.6.1118. [DOI] [PubMed] [Google Scholar]
- 2.Bilan N, Behbahan AG, Khosroshahi AJ. Validity of venous blood gas analysis for diagnosis of acid-base imbalance in children admitted to pediatric intensive care unit. World J Pediatr. 2008;4:114–7. doi: 10.1007/s12519-008-0022-x. [DOI] [PubMed] [Google Scholar]
- 3.Yildizdas D, Yapicioglu H, Yilmaz HL, Sertdemir Y. Correlation of simultaneously obtained capillary, venous, and arterial blood gases of patients in a paediatric intensive care unit. Arch Dis Child. 2004;89:176–80. doi: 10.1136/adc.2002.016261. [DOI] [PMC free article] [PubMed] [Google Scholar]
- 4.Réminiac F, Saint-Etienne C, Runge I, Ayé DY, Benzekri-Lefevre D, Mathonnet A, et al. Are central venous lactate and arterial lactate interchangeable? A human retrospective study. Anesth Analg. 2012;115:605–10. doi: 10.1213/ANE.0b013e31825e703e. [DOI] [PubMed] [Google Scholar]
- 5.Rang LC, Murray HE, Wells GA, Macgougan CK. Can peripheral venous blood gases replace arterial blood gases in emergency department patients? CJEM. 2002;4:7–15. doi: 10.1017/s1481803500006011. [DOI] [PubMed] [Google Scholar]
- 6.Walkey AJ, Farber HW, O’Donnell C, Cabral H, Eagan JS, Philippides GJ. The accuracy of the central venous blood gas for acid-base monitoring. J Intensive Care Med. 2010;25:104–10. doi: 10.1177/0885066609356164. [DOI] [PubMed] [Google Scholar]
- 7.Malinoski DJ, Todd SR, Slone S, Mullins RJ, Schreiber MA. Correlation of central venous and arterial blood gas measurements in mechanically ventilated trauma patients. Arch Surg. 2005;140:1122–5. doi: 10.1001/archsurg.140.11.1122. [DOI] [PubMed] [Google Scholar]
- 8.Shrout PE, Fleiss JL. Intraclass correlations: uses in assessing rater reliability. Psychol Bull. 1979;86:420–8. doi: 10.1037//0033-2909.86.2.420. [DOI] [PubMed] [Google Scholar]
- 9.Bland JM, Altman DG. Statistical methods for assessing agreement between two methods of clinical measurement. Lancet. 1986;1:307–10. [PubMed] [Google Scholar]
- 10.AARC clinical practice guideline. Sampling for arterial blood gas analysis. American Association for Respiratory Care. Respir Care. 1992;37:913–7. [PubMed] [Google Scholar]
- 11.Rose BD. Introduction to simple and mixed acid–base disorders. In: Rose B, editor. Clinical Physiology of Acid–base and Electrolyte Disorders. 2nd ed. New York: McGraw-Hill; 1984. p. 363. [Google Scholar]
- 12.Treger R, Pirouz S, Kamangar N, Corry D. Agreement between central venous and arterial blood gas measurements in the intensive care unit. Clin J Am Soc Nephrol. 2010;5:390–4. doi: 10.2215/CJN.00330109. [DOI] [PMC free article] [PubMed] [Google Scholar]
- 13.Middleton P, Kelly AM, Brown J, Robertson M. Agreement between arterial and central venous values for pH, bicarbonate, base excess, and lactate. Emerg Med J. 2006;23:622–4. doi: 10.1136/emj.2006.035915. [DOI] [PMC free article] [PubMed] [Google Scholar]
- 14.Gallagher EJ, Rodriguez K, Touger M. Agreement between peripheral venous and arterial lactate levels. Ann Emerg Med. 1997;29:479–83. [PubMed] [Google Scholar]


