Abstract
Background:
Cardiac arrest is a condition in which the heart is completely stopped and is not pumping any blood. Although most cardiac arrest cases are reported from homes or hospitals, about 20% occur in public areas. Therefore, these areas need to be investigated in terms of cardiac arrest incidence so that places of high incidence can be identified and cardiac rehabilitation defibrillators installed there.
Methods:
In order to investigate a study area in Petersburg, Pennsylvania State, and to determine appropriate places for installing defibrillators with 5-year period data, swarm intelligence algorithms were used. Moreover, the location of the defibrillators was determined based on the following five evaluation criteria: land use, altitude of the area, economic conditions, distance from hospitals and approximate areas of reported cases of cardiac arrest for public places that were created in geospatial information system (GIS).
Results:
The A-P HADEL algorithm results were more precise about 27.36%. The validation results indicated a wider coverage of real values and the verification results confirmed the faster and more exact optimization of the cost function in the PSO method.
Conclusion:
The study findings emphasize the necessity of applying optimal optimization methods along with GIS and precise selection of criteria in the selection of optimal locations for installing medical facilities because the selected algorithm and criteria dramatically affect the final responses. Meanwhile, providing land suitability maps for installing facilities across hot and risky spots has the potential to save many lives.
Keywords: Cardiac rehabilitation, Location, Optimization methods, ACO, PSO
Introduction
Rehabilitation operations immediately after pulmonary cardiac arrest improve patient survival and that minimizing the delay is critical. If pulmonary cardiac rehabilitation operation begins immediately after cardiac arrest, the patient’s nervous system efficiency and life are retained; post-cardiac arrest resuscitation can save lives (1, 2). Several studies have investigated the success rate of rehabilitation operations and effective factors within medical centers and hospitals (3–6). The existence of home- and hospital-based rehabilitation facilities and their impact in cost and benefit analysis have been studied in some studies with emphasis on geographical distribution of reported cases and reduction of mortality rate (7–9).
Determining the optimum location for cardiac resuscitation facilities in public places requires investigations into several geographic, social and economic factors such as land use, altitude of the area, distance from hospitals and medical centers, air pollution, economic status of the residents (poverty) and reported cases of cardiac arrests in public facilities (1,2). Therefore, careful investigation and integration of these criteria and the selection of optimal locations for installing facilities related to cardiac rehabilitation have not received sufficient attention.
Due to presence of several goals in locating rehabilitation facilities, the selection of suitable locations is a semi-structured problem that can be solved using multi-criteria decision-making (MCDM). For decision problems in spatial areas, input layers serve in raster forms, individual pixels are inserted into the analyses as decision options, and optimization methods are applied to manage and process the multiple many options carefully (10). Increasing the number of options and the number of different criteria on the other can transform a decision problem into an NP-hard problem whose solution requires swarm intelligence methods (10–12).
Ant Colony Optimization (ACO) and Particle Swarm Optimization (PSO) Algorithms are among the most widely used methods of metaheuristic or swarm intelligence methods. Both methods are based on the intrinsic behavior of ants and particles (birds) in nature to analyze combined optimization problems (11, 12). Bio-mass power plants were located through a comparison of PSO, GA, Tabu Search and Simulated Annealing (13). A procedure similar to comparative location and evaluation of GA, BPSO and Honey Bee foraging was performed (14–16). A multi-objective model was developed for large-scale linear feature coverage problems and was performed using GIS analysis and ACO algorithm by converting the continuous problem into a discrete one (17). Yapicioglu et al. (18) adopted combined PSO (bio-objective PSO) to solve location problems. In addition, fuzzy clustering optimization was carried out with a PSO algorithm (19). All these studies emphasized the efficiency of metaheuristic methods to tackle decision problems, particularly optimization and location ones.
In the current study, we applied a combination of swarm intelligence and GIS on a suitable and effective background (transforming a continuous state to a raster and discrete state) in order to locate cardiac resuscitation facilities in public places in Petersburg, Pennsylvania.
Brief review of ACO
An ACO algorithm is based on the residual pheromone along several routes to find the shortest path. To this end, based on relation [1], we first calculate the probability of selecting a path between i(xi, yi) and j(xi,yi) pixels by the qth ant (20, 21).
| [1] |
Where i=1,2,…, xmax, j=1,2,…, ymax, τij (t) denotes the pheromone rate, ηi,j (t) is the value of the cost function between cells i and j, and α and β are control parameters representative of the pheromone rate value compared to the cost function value. Niq also indicates the neighbor set of cell i for the qth ant.
After selecting the new path, the pheromone rate is locally updated according to relation [2].
| [2] |
In the above relation, 0<ϱ≤1 is the evaporation rate and τ0 is the initial pheromone along the path. At the end of each iteration, the pheromone rate is wholly updated based on relation [3].
| [3] |
Where Δτij is the pheromone value added to τij by ants, Q is a constant and Lk (t) is the best value for the cost function. Optimization of the cost function continues to reach the maximum iteration (Imax or t), a new pixel is selected for the ants’ mobility at each iteration, and the best pixels are chosen based on the cost function at the end of all steps.
Brief review of PSO
In PSO algorithm, each particle is defined as multidimensional with two values for speed and location. During every step of the particle movement, the best responses in terms of merit are determined for all particles (22–24). The respective optimization is called Pbest and the end of all phases is referred to as Gbest. All particles update their location based on the respective Pbest and Gbest to find the global optimal solution (11). We need to define the two dimensions to solve locating problems. Assuming that coordinates x,y of the ith particle (from a n-member set) show particles with xi and yi and their speed along the x and y axes with vxi and vyi. According to relations [4] and [5], the speed and location of each particle are updated in each iteration (25), which is calculated through the sum of locations over the previous iteration and speed on the new location of the particle.
| [4] |
| [5] |
In the above terms, i=1, 2,…, N, t=1, 2,…, Imax, t denotes iteration, Imax is the maximum iteration, rand() is a random value within the range(0,1), c1 and c2 are two positive constant values called the cognitive learning rate and the social learning rate, and pbestx (t) and gbestx (t) are the best resulting responses to the tth iteration along the x and y axes. σ1 and σ2 are imposed parameters on x and y locations of articles located at the center of the nearest pixels (25). Then, W (t) is the inertia weight calculated by formula [6] at each iteration.
| [6] |
Where wmin and wmax are the minimum and maximum of the inertia weight, respectively. The cost function is satisfied after calculating x,y, vx and vy. Three phases continue: speed updating, location updating and calculating the cost function to achieve the maximum iteration (Imax).
Materials and Methods
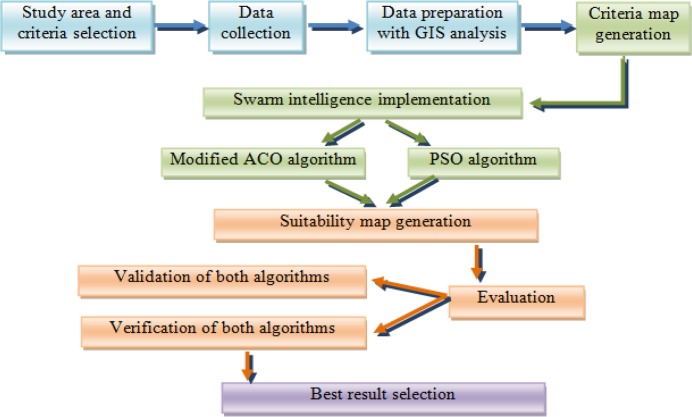
Methodology of this research aims to provide land suitability maps for installing rehabilitation facilities, including determining the study area, selecting the criteria, collecting necessary data, preparing standard maps using GIS analyses, implementing ACO and PSO methods, evaluating the results of both algorithms and selecting the more precise output from the results of both methods. The different phases of the research methodology are presented in flowchart Fig. 1.
Fig. 1:
Research methodology
Study area and criteria determination
In order to implement the proposed method, public locations in Petersburg, Pennsylvania were selected as the study area. The study area data were collected over a 5-year period up to 2005. Regarding the effective factors in the incidence of cardiac arrest, the following five criteria were investigated based on experts’ views and available data: land use, area altitude, poverty index, distance from hospitals and estimation buffers of reported cases of cardiac arrest. The geographical coordinates system for the study area is GCS_North_American_1983 with linear unit of foot in scale 1:150,000 (1).
The five selected criteria were prepared with respect to the effective areas of cardiac arrest incidence and with the help of spatial analyses. The necessary data obtained from the existing database included the area altitude, location of existing hospitals, available land uses, reported cases of cardiac arrest and statistical information such as education, employment and financial status of residents. Standard maps were developed using different spatial analyses and with respect to significant numerical ranges for cardiac arrest incidence (based on experts’ views).
Modification of ACO algorithm for raster-based search space
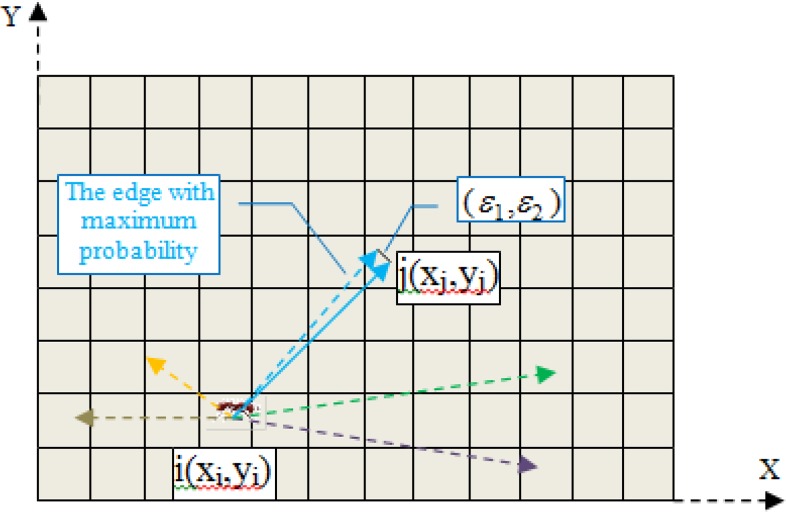
Regarding the raster nature of the search space in the current work, we changed the implementation procedure of the swarm intelligence methods to adapt them to the discrete and raster nature of this space. According to the PSO algorithm in (25) was changed by adding modification values (to the x and y values) based on the raster space feature to put the particles at the center of the pixels. In order to adapt the ACO algorithm, we performed a procedure similar to the PSO one. When displacing the ant from cell i to j, modification of (ε1, ε2) was carried out according to Fig. 2 to match the new location of the ant with the center of the pixel and each pixel was only considered a place for the displacement of ants. Running the innovation of the current research, the ACO algorithm changed its initial state and maintained consistency with the spatial problems in which inputs are as raster.
Fig. 2:
Depiction of ant movement probability in ACO
According to Fig. 2, among all possible movements for the ant at each iteration, the most significant route based on the criteria map and relation [1] was selected, i.e., the route with the maximum movement probability. Then, since every pixel had the same value across raster space, (ε1, ε2) was modified to consider each pixel only as a point of search space. At each iteration, the center of the pixel was selected as the displacement point and other points of the pixel space overlapped the center of that pixel. Therefore, the vector connecting the center of the ith pixel to the center of the jth pixel (continuous vector) was chosen as the displacement vector.
ACO- and PSO-based based heart attack defibrillators locating technique (A-P HADEL)
In order to develop land suitability maps for installing rehabilitation defibrillators, we used two swarm intelligence methods (ACO and PSO). By searching in the study area, ACO and PSO determined the critical points in terms of the incidence probability of cardiac arrest based on land use, area altitude, economic conditions and estimated areas for reported cases of cardiac arrest. According to relations 1 to 6 and the transformations mentioned in pervious section, the transformed ACO and PSO algorithms were programmed and implemented. The respective criteria map was inserted as the input into the proposed A-P HADEL algorithm and land suitability maps were prepared for the installation of rehabilitation defibrillators as output. Because of producing different outputs from the same inputs, in this work we evaluated and investigated the results of the proposed A-P HADEL algorithm to choose the best answer from the results of both methods because ACO and PSO were implemented in parallel to prepare land suitability maps. In order to evaluate the results of different methods for a single problem, we investigated the internal parameters of the methods (verification) and compared the results with real values (validation). Here, evaluation was carried out based on the cost function optimization percentage using both methods and the convergence of results to the reported cases of cardiac arrest in public places in this city was evaluated over a five-year period. Finally, after running the above steps, the land suitability maps with better precision for installing rehabilitation facilities were provided to health experts and decision makers because defibrillators are costly, their installation is time-consuming and they should be located with care.
Results
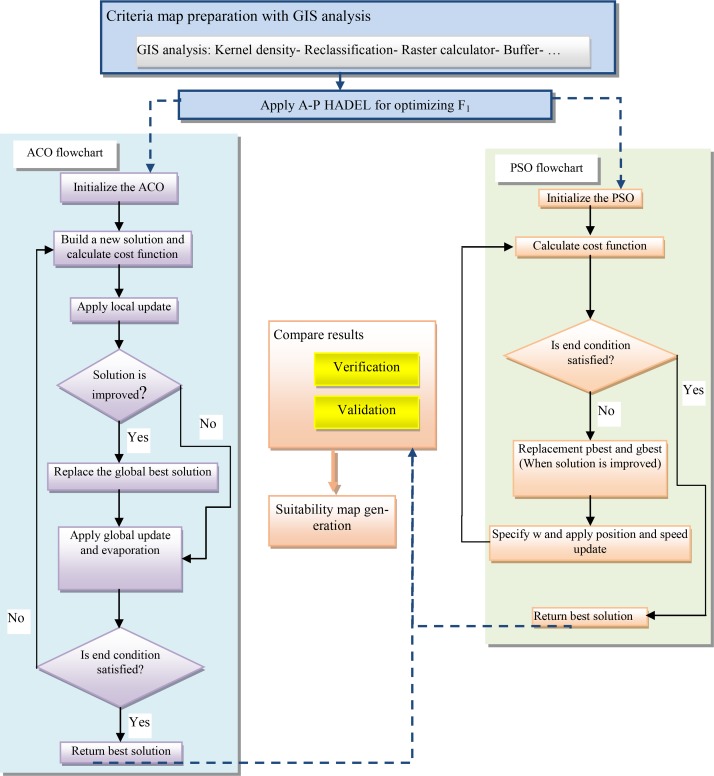
According to the proposed methodology, implementation was performed in two phases: developing standard maps and preparing land suitability maps for installing rehabilitation defibrillators. Standard maps were prepared using ArcGIS® 10 software analyses and based on selected effective criteria in installing defibrillators and the existing databases. Then, land suitability maps were developed by running the A-P HADEL algorithm, which was programmed in Matlab®. After assessment of the maps’ precision during the second phase, the final map was selected and presented to determine the suitable locations for installing defibrillators. The implementation phases are presented in flowchart Fig. 3.
Fig. 3:
A flowchart of research phases
Developing standard maps
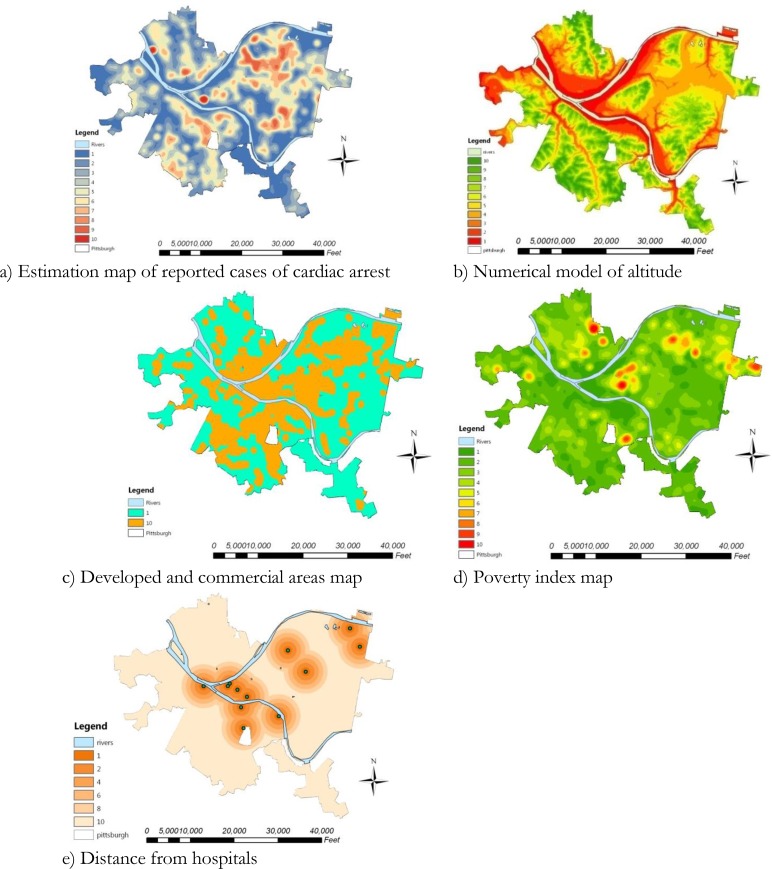
In order to develop the layer of estimated areas of cardiac arrest based on 1-year reported cases of cardiac arrests available as a point layer of statistics and information, Kernel density analysis was applied to create a smooth layer for the whole area. The search radius was 1500 feet and the pixel size was considered 150 feet. The search radius and pixel size were selected with respect to point coordinates system, scale and numerical values of the input layers. The resulting values were normalized within the range of 1–10 to standardize this layer. Number 1 was related to underestimated cases and a lower need for defibrillators and number 10 pertained to the most frequent reported cases and a greater need for defibrillators. The analysis results are presented in Fig. 4 a. The numerical model of the area altitude was also normalized in the range of 1 to 10. Number 10 was allocated to higher altitude and unsuitable locations for installing defibrillators and 1 was assigned to lower altitudes and suitable locations for such facilities (Fig. 4 b).
Fig. 4:
Standard maps of public locations in Petersburg, Pennsylvania
In order to prepare the land use layer, the available land uses across the area were investigated. As the uses of marshes, streams, mud, forests and arid areas were not necessary in the research analysis; uses of developed and commercial areas with 800 feet buffer were chosen. The suitable areas for defibrillators were assigned number 10 and other areas were standardized with number 1 (Fig. 4c). A poverty index map was prepared based on Fig. 4 d. According to O’Hare et al. (26), the following four standard maps were combined with equal weights to create this map jobless men of working age, unemployed housewives and their children, households below the poverty line and uneducated people. Ultimately, within 1–10 range, some values were assigned to the minimum and maximum poverty index. On this standard map, those areas with a higher poverty index will more likely have poorer health levels and need more rehabilitation facilities. In the final step, the standard distance from hospitals map was obtained. The buffer analyze of ArcGIS® 10 software was used and five buffers sized 1000, 2000, 3000, 4000 and 5000 feet in radius were drawn around the hospital locations. Because of the increasing need of building cardiac rehabilitation defibrillators facilities with increasing distance from the hospitals, the values 1, 2, 4, 6 and 8 were assigned to the above areas respectively, and the value 10 was dedicated to areas more than 5,000 feet away from the hospitals (Fig. 4 e).
Development of land suitability maps
In order to prepare land suitability maps for installing rehabilitation defibrillators, ACO and PSO methods were used. The details and values of the parameters are given in Table 1.
Table 1:
Values of existing parameters for implementation of PSO and ACO methods
| PSO | ACO | |
|---|---|---|
| npop | 30 | 30 |
| xmin | 1 | 1 |
| xmax | 426 | 426 |
| ymin | 1 | 1 |
| ymax | 343 | 343 |
| wmax | 0.9 | - |
| wmin | 0.4 | - |
| c1 | 2 | - |
| c2 | 2 | - |
| τ0 | - | 1 |
| alpha | - | 1 |
| beta | - | 2 |
| rho | - | 0.1 |
| vxmax | 0.1*(xmax−xmin) | - |
| vymax | 0.1*(ymax−ymin) | - |
| Imax | 100 | 100 |
For simplicity, the weights of the criteria in cost functions of both methods were assumed equal to 25. The parameters in the above table were already explained in the ACO and PSO method descriptions, except npop, which shows the initial population number in both methods. The cost function used in both algorithms was determined according to relation [7]. According to relation [7], the cost function includes maximization and minimization of the product of the five criteria multiplied by the respective weights. The first four criteria must be maximized and the last one must be minimized in the cost function.
| [7] |
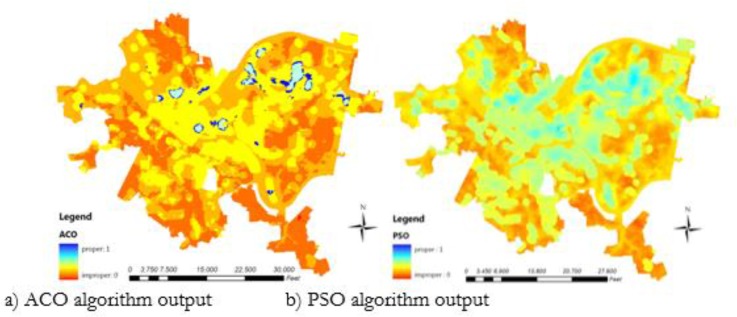
Land suitability maps produced by the ACO and PSO methods are presented in Fig. 5. Figure 5 presents the research results, including suitable and unsuitable areas for defibrillators. The numbers close to 1 and close to 0 indicate areas with greater and lesser need for defibrillators, respectively. The study results confirmed the existence of suitable areas for locating rehabilitation facilities at the central and northwestern areas of the study. The two algorithms gave different outputs. The scope of suitable areas for installing resuscitation facilities obtained from PSO was larger than that from ACO. Therefore, the accuracy and precision of the results must be evaluated.
Fig. 5:
Land suitability maps for installing rehabilitation defibrillators
Discussion
With respect to differences in the ACO and PSO results, the outputs of both methods had to be evaluated to obtain the best responses for developing land suitability maps. The evaluation of results of different methods for a single problem was conducted in two steps: verification, which compares the degree of optimization of the cost function in both methods, and validation, which evaluates the convergence of the results to the reported cases of cardiac arrest in public places in Petersburg over a five-year period.
PSO and ACO methods verification
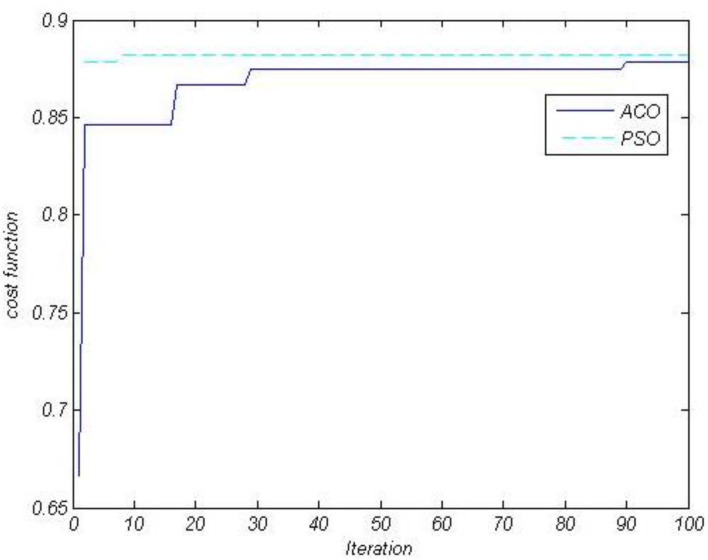
In order to compare the precision of the results from both methods, first, the optimization procedure of the cost function (relation 7) in both methods was evaluated over 100 iterations (Fig. 6).
Fig. 6:
Comparison of max. of cost functions of PSO and ACO methods in 100 iterations
The cost function values resulting from the maximization of the product of four criteria (business areas, distance from hospitals, estimated areas of reported cardiac arrest and poverty index in the respective weights) and the minimization of the product of altitude numerical model over 100 iterations are presented in diagram in Fig. 6 for both ACO and PSO.
We can conclude from Fig. 6 that the PSO algorithm performed optimization better than the ACO algorithm and was less likely to be involved in local optimizations. The PSO algorithm reduced the involvement of the cost function in local maximums and transferred it more quickly to the global maximum, which was not so far from the result. However, ACO began working with a larger distance from the global optimums (about 0.2) and was more involved in local optimums (scalar areas of diagram). Therefore, we concluded that PSO had a better precision than ACO in optimizing the cost function.
PSO and ACO methods validation
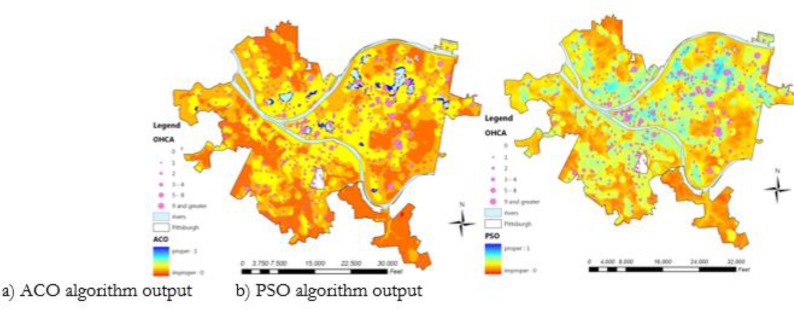
In order to compare the accuracy of the results, we combined land suitability maps in both methods with the map of reported cases of cardiac arrest in public places over a 5-year period (OHCA) (Fig. 7) in order to determine the convergence of results from the A-P HADEL algorithm to real values (i.e., the results of a real survey conducted across the area).
Fig. 7:
Land suitability maps and reported cases of cardiac arrest in public places in Petersburg, Pennsylvania over a 5-year period
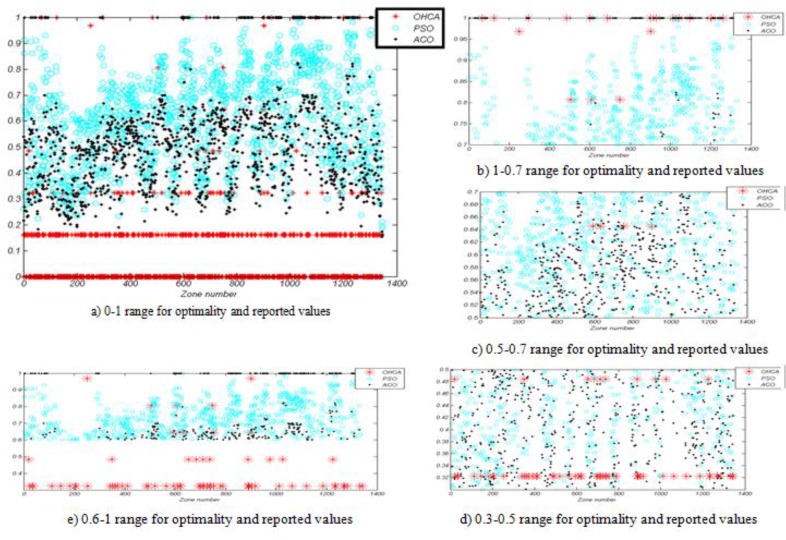
For a better comparison of real values (reported cases) with the maps produced with the ACO and PSO methods, the study area zoning was based on the reported cases by drawing around points indicating the reported cases of cardiac arrest in public locations, Thiessen polygons and the area was divided into 1345 zones. This classification was performed with regard to the area scope and OHCA values and locations.
Then, the area suitability values for these zones (ACO and PSO outputs) were calculated by averaging and the reported cases were normalized within the 0–1 range. The diagram of the normalized values of reported cases and the suitability function for the ACO and PSO methods for all zones are presented in Fig. 8 a. For easier visual comparisons, this diagram was presented for suitability and reported values larger than 0.7 (Fig. 8 b), between 0.5–0.7 (Fig. 8 c) and between 0.3–0.5 (8 d). Suitability values obtained from the ACO and PSO methods larger than 0.6 indicated a greater focus on installing defibrillators and values larger than 0.3 for reported cases of cardiac arrest denoted the susceptibility of the area for cardiac arrest incidence. Figure 8 e is drawn based on this classification.
Fig. 8:
Diagram for values of reported cardiac arrest, optimality functions resulting from the ACO and PSO methods
In order to compare three categories of values, we investigated the diagram vertically, i.e., we determined the presence or absence of cardiac arrests and their values for each zone to determine which method was more suitable and optimal for installing rehabilitation facilities in that zone and specified the optimality percentage of each optimization method. Of 1345 zones, 49.36% were obtained for ACO and 76.72% for PSO. In 50.64% and 23.28% of zones, PSO and ACO, respectively, were more compatible with reality (reported cases over a five-year period). In 26.08% of cases, neither method was consistent with reality.
Visual comparisons in Fig. 8 demonstrated that optimality in most zones of the ACO method was more compatible with real values. In the other cases, PSO was more consistent with reality. As a result, we could assert that PSO was generally more consistent with reality because it had proposed installation locations for high optimality values in all zones with high OHCA values and it provided a wider coverage for all zones, particularly those with optimality larger than 0.6. Therefore, we concluded that PSO was more suitable for locating resuscitation facilities in terms of both cost function optimization and its compatibility with the reported cases. The values pertaining to OHCA were linear and regular because of the regular surveys and absence of any simulation where no data existed. In many zones, the OHCA rate was either low or zero with negligible effect on the determination of output precision. The focus was on areas with high OHCA values.
Conclusion
The most important conclusion of this study is more accurate locating of defibrillators facilities. The results of the output precision evaluation obtained from these two algorithms verified the 27.36% superiority of PSO in presenting results that are more precise with greater convergence to reality. The proposed framework was developed by exact determination of weights using decision-making methods and by comparing the outputs of swarm intelligence methods with other methods such as genetic algorithm or neural networks. Furthermore, the data related to the reduction of mortality due to cardiac arrest following the use of cardiac rehabilitation defibrillators facilities can be efficiently applied to the process of determining of locations for these facilities and to the testing of the accuracy of the used methods.
Ethical considerations
Ethical issues (Including plagiarism, informed consent, misconduct, data fabrication and/or falsification, double publication and/or submission, redundancy, etc.) have been completely observed by the authors.
Acknowledgments
This work was supported by an INHA UNIVERSITY Research Grant. The authors declare that there is no conflict of interest.
References
- 1. Kurland KS, Gorr WL. ( 2012). Using ArcGIS Spatial Analyst for demand estimation, GIS Tutorial for Health. 4th Ed, Esri Press, pp.: 375– 414. [Google Scholar]
- 2. Anonymous ( 2004). Harvard medical school family health guide., public defibrillators. Available from: http://www.health.harvard.edu/fhg/updates/update0504a.shtml.
- 3. Riley DL, Krepostman S, Stewart DE, Suskin N, Arthur HM, Grace SL. ( 2009). A mixed methods study of continuity of care from cardiac rehabilitation to primary care physicians. Can J Cardiol, 25( 6): 187– 92. [DOI] [PMC free article] [PubMed] [Google Scholar]
- 4. Dolansky MA, Zullo MD, Hassanein S, Schaefer JT, Murray P, Boxer R. ( 2012). Cardiac rehabilitation in skilled nursing facilities: A missed opportunity. Heart & Lung. J Acute Crit Care, 41( 2): 115– 124. [DOI] [PMC free article] [PubMed] [Google Scholar]
- 5. Torabi A, Loh PH, Khan NK, Windram J, Lalukota K, Velavan P, Lammimam M, Cleland JGF. ( 2005). Prognosis of Developing Heart Failure Following ST Elevation (STEMI) and Non ST Elevation (NSTEMI) Infarct. Iran J Public Health, 34( Sup): 25– 26. [Google Scholar]
- 6. Nadimi M, Mahdavi M. ( 1973). Survey of prevalence rate of rheumatic fever and rheumatic heart disease among school children in Tehran. Iran J Public Health, 2( 2): 77– 89. [Google Scholar]
- 7. Taylor RS, Watt A, Dalal HM, Evans PH, Campbell JL, Read KLQ, Mourant AJ, Wingham J, Thompson DR, Pereira Gray DJ. ( 2007). Home-based cardiac rehabilitation versus hospital-based rehabilitation: A cost effectiveness analysis. Int J Cardiol, 119( 2): 196– 201. [DOI] [PubMed] [Google Scholar]
- 8. Soo L, Huff N, Gray D, Hampton JR. ( 2001). Geographical distribution of cardiac arrest in Nottinghamshire. Resuscitation, 48( 2): 137– 147. [DOI] [PubMed] [Google Scholar]
- 9. Holmberg M, Holmberg S, Herlitz J, Gårdelöv B. ( 1998). Survival after cardiac arrest outside hospital in Sweden. Resuscitation, 36 ( 1): 29– 36. [DOI] [PubMed] [Google Scholar]
- 10. Mohammadi N, Malek MR, Alesheikh A. ( 2009). Evaluation of Location/Allocation Methods in a Continuous Space Using Genetic Algorithm. IRECOS, 4( 6): 743– 748. [Google Scholar]
- 11. Kennedy J, Eberhart R. ( 1995). Particle swarm optimization. IEEE Int. Conf. Neural Networks, 4: 1942– 1948. [Google Scholar]
- 12. Dorigo M. Optimization, Learning and Natural Algorithms [PhD Thesis]. Politecnico di Milano, Italy; 1992. [Google Scholar]
- 13. RecheLópez P, RuizReyes N, García Galán S, Jurado F. ( 2009). Comparison of metaheuristic techniques to determine optimal placement of biomass power plants. Energy Convers Manage, 50: 2020– 2028. [Google Scholar]
- 14. Vera D, Carabias J, Jurado F, Ruiz Reyes N. ( 2010). A Honey Bee Foraging approach for optimal location of a biomass power plant. Applied Energy, 87: 2119– 2127. [Google Scholar]
- 15. Reche López P, Jurado F, Ruiz Reyes N, García Galán S, Gómez M. ( 2008). Particle swarm optimization for biomass-fuelled systems with technical Constraints. Eng Appl Artif Intel, 21: 1389– 1396. [Google Scholar]
- 16. Gómez M, López A, Jurado F. ( 2010). Optimal placement and sizing from standpoint of the investor of Photovoltaics Grid-Connected Systems using Binary Particle Swarm Optimization. Applied Energy, 87: 1911– 1918. [Google Scholar]
- 17. Huang B, Liu N, Chandramouli M. ( 2006). A GIS supported Ant algorithm for the linear feature covering problem with distance constraints. Decision Support Systems, 42: 1063– 1075. [Google Scholar]
- 18. Yapicioglu H, Smith AE, Dozier G. ( 2007). Solving the semi-desirable facility location problem using bi-objective particle swarm. Eur J Oper Res, 177( 2): 733– 749. [Google Scholar]
- 19. Fu Q, Wang Z, Jiang Q. ( 2010). Delineating soil nutrient management zones based on fuzzy clustering optimized by PSO. Math Comp Model, 51: 1299– 1305. [Google Scholar]
- 20. Hung KS, Su SF, Lee ZJ. ( 2007). Improving ant colony optimization algorithms for solving traveling salesman problems. JACIII, 11 ( 4): 433– 434. [Google Scholar]
- 21. Maniezzo V, Colorni A. ( 1999). The ant system applied to the quadratic assignment problem. IEEE T Knowl Data En, 11 ( 5): 769– 778. [Google Scholar]
- 22. Clerc M, Kennedy J. ( 2002). The particle swarm-explosion, stability and convergence in a multidimensional complex space. IEEE Trans Evol Comp, 6( 1): 58– 73. [Google Scholar]
- 23. EL-Zonkoly AM. ( 2006). Optimal tuning of power systems stabilizers and AVR gains using particle swarm optimization. Expert Syst Appl, 31( 939): 551– 557. [Google Scholar]
- 24. Shi Y, Eberhart RC. ( 1999). Empirical study of particle swarm optimization. Proceedings of the 1999 Congress on Evolutionary Computation, Piscataway, NJ, IEEE Service Center; , pp.: 1945– 1950. [Google Scholar]
- 25. Shifa M, Jianhua H, Feng L, Yan Y. ( 2011). Land-use spatial optimization based on PSO algorithm. Geo-spatial Info Sci, 14( 1): 54– 61. [Google Scholar]
- 26. O’hare W, Mather M. ( 2003). The growing number of kids in severely distressed neighborhoods: Evidence from the 2000 census. In kids count, a publication of the Annie E. Casey foundation and the population reference bureau, revised October 2003, Available from: http://www.aecf.org/upload/publicationfiles/da3622h1280.pdf.


