

Article first published online 31 August 2015.
Supplemental Digital Content is Available in the Text.
Key Words: Crohn's disease, autophagy, miRNA, AGO2, microbes
Background:
Autophagy is implicated in Crohn's disease (CD) pathogenesis. Recent evidence suggests autophagy regulates the microRNA (miRNA)-induced silencing complex (miRISC). Therefore, autophagy may play a novel role in CD by regulating expression of miRISC, thereby altering miRNA silencing. As microbes associated with CD can alter autophagy, we hypothesized that microbial disruption of autophagy affects the critical miRISC component AGO2.
Methods:
AGO2 expression was assessed in epithelial and immune cells, and intestinal organoids with disrupted autophagy. Microarray technology was used to determine the expression of downstream miRNAs in cells with defective autophagy.
Results:
Increased AGO2 was detected in autophagy-deficient ATG5−/− and ATG16−/− mouse embryonic fibroblast cells (MEFs) in comparison with wild-type MEFs. Chemical agents and VacA toxin, which disrupt autophagy, increased AGO2 expression in MEFs, epithelial cells lines, and human monocytes, respectively. Increased AGO2 was also detected in ATG7−/− intestinal organoids, in comparison with wild-type organoids. Five miRNAs were differentially expressed in autophagy-deficient MEFs. Pathway enrichment analysis of the differentially expressed miRNAs implicated signaling pathways previously associated with CD.
Conclusions:
Taken together, our results suggest that autophagy is involved in the regulation of the critical miRISC component AGO2 in epithelial and immune cells and primary intestinal epithelial cells. We propose a mechanism by which autophagy alters miRNA expression, which likely impacts the regulation of CD-associated pathways. Furthermore, as enteric microbial products can manipulate autophagy and AGO2, our findings suggest a novel mechanism by which enteric microbes could influence miRNA to promote disease.
Crohn's disease (CD) is a chronic, idiopathic inflammatory bowel disease (IBD), which can affect any area of the gastrointestinal (GI) tract. The current hypothesis suggests that in the genetically susceptible individual, there is an aberrant and prolonged immune response triggered by environmental factors such as commensal microbiota, which leads to persistent inflammation.1–3
GWAS have implicated novel and unexpected pathways in the development of IBD, and in particular, have highlighted the potential role of the autophagy pathway in disease pathogenesis.4–9 Autophagy is an evolutionary conserved mechanism for lysosomal degradation of cytosolic components and also plays an important role in the recognition of and defense against microbes.2 IBD-associated gene loci that influence the autophagy pathway include ATG16L1, IRGM, Nod2, and DAP.5–9 Furthermore, enteric microbes may also influence autophagy in intestinal epithelial cells,10,11 further linking disease development with microbial stimuli. Exactly how misregulated autophagy promotes the development of IBD is not clear. However, current evidence indicates that autophagy regulates bacterial clearance, inflammatory signaling, Paneth cell function, and antigen presentation.10–21 More recent studies also suggest that autophagy regulates microRNA (miRNA) homeostasis by degrading the miRNA-induced silencing complex (miRISC).22,23
miRNAs are small noncoding RNAs that regulate protein expression by binding to complementary messenger RNA resulting in translational repression or transcript degradation.24 Two enzymes (Dicer and Drosha) process miRNAs into mature miRNA that are incorporated into a miRISC to downregulate target gene expression. The Argonaute (AGO) proteins are key components of miRISC that bind miRNA and direct the miRNA to its target mRNA. AGO2 is a highly specialized member of the AGO family with the unique capability of directly cleaving complementary pre-miRNA targets to create a unique pool of miRNA independently of Dicer.24 AGO2 is also the most abundant AGO family member in many cell lines and changes in AGO2 expression can have profound effects on miRNA expression.25
miRNAs regulate thousands of genes thereby influencing numerous biological processes. Importantly, alterations in miRNA have been detected in intestinal tissues, serum and peripheral blood monocytes obtained from patients with CD.26 The observed changes in miRNA are thought to mediate CD pathogenesis by modulating proinflammatory and antiinflammatory cytokine expression, intestinal development, and mucosal barrier function.26 Exactly how miRNA profiles are altered in IBD remains unknown. We hypothesized that disruption of autophagy could alter AGO protein levels leading to changes in miRNA profiles and gene expression, thereby influencing disease pathogenesis. Importantly, as enteric microbes play a key role in the pathogenesis of CD, we hypothesized that microbial disruption of autophagy could influence the miRISC.
MATERIALS AND METHODS
Cell and Bacteria Growth Conditions
Atg5−/− and wild-type (WT) mouse embryonic fibroblast cells (MEF), human cervix epithelial cells (HeLa), and stably LC3-GFP transfected human breast epithelial cells (MDAMC) were grown in Dulbecco's modification of Eagle's medium supplemented with 10% fetal bovine serum. Growing conditions of Helicobacter pylori strain 60190 (ATTC 49503, CagA+ CagE+ VacA+) were as described previously.27
Generation and Maintenance of Atg7−/− Intestinal Organoids
Animal experiments were approved under Animal Use Protocols by the University Animal Care Committee at the University of Toronto. Mice deficient in Atg7 in the intestinal epithelium were generated by crossing Atg7f/f mice (provided by K. Tanaka) to those expressing the cre recombinase under control of the tamoxifen-inducible villin promoter (Vil-CreERT2) (provided by P. Brubaker, originally from S. Robine). After breeding, genotyping was performed to confirm the presence of the floxed Atg7 allele and the Vil-CreERT2 transgene in animals used for this study. Eight-week-old Atg7f/f/Vil-CreERT2 mice were administered 25 mg/kg of tamoxifen (Sigma-Aldrich, Oakville, Canada) or vehicle by intraperitoneal injection once daily for 3 days. After 10 days, animals were killed by cervical dislocation and ileal sections were retrieved, cut lengthwise, and villi removed by gentle scraping. The tissue was incubated in 5 mM EDTA in AdvanceSTEM ES Qualified DPBS (HyClone, Thermo Scientific, Rockford, IL) for 1 hour, after which the crypts were released by mechanical shaking in 1% fetal bovine serum in AdvanceSTEM ES Qualified DPBS. Crypts were isolated by centrifugation at 500g for 10 minutes and embedded in Matrigel (BD Biosciences, Mississauga, Canada). After Matrigel polymerization, embedded crypts were overlayed with advanced Dulbecco's modified Eagle medium/F12 (Life Technologies, Burlington, Canada) growth medium containing 50% conditioned Wnt3a-medium, 25% conditioned Rspo1-medium and 10% conditioned noggin-medium, supplemented with 200 mM l-glutamine, 1 mM HEPES, 1% N2, 2% B27 (all from Life Technologies), 50 ng/mL endothelial growth factor (R&D Systems, Minneapolis, MN), 100 ng/mL FGF-10 (PeproTech, Rocky Hill, NJ), 1 μM N-acetyl-cysteine, 10 μM Y-27632, 10 mM nicotinamide (all from Sigma-Aldrich), 1 μM TGFβi (A-83-01; Tocris, Bristol, United Kingdom), and penicillin/streptomycin. Organoids were maintained by replacing culture media every 2 to 3 days and passaging every 7 to 8 days at a ratio of 1:6. For immunoblotting, the Matrigel was dissociated from the organoids on day 5 of culture using Dispase (Corning, Tewksbury, MA). Next, Dispase was inactivated using 5 mM EDTA. Organoids were then centrifuged at 500g for 5 minutes, washed 3 times with phosphate-buffered saline (PBS), and lysed in RIPA buffer for 30 minutes on ice.
Isolation of Peripheral Blood Monocytes
Venous blood was drawn from healthy genotyped volunteers who carry the ATG16L1 CD-protective allele of rs2241880 in sterile EDTA coated tubes (BD Vacutainer, BD Biosciences) diluted 1:1 with pyrogen-free saline and layered over Ficoll-Paque (GE Healthcare Sciences, Mississauga, Canada). Approval for the study was provided by the local ethics board (Approval Number MSH REB 02-0234-E). Cells were spun at 400g for 30 minutes to obtain the mononuclear cell fractionation by means of density centrifugation, washed, and suspended in culture medium. Cells were counted and plated in 6-well culture plates.
Immunofluorescence
Following treatments with various stimuli, cells were washed with PBS, fixed for 20 minutes in 4% paraformaldehyde in PBS, permeabilized by incubation in 0.1% Triton X-100 in PBS for 20 minutes, and blocked for 1 hour with 5% milk in PBS. Permeabilized cells were incubated overnight at 4°C with primary antibody diluted in 5% milk in PBS: 1:200 rabbit polyclonal AGO2 antibody (Abcam, Toronto, Canada), and 1:1000 rabbit polyclonal p62 antibody (Santa Cruz Biotechnology, Santa Cruz, CA). Cells were then washed with PBS, and incubated for 1 hour at room temperature with secondary Cy3-conjugated antibodies (Jackson ImmunoResearch, West Grove, PA). Confocal image acquisition was performed in a Quorum Spinning Disk Confocal Microscope.
Immunoblotting
Cells were put on ice, washed with PBS, and scraped with 100 μL of ice-cold RIPA buffer. Cell suspensions were centrifuged and supernatants either stored at −80°C or immediately boiled at 100°C with 1× Laemmli buffer for 5 minutes. Equal amounts of protein were run on 7% to 12% sodium dodecyl sulfate polyacrylamide gel electrophoresis. Proteins were then transferred onto a nitrocellulose membrane that was blocked with 5% milk in Tris-buffered saline with tween and probed with antibodies diluted in 5% milk in Tris-buffered saline with tween: 1:500 AGO2 rabbit polyclonal antibody (Abcam), 1:2000 LC3 rabbit polyclonal antibody (Novus Biologicals, Oakville, Canada), or 1:1000 GFP rabbit polyclonal antibody (Invitrogen, Life Technologies) and developed with the appropriate horseradish peroxidase–conjugated secondary antibody. Immunoblotting images were captured and quantitated using FluorChem FCII software. Densities of AGO2 and β-actin were measured for each treatment and expressed as ratio of AGO2-to-β-actin (AGO2/β-actin). For graphic representation, fold increase was expressed as AGO2/β-to-actin ratio for each treatment to AGO2/β-to-actin ratio for control cells.
Statistical Analysis
All experiments were performed at least 3 times (n ≥ 3). The Student's t test or analysis of variance and Dunnet's post hoc tests were performed to compare the mean ± SE for treatment groups using GraphPad Prism 6. P < 0.05 was determined to be statistically significant.
miRNA Expression Assay
Cells were washed with PBS and 200 μL of trypsin was added until the cells detached from the plate. Trypsin was neutralized with 500 μL of Dulbecco's modified Eagle medium. Cells were then spun at 300g for 10 minutes, supernatants were aspirated and 500 μL of PBS was added. Cells were spun again at 300g for 5 minutes, and frozen at −80°C. Total RNA was extracted using with miRNeasy mini kit (Qiagen, Toronto, Canada). Total RNA from 3 experiments was processed using the NanoString nCounter mouse miRNA expression assay, which contains more than 600 mouse and mouse-associated viral miRNAs derived from miRBase (Release 15.0).
Probes matching 8 foreign short RNA sequences were used as negative controls to assess the background. Six foreign short RNA sequences were added to the samples in predetermined concentrations to be used as positive controls and account for experimental platform variation. Raw data obtained were normalized to positive spike-in RNA hybridization controls. Then, the data were normalized to the top 100 expressed miRNAs to account for sample input variation. A background threshold of mean ± 2SD of the negative control counts was subtracted from miRNA counts. A 1-sided, heteroscedastic t test was performed to statistically determine whether an miRNA is detected in the sample by assessing the likelihood of the miRNA counts being significantly different from the negative controls counts. Percent coefficient of variation was calculated to detect miRNA counts that do not display similar pattern to their other biological replicates. miRNAs with positive counts after background subtraction significantly different from the negative control counts, and with less than 45% variation across triplicates, were considered as detected.
miRNA Expression Data Analysis
Batch effects caused by experiment and processing date were estimated with a mixed model analysis of variance using Partek Genomics Suite, version 6.6. Each of the batches contained a combination of control and treated cells in a balanced proportion. The batch effects were removed from the data and the expression values were adjusted to remove batch-to-batch differences. Unsupervised methods of data analysis were performed: hierarchical clustering using Pearson dissimilarity and complete linkage method; principal component analysis. Kolmogorov–Smirnov and Fligner–Killeen tests were performed using R (http://www.r-project.org/) to assess whether the distribution of miRNA expression is normal and whether variances are homogeneous in the data. Analysis of variance was performed using R and verified using Partek Genomics Suite. Raw P values were then corrected for multiple hypotheses testing using the false discovery rate (FDR) method.28
Target identification for differentially expressed miRNA was performed using the miRNA target filter in ingenuity pathway analysis. Canonical pathways analysis identified the pathways from the ingenuity pathway analysis library of canonical pathways that were most significant to our data set of aberrant miRNA and the target mRNA. The significance of the association between our data set and the canonical pathway was measured by the ratio of number of data set molecules that map to the canonical pathway divided by the total number of molecules that map to that pathway. A Fisher's exact test was used to calculate a P value determining the probability that the association between the genes in the data set and the canonical pathway is explained by chance alone. Functional analysis identified the biological functions and/or diseases that were most significant to the molecules in the network. Right-tailed Fisher's exact test was used to calculate a P value determining the probability that each biological function and/or disease assigned to that network is due to chance alone.
RESULTS
Disrupted Autophagy Increases AGO2
Because AGO2 levels can influence miRNA generation, we sought to determine if autophagy regulated AGO2 expression. We compared AGO2 expression in WT and autophagy-deficient Atg5−/− MEFs. ATG5−/− cells displayed an increase in AGO2 in comparison with WT MEFs when assessed by western blotting and confocal imaging (Fig. 1). Next, we treated the cells with bafilomycin, which prevents acidification of lysosomes by inhibiting the vacuolar type H(+)-ATPase (V-ATPase), thereby blocking degradation of autophagic cargo. WT cells treated with bafilomycin displayed an increase in AGO2 (Fig. 1). Bafilomycin treatment did not result in a further increase in AGO2 levels in autophagy-deficient Atg5−/− MEFs indicating that the effect of bafilomycin was indeed mediated through changes in autophagic flux.
FIGURE 1.
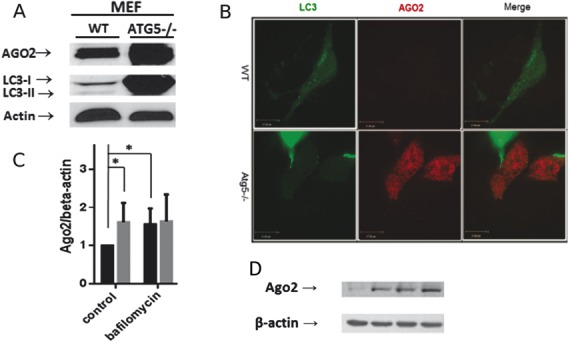
Autophagy-deficient MEF cells display increased AGO2. A, Representative Western blot for AGO2 and LC3 in lysates obtained from Atg5−/− or WT cells. B, Representative confocal image of ATG5−/− or WT LC3-GFP expressing cells. LC3 is depicted in green. AGO2 is depicted in red. C, Graph depicts quantification of AGO2 relative to β-actin levels (n = 5 experiments; *P < 0.05). D, Representative Western blot for AGO2 and LC3 in lysates obtained from Atg5−/− or WT cells treated with bafilomycin to disrupt autophagy.
We next determined whether the effect of autophagy inhibition on AGO2 levels was unique to MEFs or could be generalized to epithelial cells. MDAMC human breast epithelial cells were treated with ATG12 siRNA to disrupt autophagy. As shown in Figure 2A, ATG12 siRNA-treated cells demonstrated an increase in the free cytosolic form LC3-I, indicating autophagy is indeed inhibited at the induction step due to knockdown of ATG12. An increase in AGO2 was detected in ATG12 siRNA-treated cells in comparison with control cells.
FIGURE 2.

Disruption of autophagy increases AGO2 in MDAMC cells. A, Western blotting for AGO2 and LC3 in lysates obtained from MDAMC cells treated with control siRNA, ATG12 siRNA, or VacA. B, Graph depicts quantification of AGO2 relative to β-actin levels (n = 3 experiments **P < 0.01, analysis of variance with Dunnett's post hoc test). C, Representative confocal image of LC3-GFP expressing control siRNA or ATG12 siRNA cells, in the presence or absence of VacA. LC3 is depicted in green, AGO2 is depicted in red, and p62 is depicted in blue.
Having demonstrated that genetic or chemical disruption of autophagy increases AGO2, we next determined if GI microbial disruption of autophagy altered AGO2. To perform these studies, we used the vacuolating cytotoxin (VacA) from the GI pathogen H. pylori, which we have shown disrupts autophagosome maturation.16 As shown in Figure 2, an increase in LC3-II indicative of disrupted autophagic flux at the autolysosome stage was detected in VacA-treated cells. In comparison with control cells, VacA-treated cells displayed an increase in AGO2 as assessed by western blotting (Fig. 2A). We next used immunofluorescent confocal microscopy to assess AGO2 levels in LC3-GFP expressing MDAMC cells (Fig. 2B). Control cells treated with scrambled siRNA exhibited green puncta indicative of basal autophagy. In ATG12 siRNA-treated cells following incubation with VacA, LC3-GFP puncta were not detected and p62, an adaptor protein that directs ubiquitylated cargo to the autophagosome for degradation, was increased indicating autophagy was disrupted. Both ATG12 siRNA and VacA-treated cells showed an increase in AGO2 in comparison with control cells. Similar to MDAMC cells, VacA treatment caused an increase in AGO2 in HeLa cells (see Fig., Supplemental Digital Content 1, http://links.lww.com/IBD/B48).
Next, we determined the effect of autophagy disruption on AGO2 in immune cells by employing peripheral blood monocytes obtained from healthy volunteers. Peripheral blood monocytes were isolated, cultured, and treated with VacA or bafilomycin. AGO2 levels were significantly increased in cells treated with VacA or bafilomycin (Fig. 3).
FIGURE 3.
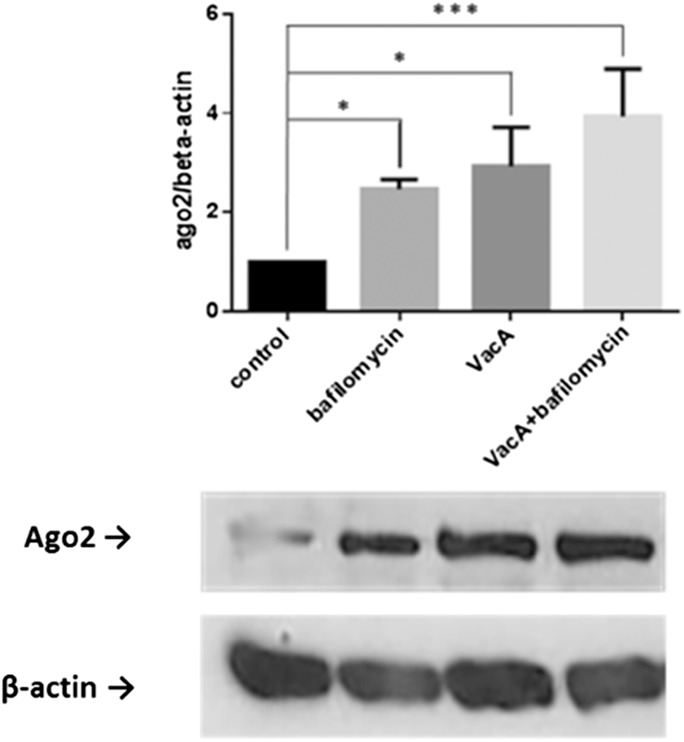
Disruption of autophagy increases AGO2 in human PBMC. Western blot of AGO2 in lysates obtained from control human peripheral blood monocytes or following treatment with VacA or bafilomycin. Graph depicts quantification of AGO2 relative to β-actin levels (n = 3 experiments; *P < 0.05, ***P < 0.001 analysis of variance and Dunnett's post hoc test).
To extend our in vitro studies to a physiologic model of the intestinal epithelium, we employed intestinal organoids generated from control or Atg7−/− autophagy-deficient mice. Similar to our findings in cell lines, an increase in AGO2 was detected in primary intestinal cell lysates obtained from Atg7−/− organoids in comparison with WT organoids (Fig. 4).
FIGURE 4.
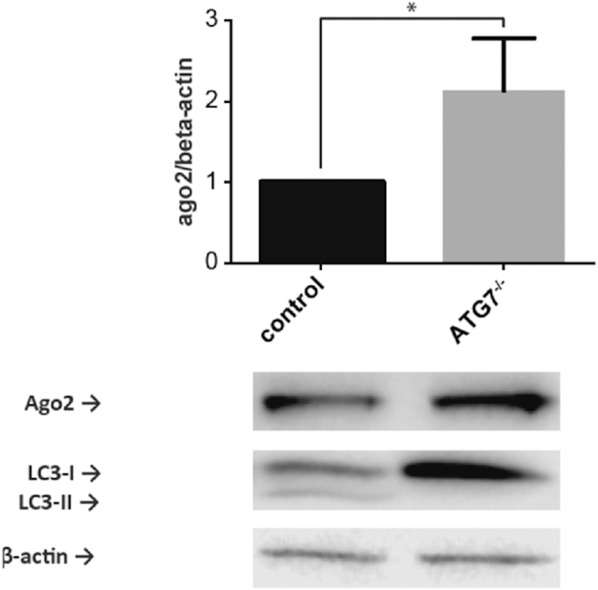
AGO2 is increased in autophagy-deficient intestinal organoids. Representative Western blot for AGO2 in lysates obtained from Atg7−/− or WT intestinal organoids. Graph depicts quantification of AGO2 relative to β-actin levels (n = 5 experiments; *P < 0.05).
Disrupted Autophagy Leads to Differential Expression of miRNA
As our results indicated that autophagy modulates AGO2, a critical effector of miRNA silencing, we further hypothesized that miRNA expression would be altered in cells with defective autophagy compared with cells with normal autophagy. We assessed whether disrupted autophagy affects miRNA expression using the NanoString nCounter system and compared miRNA profiles between 4 experimental conditions: WT MEF cells as control cells, WT MEF treated with bafilomycin, Atg5−/− MEF untreated cells, and Atg5−/− MEF treated with bafilomycin. Each miRNA microarray assay was performed on 3 biological replicates of each condition, with a total of 12 samples.
A total of 43 miRNAs had counts greater than the background threshold, with counts significantly different from the negative control counts (P < 0.05). Principal component analysis demonstrated a distinct subgrouping of the samples according to cell type (Fig. 5). Unsupervised hierarchal clustering also distinguished between the 2 subgroups of WT cells and autophagy-deficient Atg5−/− cells (Fig. 6).
FIGURE 5.
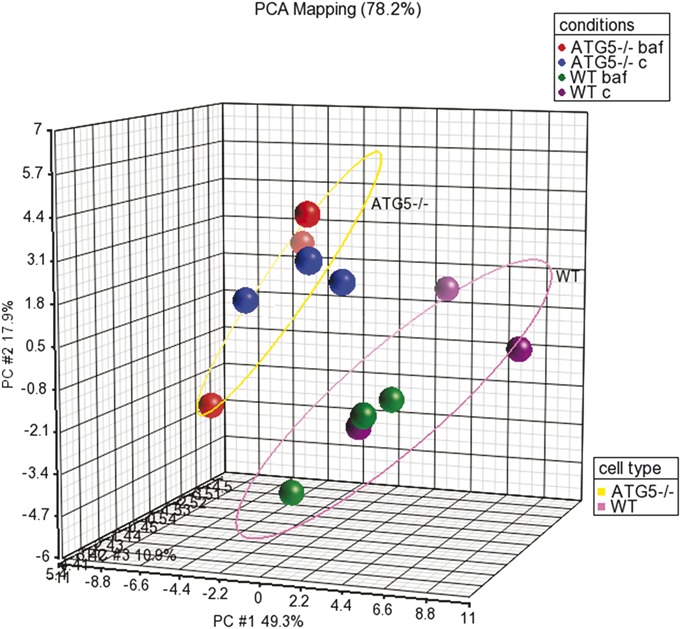
Principal component analysis of miRNA expression demonstrates 2 distinct subgroupings according to cell type. Samples are colored according to experimental conditions: WT cells untreated are colored purple, WT cells treated with bafilomycin are colored green, Atg5−/− cells untreated are colored blue, and Atg5−/− cells treated with bafilomycin are colored red. A pink ellipse circles all WT cells, whereas a yellow ellipse circles all Atg5−/− cells.
FIGURE 6.
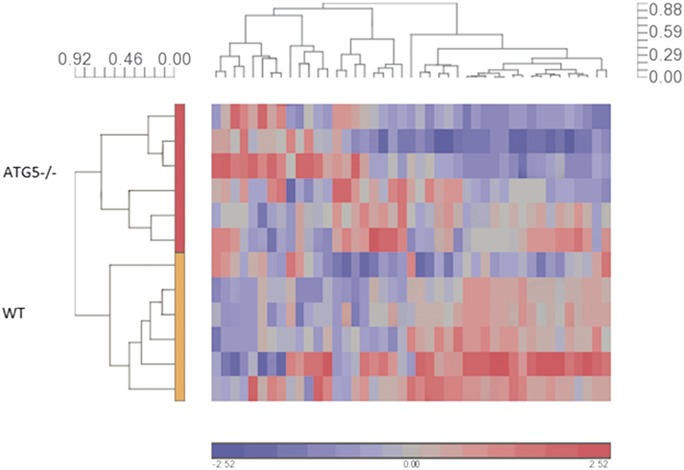
Unsupervised hierarchical clustering analysis of miRNA expression demonstrates 2 distinct subgroupings according to cell type. Hierarchical clustering was performed with the Pearson dissimilarity (value scale next to clusters) and complete clustering method, which indicates a clear subgrouping according to cell type (vertical cluster), with the top subcluster for autophagy-deficient cells and the bottom subcluster for WT cells. The horizontal cluster indicates subgrouping of detected miRNA expression patterns. The color scale designates color to fold changes, with blue indicating a downregulation and red indicating an upregulation.
We next performed a supervised analysis, which highlighted 5 miRNAs with fold change equal or greater than ±1.49 and an FDR-adjusted P < 0.05 (Table 1) between WT cells, untreated and treated with bafilomycin, and Atg5−/− cells, untreated and treated with bafilomycin. Indeed, this trend was indicated in the unsupervised analysis as well. A hierarchical clustering analysis of the supervised gene set is presented in Figure 7.
TABLE 1.
miRNA Are Differentially Expressed in WT Versus Atg5−/− MEFs
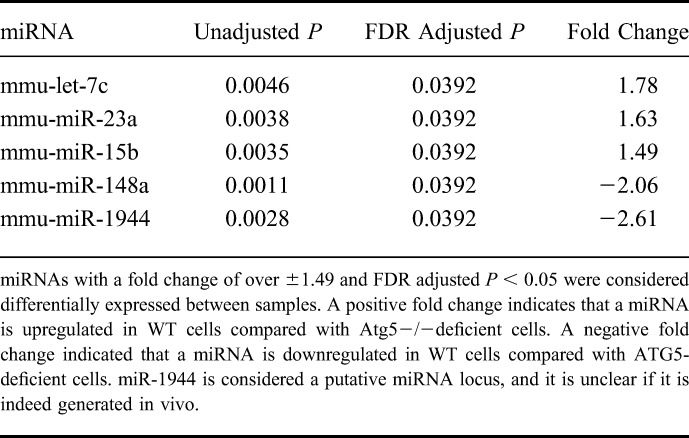
FIGURE 7.
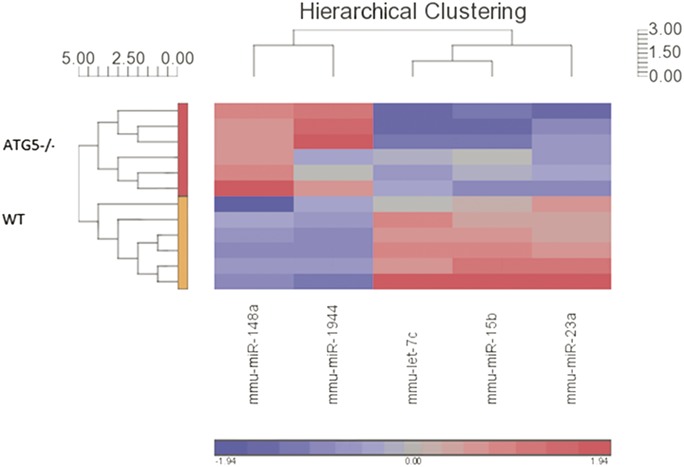
Hierarchical clustering analysis of the differentially expressed miRNAs. Hierarchical clustering was performed with the Pearson dissimilarity (value scale next to clusters) and complete clustering method, which indicates a clear subgrouping according to cell type (vertical cluster), with the top subcluster for autophagy-deficient cells and the bottom subcluster for WT cells. The horizontal cluster indicates subgrouping of detected miRNA expression patterns and indicates 2 subgroups: miR-148a and miR-1944 that are downregulated in WT cells (blue color scale), and let-7c, miR-15b, and miR-23a that are upregulated in WT cells (red color scale).
Pathway enrichment analysis was performed to discover genes and canonical pathways that are regulated by the aberrant miRNAs. Since it is unclear whether the putative miR-1944 gene is indeed processed in vivo,30 4 miRNAs were included in the analysis. miR-148a, miR-15b, miR-23a, and let-7c have been experimentally observed to target 315 mRNA. The top canonical pathways with significant changes under disrupted autophagy conditions are listed in Figure 8. Examining interconnected genes from the data set and their function highlights several top biological networks with a Fisher's exact test P < 1 × 10⁻³⁰, such as GI disease, gene expression mechanisms, cellular function and maintenance, and cancer.
FIGURE 8.
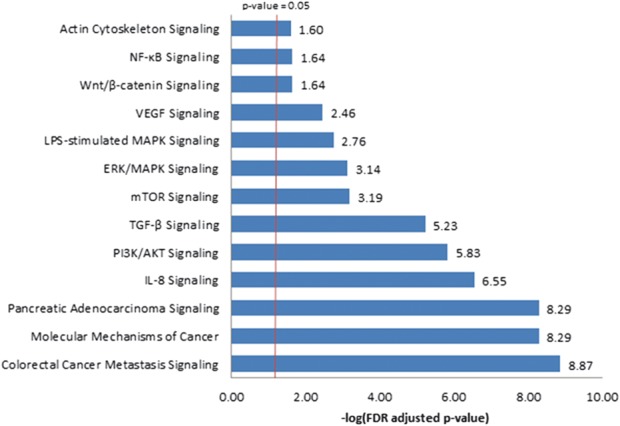
Top canonical pathways predicted to be regulated by the differentially expressed miRNAs. Ingenuity pathway analysis software was used to identify experimentally validated mRNA targets of the 4 aberrant miRNAs and to identify the canonical pathways that were most significant to this data set. The significance of the association between the data set and the canonical pathway is presented here as the result of a Fisher's exact test to calculate a P value determining the probability that the association between the genes in the data set and the canonical pathway is explained by chance alone. Pathways with enrichment FDR adjusted P < 0.05 are presented. The negative logarithm of the FDR adjusted P value is listed next to each bar.
DISCUSSION
Our results demonstrate an increase in AGO2 levels, a critical miRISC component, in cells with altered autophagy. We have verified that AGO2 is increased in multiple cell lines, including epithelial, endothelial (data not shown), and immune cells of myeloid origin following a variety of complementary means to inhibit autophagy. Importantly, an increase in AGO2 was also identified in primary epithelial cells in intestinal organoids with disrupted autophagy. This observation across numerous cell types proposes a universal mechanism and a central role for autophagy in regulation of AGO2, a crucial miRNA modulator.
Autophagy serves as a host defense mechanism to promote bacterial clearance. Therefore, certain microbes have developed mechanisms to evade this protective host response. Here, we demonstrate that disruption of autophagy by an enteric microbial toxin results in an increase in AGO2 in both epithelial and immune cells in vitro. Recent evidence indicates that adherent invasive Escherichia coli, which colonizes the ileum of patients with CD and is implicated in disease pathogenesis, can inhibit autophagy.10 Whether or not inhibition of autophagy by enteric microbes such as adherent invasive E. coli alters AGO2 in vivo remains unknown.
The exact mechanisms by which disrupted autophagy causes AGO2 to increase remains to be determined. We were unable to detect colocalization of AGO2 with LC3 by confocal microscopy, suggesting that AGO2 may not be specifically targeted to autophagosomes. Alternatively, changes in AGO2 expression may occur through an indirect mechanism as a result of disrupting autophagy. For example, miRISC components might be degraded by the proteasome, which can also be affected by autophagy disruption.31–33 Disruption of autophagy can impair proteasome-mediated degradation.32 Alternatively, disrupted autophagy could alter AGO2 transcription.
To determine if changes in AGO2 would result in the corresponding changes in miRNA expression, we compared miRNA expression profiles in control cells and cells with disrupted autophagy. To explore for patterns of miRNA expression, we used unsupervised analysis methods on the microarray data set, which indicated a distinct division between WT and ATG5 knockout cells. As autophagy is already disrupted in the ATG5 knockout cells, bafilomycin treatment was not expected to affect autophagy in these cells. Indeed, the unsupervised analyses did not show a subdivision of Atg5−/− samples according to untreated cells and bafilomycin-treated cells. In addition, the unsupervised analyses did not show subgrouping of WT cells according to untreated cells and bafilomycin-treated cells. However, this finding may be due to the number of WT samples (n = 6). Alternatively, as suggested previously, short-term treatment with bafilomycin may not allow enough time for alterations in miRNA expression.22
Using a supervised analysis, a significant change in expression of 5 miRNAs was detected between WT cells and ATG5 knockout cells. In this study, we picked a high stringency background of mean negative control counts plus 2 standard variations, as well as setting the FDR-adjusted P value threshold at 0.05, which may account for the relatively short list of discovered aberrant miRNAs. Because miRNA differ in their affinity to the different AGO proteins, and miRNA levels are sensitive to AGO2 levels, this list of aberrant miRNA might represent a subset of miRNAs that have increased affinity to AGO2.
This study highlighted 4 experimentally validated miRNAs: miR-148a, miR-15b, miR-23a, and let-7c that were altered in autophagy-deficient cells. The let-7 miRNA family plays a key role in regulation of inflammation.34 Let-7 miRNA family also regulates interleukin 6 and interleukin 10 cytokine expression. Let-7 miRNA also regulates TLR4 signaling, and microbial infection downregulates let-7 expression, which in turn increases TLR signaling and bacterial sensing.29 Moreover, let-7c and miR-23a have been associated with active ulcerative colitis.35,36 All the identified miRNAs have been linked to colorectal cancer.37,38
Interestingly, pathway enrichment analysis has highlighted several canonical pathways that have been implicated in CD previously. The Wnt/β-catenin and actin cytoskeleton signaling pathways are regulators of the mucosal barrier,39 which is linked to pathogenesis of CD.1 Actin cytoskeleton signaling was also shown to regulate NFκB activation by Nod2.40 Transcription factor 4 is involved in Wnt signaling and among other functions regulates Paneth cells. Reduced transcription factor 4 expression is linked to CD and the characteristic Paneth cell abnormalities and dysfunction.41 Vascular endothelial growth factor and transforming growth factor beta altered expression are also associated with CD.42–44 Finally, mitogen-activated protein kinase signaling regulates various processes such as proliferation, differentiation, inflammation and apoptosis, and mTOR signaling.
Taken together, our findings suggest a novel mechanism by which autophagy regulates miRISC components, hence altering miRNA expression. Importantly, microbes that disrupt the autophagy pathway result in altered AGO2 expression. As aberrant expression of miRNA has been implicated in CD, these results provide a novel potential mechanism by which altered autophagy is involved in CD pathogenesis (Fig. 9).
FIGURE 9.

Model for altered autophagy involvement in CD pathogenesis. Altered autophagy, which could occur through host genetic variation, defective microbial sensing, or microbial disruption of autophagy, leads to increase in AGO2 levels. Altered AGO2, a critical regulator of miRNA silencing, leads to aberrant miRNA profiles in cells with disrupted autophagy. Altered miRNA profiles affect inflammatory and metabolic pathways that have been implicated in CD.
Supplementary Material
Footnotes
Supplemental digital content is available for this article. Direct URL citations appear in the printed text and are provided in the HTML and PDF versions of this article on the journal's Web site (www.ibdjournal.org).
Supported by the Crohn's and Colitis Canada (CCC) Operating Grant to N. L. Jones; Canadian Association of Gastroenterology (CAG)/CCC/Canadian Institute of Health Research (CIHR) Fellowship to L. Greenfield; Canadian Digestive Health Foundation/CAG/Ivan Beck Award to D. M. Rodrigues; CIHR Operating grant to D. J. Philpott; M. S. Silverberg is supported by the Gale and Graham Wright Research Chair in Digestive Disease and the Zane Cohen Centre for Digestive Diseases at Mount Sinai Hospital.
REFERENCES
- 1.Baumgart DC, Carding SR. Inflammatory bowel disease: cause and immunobiology. Lancet. 2007;369:1627–1640. [DOI] [PubMed] [Google Scholar]
- 2.Khor B, Gardet A, Xavier RJ. Genetics and pathogenesis of inflammatory bowel disease. Nature. 2011;474:307–317. [DOI] [PMC free article] [PubMed] [Google Scholar]
- 3.Dalal SR, Chang EB. The microbial basis of IBD. J Clin Invest. 2014;124:4190–4196. [DOI] [PMC free article] [PubMed] [Google Scholar]
- 4.Franke A, McGovern DP, Barrett JC, et al. Genome-wide meta-analysis increases to 71 the number of confirmed Crohn's disease susceptibility loci. Nat Genet. 2010;42:1118–1125. [DOI] [PMC free article] [PubMed] [Google Scholar]
- 5.Hampe J, Franke A, Rosenstiel P, et al. A genome-wide association scan of nonsynonymous SNPs identifies a susceptibility variant for Crohn disease in ATG16L1. Nat Genet. 2007;39:207–211. [DOI] [PubMed] [Google Scholar]
- 6.McCarroll SA, Huett A, Kuballa P, et al. Deletion polymorphism upstream of IRGM associated with altered IRGM expression and Crohn's disease. Nat Genet. 2008;40:1107–1112. [DOI] [PMC free article] [PubMed] [Google Scholar]
- 7.Parkes M, Barrett JC, Prescott NJ, et al. Sequence variants in the autophagy gene IRGM and multiple other replicating loci contribute to Crohn's disease susceptibility. Nat Genet. 2007;39:830–832. [DOI] [PMC free article] [PubMed] [Google Scholar]
- 8.Rioux JD, Xavier RJ, Taylor KD, et al. Genome-wide association study identifies new susceptibility loci for Crohn disease and implicates autophagy in disease pathogenesis. Nat Genet. 2007;39:596–604. [DOI] [PMC free article] [PubMed] [Google Scholar]
- 9.Zhang HF, Qiu LX, Chen Y, et al. ATG16L1 T300A polymorphism and Crohn's disease susceptibility: evidence from 13,022 cases and 17,532 controls. Hum Genet. 2009;125:627–631. [DOI] [PubMed] [Google Scholar]
- 10.Nguyen HT, Dalmasso G, Muller S, et al. Crohn's disease-associated adherent invasive Escherichia coli modulate levels of microRNAs in intestinal epithelial cells to reduce autophagy. Gastroenterology. 2014;146:508–519. [DOI] [PubMed] [Google Scholar]
- 11.Cadwell K, Patel KK, Maloney NS, et al. Virus-plus-susceptibility gene interaction determines Crohn's disease gene Atg16L1 phenotypes in intestine. Cell. 2010;141:1135–1145. [DOI] [PMC free article] [PubMed] [Google Scholar]
- 12.Cadwell K, Liu JY, Brown SL, et al. A key role for autophagy and the autophagy gene Atg16l1 in mouse and human intestinal Paneth cells. Nature. 2008;456:259–263. [DOI] [PMC free article] [PubMed] [Google Scholar]
- 13.Shi CS, Shenderov K, Huang NN, et al. Activation of autophagy by inflammatory signals limits IL-1beta production by targeting ubiquitinated inflammasomes for destruction. Nat Immunol. 2012;13:255–263. [DOI] [PMC free article] [PubMed] [Google Scholar]
- 14.Saitoh T, Fujita N, Jang MH, et al. Loss of the autophagy protein Atg16L1 enhances endotoxin-induced IL-1beta production. Nature. 2008;456:264–268. [DOI] [PubMed] [Google Scholar]
- 15.Travassos LH, Carneiro LA, Ramjeet M, et al. Nod1 and Nod2 direct autophagy by recruiting ATG16L1 to the plasma membrane at the site of bacterial entry. Nat Immunol. 2010;11:55–62. [DOI] [PubMed] [Google Scholar]
- 16.Raju D, Hussey S, Ang M, et al. Vacuolating cytotoxin and variants in Atg16L1 that disrupt autophagy promote helicobacter pylori infection in humans. Gastroenterology. 2012;142:1160–1171. [DOI] [PMC free article] [PubMed] [Google Scholar]
- 17.Plantinga TS, Crisan TO, Oosting M, et al. Crohn's disease-associated ATG16L1 polymorphism modulates pro-inflammatory cytokine responses selectively upon activation of NOD2. Gut. 2011;60:1229–1235. [DOI] [PubMed] [Google Scholar]
- 18.Cooney R, Baker J, Brain O, et al. NOD2 stimulation induces autophagy in dendritic cells influencing bacterial handling and antigen presentation. Nat Med. 2010;16:90–97. [DOI] [PubMed] [Google Scholar]
- 19.Lapaquette P, Glasser AL, Huett A, et al. Crohn's disease-associated adherent-invasive E. coli are selectively favoured by impaired autophagy to replicate intracellularly. Cell Microbiol. 2010;12:99–113. [DOI] [PMC free article] [PubMed] [Google Scholar]
- 20.Kuballa P, Huett A, Rioux JD, et al. Impaired autophagy of an intracellular pathogen induced by a Crohn's disease associated ATG16L1 variant. PLoS One. 2008;3:e3391. [DOI] [PMC free article] [PubMed] [Google Scholar]
- 21.Sorbara MT, Ellison LK, Ramjeet M, et al. The protein ATG16L1 suppresses inflammatory cytokines induced by the intracellular sensors Nod1 and Nod2 in an autophagy-independent manner. Immunity. 2013;39:858–873. [DOI] [PubMed] [Google Scholar]
- 22.Gibbings DJ, Mostowy S, Jay F, et al. Selective autophagy degrades DICER and AGO2 and regulates miRNA activity. Nat Cell Biol. 2012;14:1314–1321. [DOI] [PMC free article] [PubMed] [Google Scholar]
- 23.Zhang P, Zhang H. Autophagy modulates miRNA-mediated gene silencing and selectively degrades AIN-1/GW182 in C. elegans. EMBO Rep. 2013;14:568–576. [DOI] [PMC free article] [PubMed] [Google Scholar]
- 24.Cifuentes D, Xue H, Taylor DW, et al. A novel miRNA processing pathway independent of Dicer requires Argonaute2 catalytic activity. Science. 2010;328:1694–1698. [DOI] [PMC free article] [PubMed] [Google Scholar]
- 25.Zhou Y, Chen L, Barlogie B, et al. High-risk myeloma is associated with global elevation of miRNAs and overexpression of EIF2C2/AGO2. Proc Natl Acad Sci U S A. 2010;107:7904–7909. [DOI] [PMC free article] [PubMed] [Google Scholar]
- 26.Kalla R, Ventham NT, Kennedy NA, et al. MicroRNA's: new players in IBD. Gut. 2015;64:504–517. [DOI] [PMC free article] [PubMed] [Google Scholar]
- 27.Terebiznik MR, Vazquez CL, Torbicki K, et al. Helicobacter pylori VacA toxin promotes bacterial intracellular survival in gastric epithelial cells. Infect Immun. 2006;74:6599–6614. [DOI] [PMC free article] [PubMed] [Google Scholar]
- 28.Benjamini Y, Hochberg Y. Controlling the false discovery rate: a practical and powerful approach for multiple testing. J R Stat Soc. 1995;57:289–300. [Google Scholar]
- 29.Androulidaki A, Iliopoulos D, Arranz A, et al. The kinase Akt1 controls macrophage response to lipopolysaccharide by regulating microRNAs. Immunity. 2009;31:220–231. [DOI] [PMC free article] [PubMed] [Google Scholar]
- 30.Chiang HR, Schoenfeld LW, Ruby JG, et al. Mammalian microRNAs: experimental evaluation of novel and previously annotated genes. Genes Dev. 2010;24:992–1009. [DOI] [PMC free article] [PubMed] [Google Scholar]
- 31.Ding WX, Ni HM, Gao W, et al. Linking of autophagy to ubiquitin-proteasome system is important for the regulation of endoplasmic reticulum stress and cell viability. Am J Pathol. 2007;171:513–524. [DOI] [PMC free article] [PubMed] [Google Scholar]
- 32.Korolchuk VI, Mansilla A, Menzies FM, et al. Autophagy inhibition compromises degradation of ubiquitin-proteasome pathway substrates. Mol Cell. 2009;33:517–527. [DOI] [PMC free article] [PubMed] [Google Scholar]
- 33.Korolchuk VI, Menzies FM, Rubinsztein DC. A novel link between autophagy and the ubiquitin-proteasome system. Autophagy. 2009;5:862–863. [DOI] [PubMed] [Google Scholar]
- 34.Schulte LN, Eulalio A, Mollenkopf HJ, et al. Analysis of the host microRNA response to Salmonella uncovers the control of major cytokines by the let-7 family. EMBO J. 2011;30:1977-1989. [DOI] [PMC free article] [PubMed] [Google Scholar]
- 35.Takagi T, Naito Y, Mizushima K, et al. Increased expression of microRNA in the inflamed colonic mucosa of patients with active ulcerative colitis. J Gastroenterol Hepatol. 2010;25(suppl 1):S129–S133. [DOI] [PubMed] [Google Scholar]
- 36.Wu F, Zikusoka M, Trindade A, et al. MicroRNAs are differentially expressed in ulcerative colitis and alter expression of macrophage inflammatory peptide-2 alpha. Gastroenterology. 2008;135:1624–1635 e1624. [DOI] [PubMed] [Google Scholar]
- 37.Chen Y, Song Y, Wang Z, et al. Altered expression of MiR-148a and MiR-152 in gastrointestinal cancers and its clinical significance. J Gastrointest Surg. 2010;14:1170–1179. [DOI] [PubMed] [Google Scholar]
- 38.Slaby O, Svoboda M, Michalek J, et al. MicroRNAs in colorectal cancer: translation of molecular biology into clinical application. Mol Cancer. 2009;8:102. [DOI] [PMC free article] [PubMed] [Google Scholar]
- 39.Banan A, Zhang Y, Losurdo J, et al. Carbonylation and disassembly of the F-actin cytoskeleton in oxidant induced barrier dysfunction and its prevention by epidermal growth factor and transforming growth factor alpha in a human colonic cell line. Gut. 2000;46:830–837. [DOI] [PMC free article] [PubMed] [Google Scholar]
- 40.Legrand-Poels S, Kustermans G, Bex F, et al. Modulation of Nod2-dependent NF-kappaB signaling by the actin cytoskeleton. J Cell Sci. 2007;120:1299–1310. [DOI] [PubMed] [Google Scholar]
- 41.Wehkamp J, Wang G, Kubler I, et al. The Paneth cell alpha-defensin deficiency of ileal Crohn's disease is linked to Wnt/Tcf-4. J Immunol. 2007;179:3109–3118. [DOI] [PubMed] [Google Scholar]
- 42.Kader HA, Tchernev VT, Satyaraj E, et al. Protein microarray analysis of disease activity in pediatric inflammatory bowel disease demonstrates elevated serum PLGF, IL-7, TGF-beta1, and IL-12p40 levels in Crohn's disease and ulcerative colitis patients in remission versus active disease. Am J Gastroenterol. 2005;100:414–423. [DOI] [PMC free article] [PubMed] [Google Scholar]
- 43.Monteleone G, Neurath MF, Ardizzone S, et al. Mongersen, an oral SMAD7 antisense oligonucleotide, and Crohns disease. N Engl J Med. 2015;372;1104–1113. [DOI] [PubMed] [Google Scholar]
- 44.Kanazawa S, Tsunoda T, Onuma E, et al. VEGF, basic-FGF, and TGF-beta in Crohn's disease and ulcerative colitis: a novel mechanism of chronic intestinal inflammation. Am J Gastroenterol. 2001;96:822–828. [DOI] [PubMed] [Google Scholar]
Associated Data
This section collects any data citations, data availability statements, or supplementary materials included in this article.