Abstract
Image enhancement can improve the detail of the image and so as to achieve the purpose of the identification of the image. At present, the image enhancement is widely used in medical images, which can help doctor’s diagnosis. IEABPM (Image Enhancement Algorithm Based on P-M Model) is one of the most common image enhancement algorithms. However, it may cause the lost of the texture details and other features. To solve the problems, this paper proposes an IIEABPM (Improved Image Enhancement Algorithm Based on P-M Model). Simulation demonstrates that IIEABPM can effectively solve the problems of IEABPM, and improve image clarity, image contrast, and image brightness.
Keywords: Bending, distortion, image enhancement, matlab, P-M model, tilt
1. INTRODUCTION
In the field of image process, image enhancement is a very important research direction, which has been widely used in military, remote sense, public safety, biomedicine, etc [1]. In the field of medicine, the image is usually gathered by CT machine, ultrasonic apparatus, and so on. The collected images may be blurry, which will affect diagnoses of the illness. To improve the quality of the collected images, image enhancement is used [2].
From the aspect of the realization, the image enhancement algorithm can be divided into five categories: image enhancement algorithm base on traditional theory, image enhancement algorithm based on multiscale analysis [3], image enhancement algorithm based on fuzzy theory [4], image enhancement algorithm based on humanoid vision [5] and image enhancement algorithm based on mathematic morphology [6]. Among them, the image enhancement algorithm based on mathematic morphology consists of closing operation, erosion operation, dilation operation and open operation. IEABPM (Image Enhancement Algorithm Based on P-M Model) is one of the most used [7, 8]. IEABPM can effectively remove the noise of images, however, for the area which has rich textures, it may it may cause the lost of the texture details and other features. To solve the problem, IIEABPM (Improved Image Enhancement Algorithm Based on P-M Model) is proposed. And Simulation demonstrates that IIEABPM can improve image clarity, image contrast, entropy and iamge brightness.
2. IIEABPM
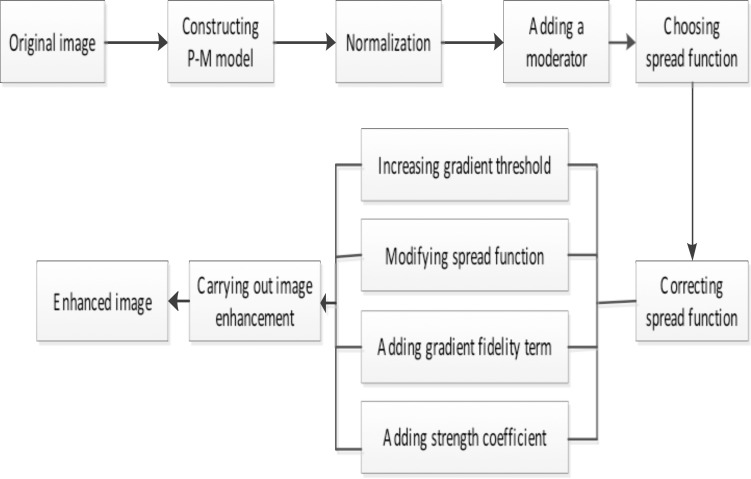
In IIEABPM, it firstly uses the normalization method to translate P-M model into posed problem. Secondly, a moderator is added to control the process of optimization. Thirdly, according to different region status of the image, IIEABPM chooses the spread function. To meet the performance requirements, the spread function is corrected through four steps. The first step is increasing gradient threshold. The second step is modifying spread function. The third step is adding gradient fidelity term. The last step is adding strength coefficient. Fig. (1) gives the flow chart of IIEABPM.
Fig. (1).
Flow chart of IIEABPM.
According to Fig. (1), when the normalization is used, Gaussian kernel is adopted to smooth the images.
| (1) |
Where is a Gaussian function, whose mean value and variance are respectively 0 and .
After the normalization, P-M model is translated into posed problem, and there is only one continuous solution, which depends on the initial value . And then a moderator is added to control the process of optimization, and. Therefore, the mathematical model of image enhancement can be written as follows:
| (2) |
Where u is the image at time t, div means divergence operator, is the gradient of the image, is the spread fuction, whose value means the strength of spread. İn some area of the image, the value of decides whether or not the image is smooth. That is to say, When the value of is smaller, the image in the region is smoother.
In order to keep the anisotropic diffusion of spread function, must make spread function satisfy the following two conditions:
(1) The spread of the noise is within the relatively smooth featured area;
(2) The spread is not done between two adjacent areas to preserve the edge details.
When removing the noise of the image, spread function can be chosen from two kinds of expressions:
| (3) |
| (4) |
2.1. The First Step
Although the above spread model has good effects on the image denoise, its effect isn’t ideal when the noise is high. To solve the problem, Eq. 3 and Eq.4 can be modified:
| (5) |
| (6) |
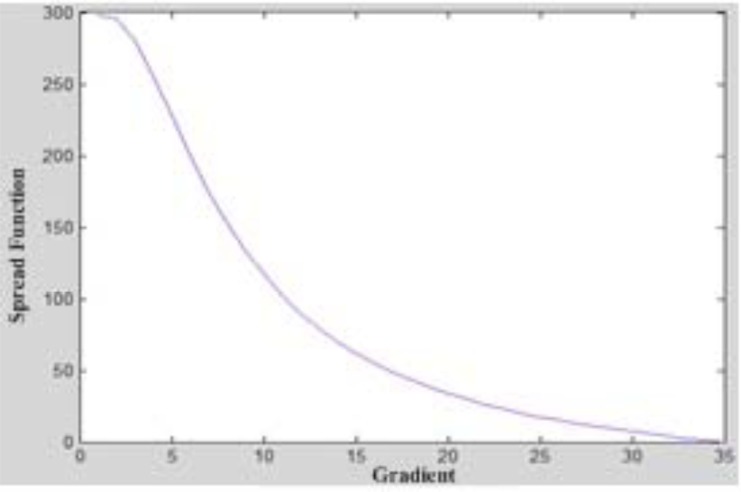
Where are the gradient thresholds , and . Fig. (2) gives the relationships between spread function and gradient.
Fig. (2).
Gradient vs. Spread Function.
From Fig. (2), we can see that the gradient and spread function has an inverse relationship. And compared with Eq. (3) and Eq. (4), Eq. (5) and Eq. (6) can better reserve the edge and texture.
2.2. The Second Step
In order to more accurately control the smoothness, is replaced by , where the expression of is:
| (7) |
Therefore, divergence operator can be written as:
| (8) |
When calculating , the similarity functional of two signals is:
| (9) |
Where α and β are weight coefficients,
is the gradient fidelity term, which try to make the changes of the gradient keep consistent with .
2.3. The Third Step
In Eq. 9, gradient fidelity term is added to increase the smoothness of the image. However, whether it will impede the optimal solution has not been proved. If is the convex function, the optimal solution uniquely exists.
Theorem 1 if
Proof:
Then,
Therefore,
An image can be regarded as the surface in two-dimensional space. The aim of using the gradient fidelity term is to keep the constraint of the continuity of the image topology. In the iterative computation, the gradient fidelity term maintains consistency of the original image and enhanced image, which can eliminate the loss of the image texture details and other features. Based on above analysis, Eq. 8 can be modified as:
| (10) |
Where α is the weight coefficient, .
2.4. The Fourth Step
To increase detailed information, the strength coefficient is added in the spread model. The model is:
| (11) |
Where w the strength coefficient, div is means divergence operator.
3. SIMULATION RESULTS
3.1. Enhancement Effect Analysis
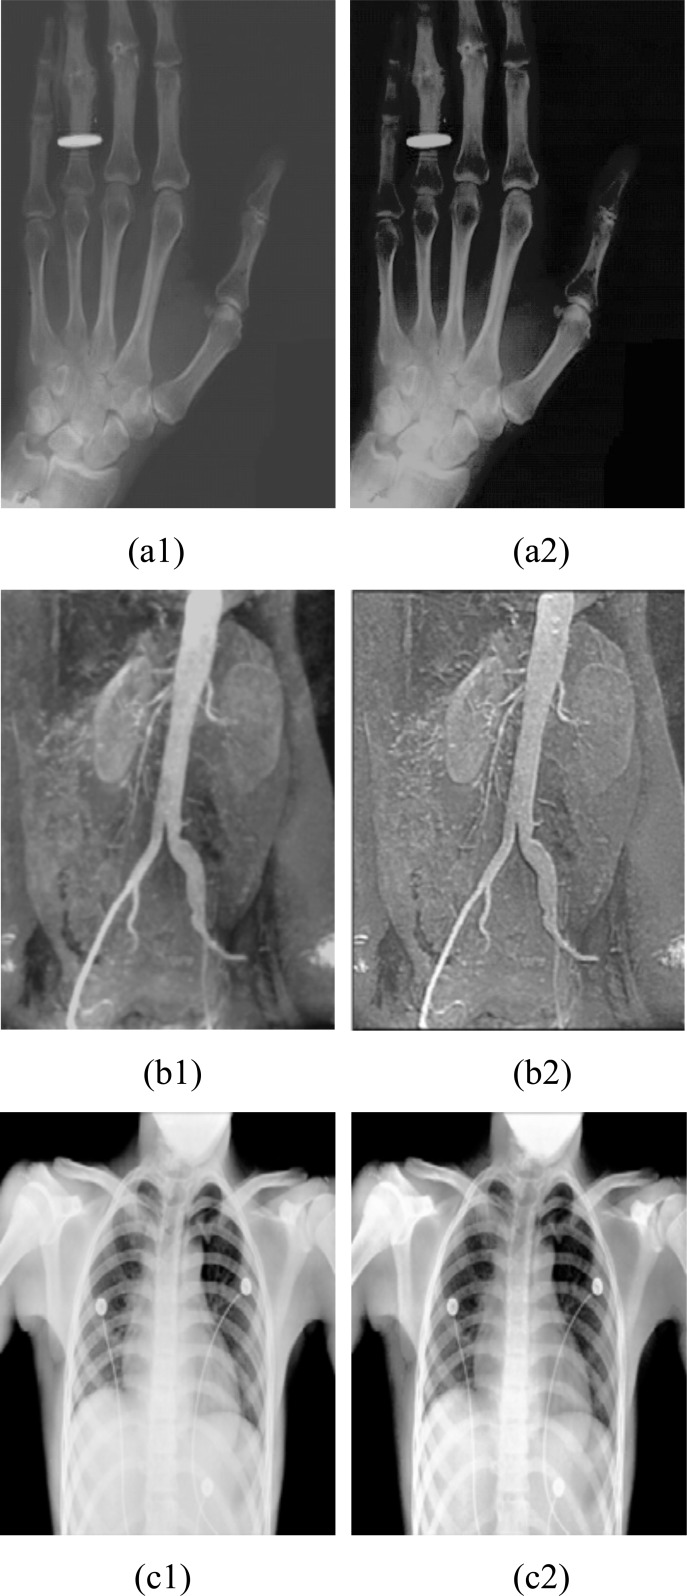
To verify the effectiveness of IIEABPM, enhancement effect tests are done, as shown in Fig. (3).
Fig. (3).
Enhancement effect.
In Fig. (3), the original images are (a1), (b1) and (c1), which are respectively hand bone image, angiocarpy image and rib image. (a2), (b2) and (c2) are enhanced images, accordingly. In the test, k1 =32, k2 =7, k3 =32, , n=25. From Fig. (3), we can see that enhanced images become clearer, and texture details have also been retained.
3.2. Performance Analysis
To further analyze the performance of IIEABPM, three tests are designed.
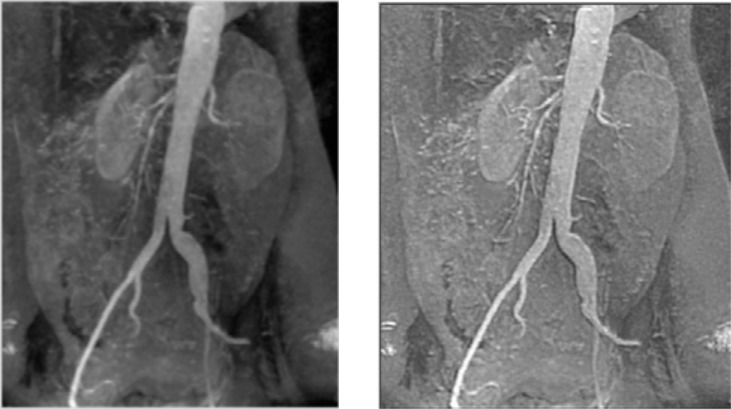
In the first test, Fig. 3(b1) is chosen as the subject, the performance of IEABPM and IIEABPM are compared in terms of the clarity, contrast, brightness and entropy. Fig. (4) gives the enhanced iamges, and Table 1 gives features of the enhaced images.
Fig. (4).
Enhanced images.
Table 1.
Features of images.
| Brightness | Contrast | Entropy | Clarity | |
|---|---|---|---|---|
| Original image | 57.15 | 311.36 | 6.29 | 38.21 |
| IEABPM | 77.42 | 441.67 | 10.18 | 59.83 |
| IIEABPM | 79.26 | 487.82 | 14.01 | 73.85 |
From Fig. (4) and Table 1, we can see that the performance of IIEABPM is better than that of IEABPM.
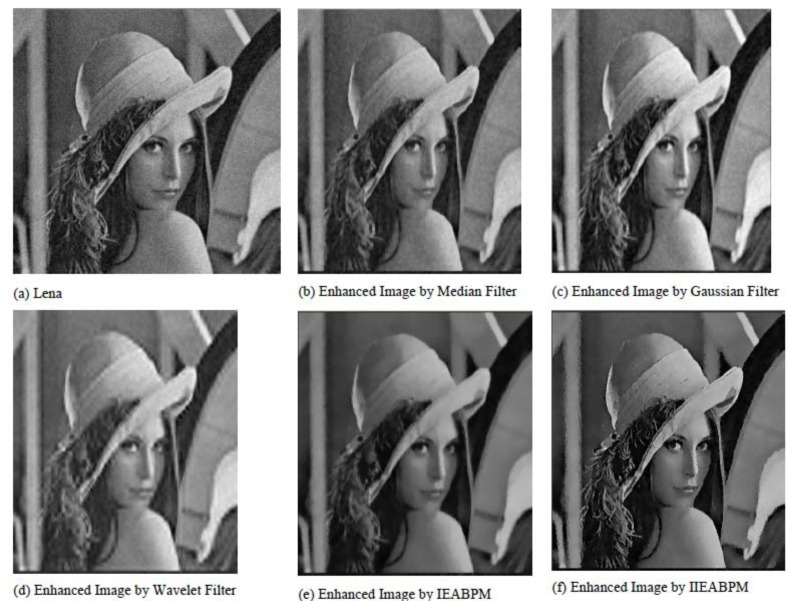
In the second test, Fig. 4(a) with noise is chosen as the subject. The performance of image enhancement by the median filter, image enhancement by Gaussian filter, image enhancement by wavelet filter, IIEABPM and IEABPM are compared in the term of the enhancement effect, as shown in Fig. (5).
Fig. (5).
Compared results for Lena.
From Fig. (5), we can see that the performances of IEABPM and IIEABPM are better than the performances of the other. In Fig. 5(e), many details are removed. However, in Fig. 5(f), not only is the image noise is restrained, but also are details reserved.
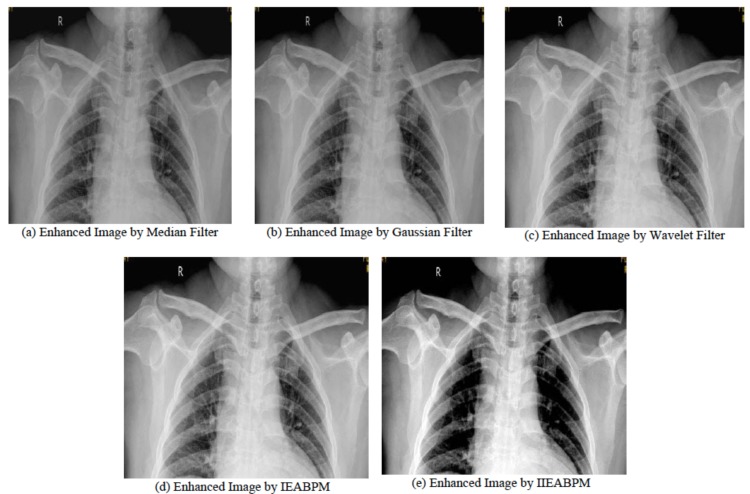
In the third test, Fig. 3(a) is chosen as the subject. The performance of image enhancement by the median filter, image enhancement by Gaussian filter, image enhancement by wavelet filter, IIEABPM and IEABPM are compared in the term of the enhancement effect, as shown in Fig. (6).
Fig. (6).
Compared results for rib image.
From Fig. (6), we can see that the performance of IIEABPM is the best.
CONCLUSION
To solve the problems of IEABPM, the paper proposes IIEABPM. And simulation demonstrates that IIEABPM can effectively improve image clarity, image contrast, and iamge brightness.
ACKNOWLEDGEMENTS
This work was supported by the Youth Foundation of the Education Department of Hebei Province (QN2014182), Science and Technology Department of Hebei Province (112135119), Youth Foundation of Natural Science of Hebei North University (Q2014008), Youth Foundation of Natural Science of Hebei North University (Q2014002).
CONFLICT OF INTEREST
The authors confirm that this article content has no conflict of interest.
REFERENCES
- 1.Ekstrom M.P. Digital image processing techniques. Academic Press; 2012. [Google Scholar]
- 2.Wang H., Pan Y., Chen K. Enhancement of Low-dose Lung CT Image Based on Stochastic Resonance of FHN Neurons. 2014. [Google Scholar]
- 3.Bedi S.S., Khandelwal R. Various image enhancement techniques-a critical review. International Journal of Advanced Research in Computer and Communication Engineering. 2013;2:251–257. [Google Scholar]
- 4.Patel D.K., More S.A. An enhanced approach for edge image enhancement using fuzzy set theory and cellular learning automata (CLA). World Journal of Science and Technology. 2012;2:158–162. [Google Scholar]
- 5.Busheri I., Herman A. Digital image enhancement improves diagnosis of non displaced proximal femur fractures. Clin. Orthop. Relat. Res. 2008;32:432–453. doi: 10.1007/s11999-008-0494-y. [DOI] [PMC free article] [PubMed] [Google Scholar]
- 6.Kimori Y. Mathematical morphology-based approach to the enhancement of morphological features in medical images. J. Clin. Bioinforma. 2011;1:33. doi: 10.1186/2043-9113-1-33. [DOI] [PMC free article] [PubMed] [Google Scholar]
- 7.Cai Y., Huang Y. Image smoothing process model and improving based on P&M model. Computer Simulation. 2011;28:256–273. [Google Scholar]
- 8.Mu Y., Yu Y. Reasearch on image filtering algorithm. Computer Engineering. 2014;2:32–37. [Google Scholar]


