

Background: Folding intermediates of proteins are known to initiate misfolding.
Results: Two partially unfolded forms (PUFs) of the prion protein have been characterized structurally and energetically.
Conclusion: One of the PUFs is structurally similar to an initial intermediate in prion misfolding.
Significance: Identification of aggregation-prone intermediates on the prion protein's folding pathway is the key to understanding its amyloidogenic propensity.
Keywords: hydrogen-deuterium exchange, mass spectrometry (MS), nuclear magnetic resonance (NMR), prion, protein dynamic, partially unfolded forms
Abstract
The susceptibility of the cellular prion protein (PrPC) to convert to an alternative misfolded conformation (PrPSc), which is the key event in the pathogenesis of prion diseases, is indicative of a conformationally flexible native (N) state. In the present study, hydrogen-deuterium exchange (HDX) in conjunction with mass spectrometry and nuclear magnetic resonance spectroscopy were used for the structural and energetic characterization of the N state of the full-length mouse prion protein, moPrP(23–231), under conditions that favor misfolding. The kinetics of HDX of 34 backbone amide hydrogens in the N state were determined at pH 4. In contrast to the results of previous HDX studies on the human and Syrian hamster prion proteins at a higher pH, various segments of moPrP were found to undergo different extents of subglobal unfolding events at pH 4, a pH at which the protein is known to be primed to misfold to a β-rich conformation. No residual structure around the disulfide bond was observed for the unfolded state at pH 4. The N state of the prion protein was observed to be at equilibrium with at least two partially unfolded forms (PUFs). These PUFs, which are accessed by stochastic fluctuations of the N state, have altered surface area exposure relative to the N state. One of these PUFs resembles a conformation previously implicated to be an initial intermediate in the conversion of monomeric protein into misfolded oligomer at pH 4.
Introduction
The conformational conversion of native mammalian cellular prion protein (PrPC)3 into misfolded oligomeric or fibrillar forms (PrPSc) is a key event in the pathogenesis of transmissible spongiform encephalopathies (1–3). The ability of PrP to convert into misfolded conformations appears to be a consequence of its conformational flexibility (4). Indeed, at pH 4 where the prion protein is prone to misfolding, the native (N) state of PrP has an unusually high specific heat capacity, which is indicative of a very malleable structure (5). It appears therefore that under such conditions, the N state is in dynamic equilibrium with conformations of high energy (N* states) characterized by altered topology and exposure of hydrophobic regions. N* states have been suggested to be the monomeric precursors to amyloid forms during the aggregation of globular proteins under native conditions (6, 7). Hence, a structural and energetic characterization of these high energy states is extremely important for understanding the susceptibility of PrPC to convert into alternative misfolded forms that may differ in their morphology, toxicity, and other amyloidogenic properties (8–10).
The native state hydrogen-deuterium exchange (HDX) method enables the characterization of high energy intermediates, often termed partially unfolded forms (PUFs), present in equilibrium with the N state without the need of having to perturb the amino acid sequence of the protein. PUFs have been shown to be populated on (11–15) or off (16–18) the folding pathways of many proteins. However, no PUFs could be detected in earlier native state HDX-NMR studies carried out at pH 5.5 on the human PrP and Syrian hamster PrP (19, 20). Nevertheless, folding intermediates could be detected in kinetic studies of the folding of human PrP (21, 22) as well as of pathogenic variants of ovine PrP (23) whose population correlated well with the amyloidogenicity of the protein. However, similar kinetic studies on moPrP at pH 7 could not detect any intermediate forms (24). If the N state of PrP does indeed exist in dynamic equilibrium with PUFs, these PUFs are more likely to be populated to detectable extents under conditions where the N state is destabilized, such as at a lower pH (5, 25).
The propensity of the prion protein to oligomerize or fibrillize is well correlated with acidic pH (26–31); indeed, misfolding and oligomerization of PrP in the cell may originate in the endocytic pathway in late endosomes or in lysosomes, which have a low internal pH (26, 27). PrP misfolds and oligomerizes at low pH in the presence of 150 mm NaCl (29, 32). The misfolding transition has an apparent pKa of 4.7, and at pH 4, nearly all (> 95%) of the protein molecules are misfolded and oligomerized (32). Hence, if misfolding does originate from a PUF, then such a form can be expected to be nearly maximally populated at pH 4 where the protein is also destabilized, and the PUF should be detectable by native state HDX carried out at this pH.
In the present study, native state HDX-mass spectrometry (HDX-MS) as well as HDX-NMR studies were carried out on the full-length mouse prion protein, moPrP(23–231), at pH 4. At this pH, the protein is known to be primed to misfold, which it does to near completion upon the addition of salt (28, 29, 32, 33). Fortuitously, from the viewpoint of the applicability of the HDX methodology, pH 4 is close to the pH at which the intrinsic rate of HDX is minimal, which allows more amide hydrogens to be probed. Consequently, exchange rates for 34 backbone amide hydrogens were obtained in this study in comparison with the ∼23 (19) and ∼28 (20) seen in previous HDX-NMR studies that were carried out at a higher pH.
Here, it is shown that the backbone amides of all the residues in the N-terminal unstructured domain as well as 57 of 105 backbone amides of residues in the structured C-terminal domain of moPrP exchange out very fast with those from the C-terminal domain exchanging likely through local structural fluctuations of the backbone. Residues in the two β-strands (β1 and β2), three α helices (α1, α2, and α3), and the loops connecting α1 and β2 are shown to exchange through denaturant-dependent, subglobal unfolding events. The data suggest that the N state is in equilibrium with at least two PUFs. The two PUFs differ in their solvent-exposed surface areas, which are greater than that of the N state, and in their stabilities. In contrast to previous HDX-NMR studies carried out at a higher pH, there is no evidence for residual structure in the unfolded state at pH 4. Importantly, one of the two PUFs appears to be structurally similar to a conformation that has been implicated both in computational (34) and experimental studies (35) to be a crucial initial intermediate in misfolding.
Experimental Procedures
Protein Expression and Purification
The full-length recombinant mouse prion protein, moPrP(23–231), encoded in the pET-17b(+) plasmid was expressed in Escherichia coli BL21(DE3) CodonPlus (Stratagene) cells and purified as described previously (29). The protein was lyophilized and stored at −20 °C. The concentration of the protein was determined by absorbance measurements at 280 nm using an extinction coefficient of 62,160 m−1 cm−1 (36). The recombinant moPrP(23–231) lacks the first 22-residue signal sequence that is cleaved off in the formation of mature protein in vivo.
Chemicals and Buffers
All the experiments utilized buffers containing 20 mm sodium acetate and variable concentrations of urea (obtained from USB Corp.) in the range 0–2 m. Urea was deuterated by dissolving it in D2O, flash freezing the solution, and lyophilizing it. This cycle was repeated three times to ensure complete deuteration of the urea. The deuteration or exchange buffer consisted of 20 mm sodium acetate dissolved in D2O adjusted to pD 4 (pD = pDread + 0.4) using DCl. All solutions were filtered using 0.22-μm Millipore syringe filters before use. The concentrations of urea stock solutions were determined prior to use by refractive index measurements using an Abbe refractometer. All chemicals used were obtained from Sigma (unless mentioned otherwise).
Peptide Map of moPrP
Lyophilized protein was dissolved in Milli-Q water at pH 2.5 to a final concentration of 3.5 μm. This sample was injected into the HDX module (Waters) where the sample was digested by pepsin (at a 50 μl/min flow rate), and the peptic fragments were separated on a C18 reverse phase chromatography column using a gradient of 3–40% acetonitrile before being fed into a Waters Synapt G2 HD mass spectrometer. All columns were kept at 4 °C, and the mobile phases were chilled on ice. The fragments were identified using Protein Global Lynx software. The fragments obtained corresponded to all structured parts of the protein including the loops connecting the secondary structures. However, no peptide could be obtained for a stretch of 14 residues (168–181) corresponding to the N-terminal segment of α2.
Hydrogen Exchange
Deuteration of moPrP
Lyophilized protein was dissolved in deuteration buffer (20 mm sodium acetate dissolved in D2O at pD 4) to a final concentration of ∼20 μm. This stock solution was heated to 65 °C for 10 min to unfold and deuterate the protein, immediately kept on ice for 15 min for refolding, and then kept at room temperature (37). The stock solution was concentrated using a 10-kDa Centricon filter unit from Millipore to 180 μm. The mass of the deuterated protein was checked using a Synapt G2 HD mass spectrometer, and the protein was found to be completely deuterated.
HDX-MS of moPrP
Lyophilized protein was dissolved in 20 mm sodium acetate, pH 4 to a final concentration of 20 μm. To initiate exchange, 25 μl of protonated protein were mixed with 475 μl of deuteration buffer in the presence of 0–2 m urea for varying lengths of time, at 25 °C. The reaction was quenched by mixing with ice-cold 500 mm glycine, pH 2.4, and the solution was desalted into ice-cold water, pH 2.5 using a Sephadex G-25 HiTrap desalting column in conjunction with an ÄKTA Basic HPLC. The desalted samples were injected into the HDX module (Waters) coupled to a nanoACQUITY UPLC. A gradient of 3–40% acetonitrile (0.1% HCOOH) at a flow rate of 40 μl/min was used for elution of the protein from an analytical C18 reverse phase chromatography column in 10 min. The extent of exchange was determined by measuring the increase in the mass of the protein in the Synapt G2 HD mass spectrometer.
For experiments in which HDX was followed by pepsin digestion, the protein was dissolved to a final concentration of 180 μm in 20 mm sodium acetate, pH 4. For online pepsin digestion, a flow rate of 50 μl/min of water (0.05% HCOOH) was used. The peptides eluted were collected using a peptide trap column, washed to remove salt, and eluted as above. All columns were kept at 4 °C in the cold chamber of the HDX module. The peptides separated on the column were detected using the Synapt G2 HD mass spectrometer. The mass spectrometer parameters were set as follows: source temperature, 35 °C; desolvation temperature, 100 °C; capillary voltage, 2.8 kV. To determine the number of exchanged deuteriums that are lost due to back-exchange during sample processing after quenching of the exchange reaction, 25 μl of completely deuterated protein were diluted in 475 μl of deuteration buffer, the reaction was quenched as above, and the sample was then processed in an identical way.
Data Analysis
Pepsin digestion and separation of the peptic fragments of the protonated protein labeled in deuteration buffer for different times yielded peptic fragments (corresponding to sequence segments in the intact protein) with differential retention of protons with time. The percentage of proton retention in each peptic fragment was determined using Equation 1.
 |
Here, M(t) is the centroid mass of the isotopic envelope of the peptide at time t of exchange, MP is the centroid mass of the isotopic envelope of the protonated peptide obtained from protonated protein, and MD is the centroid mass of the isotopic envelope of the peptide obtained from completely deuterated protein that had been processed as indicated above. The plot of percent hydrogen retention versus t was fit to an exponential decay equation to yield the observed exchange rates (kobs) and amplitudes of the different kinetic phases of the exchange process. The HDX reaction under the given experimental conditions occurs in the EX2 limit, and hence, the observed exchange rates can be used to calculate the free energy of opening of structure in the sequence segment, to exchange, using Equation 2 (13).
 |
Here, kint is the intrinsic exchange rate, which is the rate of exchange in an unstructured peptide of identical sequence (38). In using Equation 2, kint for each sequence segment was determined as the average kint of those residues in the segment that were identified separately by HDX-NMR of the intact protein to have the slow exchanging amide hydrogens. R and T are the universal gas constant and the temperature at which the exchange reaction is carried out, respectively. The difference in the centroid mass of the isotopic envelope of the peptide at time t of exchange and that of the completely protonated peptide was used to obtain the number of deuteriums incorporated with time (Table 1).
TABLE 1.
Parameters obtained from native state HDX of moPrP at pD 4 at 25 °C monitored by mass spectrometry
The relative amplitudes and rates of the multiple kinetic phases of exchange for the peptic fragments corresponding to sequence segments of moPrP were obtained from native state HDX-MS. In HDX-MS experiments, the amide hydrogens belonging to the first two residues of the peptide fragment corresponding to any sequence segment exchange too fast for their exchange to be observed (42–44). In sequence segment 127–132, it appears from the HDX-NMR data that Met128 may not be exchanging fast.
| Secondary structure | Sequence segment | No. of exchangeable backbone hydrogens | No. of deuteriums incorporated | Amplitude | kint | Exchange rates |
|---|---|---|---|---|---|---|
| % | s−1 | s−1 | ||||
| β1 | 127–132 | 4 | Fast, 1 | 43.0 ± 1.3 | 4×10⁻³ | (4.2 ± 0.4) × 10−3 |
| Slow, 1 | 49.0 ± 1.2 | (1.5 ± 0.1) × 10−4 | ||||
| Loop between β1 and α1 | 133–143 | 7 | Fast, 1 | 52.5 ± 1.8 | 9×10⁻⁴ | (1.7 ± 0.1) × 10−2 |
| Slow, 1 | 37.9 ± 1.5 | (1.9 ± 0.2) × 10−4 | ||||
| α1 | 133–148 | 5 | Fast, 2 | 32.9 ± 1.6 | 5.8×10⁻³ | (1.2 ± 0.2) × 10−2 |
| Slow, 3 | 54.4 ± 1.4 | (1.1 ± 0.1) × 10−4 | ||||
| 149–153 | 2 | Slow, 2 | 88.8 ± 0.7 | 0.01 | (7.2 ± 0.3) × 10−5 | |
| Loop between α1 and α2 including β2 strand | 154–167 | 9 | Fast, 2 | 25.2 ± 2.2 | 3.9×10⁻³ | (2.1 ± 0.1) × 10−3 |
| Slow, 5 | 66.8 ± 2.5 | (2.1 ± 0.2) × 10−5 | ||||
| 155–162 | 5 | Fast, 1 | 17.1 ± 2.0 | 3.8×10⁻³ | (2.1 ± 0.6) × 10−3 | |
| Slow, 3 | 76.8 ± 2.0 | (2.1 ± 0.2) × 10−5 | ||||
| α2 and loop between α2 and α3 | 182–196 | 13 | Fast, 3 | 71.1 ± 2.6 | 5.5×10⁻³ | (1.8 ± 0.2) × 10−3 |
| Slow, 1 | 23.3 ± 2.4 | (2.3 ± 0.6) × 10−5 | ||||
| Loop between α2 and α3 | 190–197 | 6 | Fast, 2 | 90.9 ± 1.6 | 8.4×10⁻³ | (8.8 ± 1.2) × 10−3 |
| 197–201 | 3 | Fast, 2 | 62.4 ± 5.5 | 9.4×10⁻³ | (2.0 ± 0.2) × 10−2 | |
| α3 | 197–204 | 6 | Fast, 1 | 24.6 ± 1.4 | 3.1×10⁻³ | (1.8 ± 0.3) × 10−2 |
| Slow, 3 | 69.4 ± 1.2 | (1.1 ± 0.1) × 10−4 | ||||
| 197–206 | 8 | Fast, 1 | 18.4 ± 1.8 | 3.1×10⁻³ | (1.5 ± 0.4)×10−2 | |
| Slow, 3 | 70.2 ± 1.7 | (7.2 ± 0.5) × 10−5 | ||||
| 204–224 | 18 | Fast, 3 | 27.4 ± 1.9 | 8.1×10⁻³ | (1.5 ± 0.2) × 10−2 | |
| Slow, 2 | 20.9 ± 2.3 | (3.3 ± 0.8) × 10−4 | ||||
| Slow, 5 | 48.1 ± 1.9 | (1.4 ± 0.2) ×10−5 | ||||
| 205–212 | 6 | Slow, 3 | 75.1 ± 1.2 | 6.8×10⁻³ | (2.1 ± 0.1) × 10−6 | |
| 217–223 | 5 | Fast, 1 | 51.1 ± 2.8 | 5.3×10⁻³ | (2.4 ± 0.3) × 10−3 | |
| Slow, 1 | 37.0 ± 2.7 | (1.1 ± 0.2) × 10−4 |
Sequential Backbone Assignment of the NMR Spectrum of moPrP
Two-dimensional 15N heteronuclear single quantum coherence, HNCO, HNCA, HNCACO, HNCOCACB, and HNCACBresonance experiments were carried out on 300 μm moPrP in 20 mm sodium acetate at pH 4 (in the presence of 5% D2O) for the backbone assignment. Data were processed using NMRPipe, and the assignment was done using the NMR data visualization and assignment software Sparky. A list of the assigned residues is given in supplemental Table S1. The NMR spectrum of the protein collected at pH 4 in this study is indistinguishable from that collected at pH 4.5 (39).
HDX-NMR
A 1H-15N two-dimensional selective optimized flip angle short transient heteronuclear multiple quantum coherence spectrum (40) was collected as the reference unexchanged sample spectrum by dissolving lyophilized protein in 20 mm sodium acetate, pH 4, 95% H2O, 5% D2O buffer to a final concentration of 300 μm. To monitor exchange, lyophilized protein was dissolved in 20 mm sodium acetate (95% D2O), pD 4 to a final concentration of 300 μm (exchange sample). A series of 1H-15N two-dimensional selective optimized flip angle short transient heteronuclear multiple quantum coherence spectra of the exchange sample were collected up to 40 days following an initial dead time of 10 min. The two-dimensional spectra were collected on a Bruker 800-MHz spectrometer with 1024 × 256 (t1 × t2) time points totaling up to an acquisition time of 5 min and processed using NMRPipe and Sparky. The NMR spectrum of the unexchanged sample was corrected for intensity differences arising due to differences in matching, tuning, and shimming by multiplying with the ratio of the intensity of the Cys213 amide (an isolated peak that exchanges on a 1-month time scale) in the unexchanged spectrum to that of the Cys213 amide at 10 min of exchange. This was the intensity-corrected unexchanged spectrum. The signal intensity for each residue in all exchange spectra was normalized with the signal intensity of that residue in the intensity-corrected unexchanged spectrum. The resulting decrease in the normalized signal intensity with increasing time of exchange was converted into a percent hydrogen occupancy versus t plot and fit to an exponential decay equation to yield an observed exchange rate. This rate was used to calculate the free energy of opening of structure to exchange using Equation 2. The intrinsic rates of exchange for individual residues were obtained as described elsewhere (38).
Far-UV Circular Dichroism Spectra of moPrP at 25 °C
Far-UV CD spectra of moPrP at pH 4 in 20 mm sodium acetate, and at pH 7 in 20 mm sodium phosphate were acquired on a Jasco J-815 spectropolarimeter using a protein concentration of 10 μm in a 0.1-cm-path length cuvette with a bandwidth of 1 nm, a scan speed of 50 nm/min, and a digital integration time of 1 s.
1-Anilino-8-naphthalene Sulfonate (ANS) Binding of moPrP
2 μm moPrP was incubated at 25 °C with 20 μm ANS dye in 20 mm sodium acetate buffer at pH 4 and in 20 mm sodium phosphate buffer at pH 7. The fluorescence spectra were obtained by exciting the samples at 385 nm and collecting the emission spectra from 400 to 600 nm.
Misfolding and Oligomerization of moPrP
For studying the misfolding of moPrP at pH 4 and pH 5.5, 100 μm moPrP was incubated at 25 °C for different times up to 3 weeks and at 37 °C for different times up to 24 h in 150 mm NaCl at the desired pH. 20 mm sodium acetate and 20 mm 2-(N-morpholino)ethanesulfonic acid were used as buffers at pH 4 and pH 5.5, respectively. To study the extent of misfolding, each sample was diluted 10-fold in the same buffer, and the CD spectra were acquired immediately on a Jasco J-815 spectropolarimeter using a 0.1-cm-path length cuvette with a bandwidth of 1 nm, a scan speed of 50 nm/min, and a digital integration time of 1 s. The percentage of misfolding of moPrP was calculated from the CD spectra by monitoring the decrease in CD signal at 216 nm with increasing time of incubation (32).
Results
Upon lowering the pH to 4, moPrP is known to become primed for misfolding and oligomerization. Fig. 1 shows that when the misfolding of moPrP was initiated by the addition of 150 mm NaCl at two different temperatures moPrP misfolded considerably faster at pH 4 than at pH 5.5. Fig. 1a shows that after 3 weeks of incubation in the presence of 150 mm NaCl at 25 °C, moPrP had misfolded completely into a β-sheet rich structure at pH 4, whereas it had not undergone any significant change in secondary structure at pH 5.5. The misfolding reaction at pH 5.5 at 25 °C was too slow for its rate to be measured. However, at 37 °C, the misfolding reactions became substantially faster. Fig. 1b shows that at 37 °C in the presence of 150 mm NaCl, moPrP misfolded completely within 24 h at pH 4 and that the reaction was much faster than at pH 5.5. Hence, in this study, the cooperativity of the unfolding reaction of moPrP was studied by carrying out native state HDX at pD 4 at 25 °C, in the presence of different concentrations (0–2 m) of urea. The HDX reaction was monitored by mass spectrometry for different times of exchange ranging from 5 s to 40 days (Fig. 2a). The slow exchanging amide hydrogens within each sequence segment studied by HDX-MS were identified by HDX-NMR of the intact protein at pD 4 at 25 °C, in the absence of urea.
FIGURE 1.

Misfolding of moPrP at pH 4 and at pH 5.5. a shows the far-UV CD spectra of moPrP at pH 4 and pH 5.5 at 0 h (solid line and dashed line) and at 3 weeks (short-dashed line and dotted line) of misfolding at 25 °C, respectively. Misfolding was initiated by the addition of 150 mm NaCl. b shows the kinetics of misfolding at pH 4 (circles) and at pH 5.5 (squares) at 37 °C. Misfolding was monitored by the measurement of the CD signal at 216 nm. The error bars represent standard deviations from three independent experiments. The solid lines are exponential fits through the data. An earlier study has shown that the time course of misfolding as monitored by CD is the same as the time course of oligomerization as measured by size exclusion chromatography (32, 35). MRE, mean residue ellipticity; deg, degrees.
FIGURE 2.

Native state HDX of moPrP at pD 4 and 25 °C monitored by mass spectrometry. a shows the progressive increase in m/z values of the 27th chargestate of the protein at 0 s, 5 min, and 160 min of exchange in deuteration buffer along with the m/z value for 100% deuterated moPrP. The short-dashed lines indicate the centroid of the peak. b shows the mass spectra of three peptide fragments obtained from the protein at different times of exchange along with the controls of protonated (0%) and deuterated (100%) peptide fragments. Peptide fragments 127–132, 154–167, and 205–212 correspond to β1, the loop linking α1 and α2 (inclusive of β2), and the central segment of α3, respectively. The black short-dashed lines indicate the centroid m/z of the given peptide.
Native State HDX of the moPrP at pH 4 Occurs in the EX2 Limit
When the unfolding and refolding kinetics of the structured C-terminal domain of moPrP (W144F/F174W variant of moPrP(121–231)) was studied using a continuous flow mixer at 25 °C and pH 4, the protein was found to refold with a rate of 11,000 s−1.4 This refolding rate is much faster than the intrinsic rate of exchange, which is 0.01 s−1, under the given exchange conditions. Hence, HDX in moPrP must occur in the EX2 limit (41). This is also evident from the observation that the single peak of the 27th charge state in the mass spectrum of moPrP shifted gradually to a higher mass to charge ratio (m/z) with increasing times of exchange (Fig. 2a) as expected when HDX occurs in the EX2 limit.
To obtain structural information, moPrP that had undergone HDX for a variable time as indicated above, was proteolyzed by passing through an online pepsin column. Pepsin cleaved the protein into fragments, each fragment corresponding to a segment of the protein. The increase in the m/z value, which is a measure of the number of backbone amide hydrogens that have exchanged with deuterium, was converted into percent hydrogen retention using Equation 1. Fig. 2b shows the mass spectra of three different sequence segments of the protein that correspond to three structured parts of the protein, with increasing time of HDX in the absence of denaturant. A gradual shift in the centroid of the peak (shown as a dashed line) to higher values as a result of the increase in the number of deuteriums incorporated is observed with increasing time of exchange. The three sequence segments of the protein are seen to differ greatly in their rates of exchange of their backbone amide hydrogens.
Fig. 3 shows the decrease in percent hydrogen retention with increasing time of HDX for five different sequence segments of the protein and the dependences of their rates of HDX on urea concentration. The data for sequence segment 149–153, which corresponds to the C-terminal end of α1, and segment 205–212, which corresponds to the central region of α3, fit to a single exponential equation, and the corresponding HDX rates increased with the increase in urea concentrations. The data for sequence segment 155–162, corresponding to the loop between α1 and α2 including β2, fit to a two-exponential equation, which corresponds to two kinetic phases of exchange. The fast rate is independent of urea concentration and corresponds to and is similar in value to the kint of HDX (38), whereas the slow exchange rate is dependent on urea concentration. The fast rate of HDX for segment 155–162 therefore corresponds to the average rate of HDX for the unprotected amides in the segments, and the slow rate corresponds to the average rate of HDX for the protected amides in the segments. The data for segment 190–197, which corresponds to the C-terminal end of α2 and the loop between α2 and α3, fit to a single exponential equation and has an exchange rate that is independent of urea concentration. For the segment 204–224, which spans α3, the amide hydrogens exchange out in three kinetic phases, a fast phase independent of urea concentration and two slow phases of exchange that are dependent on urea concentration with distinct rates.
FIGURE 3.
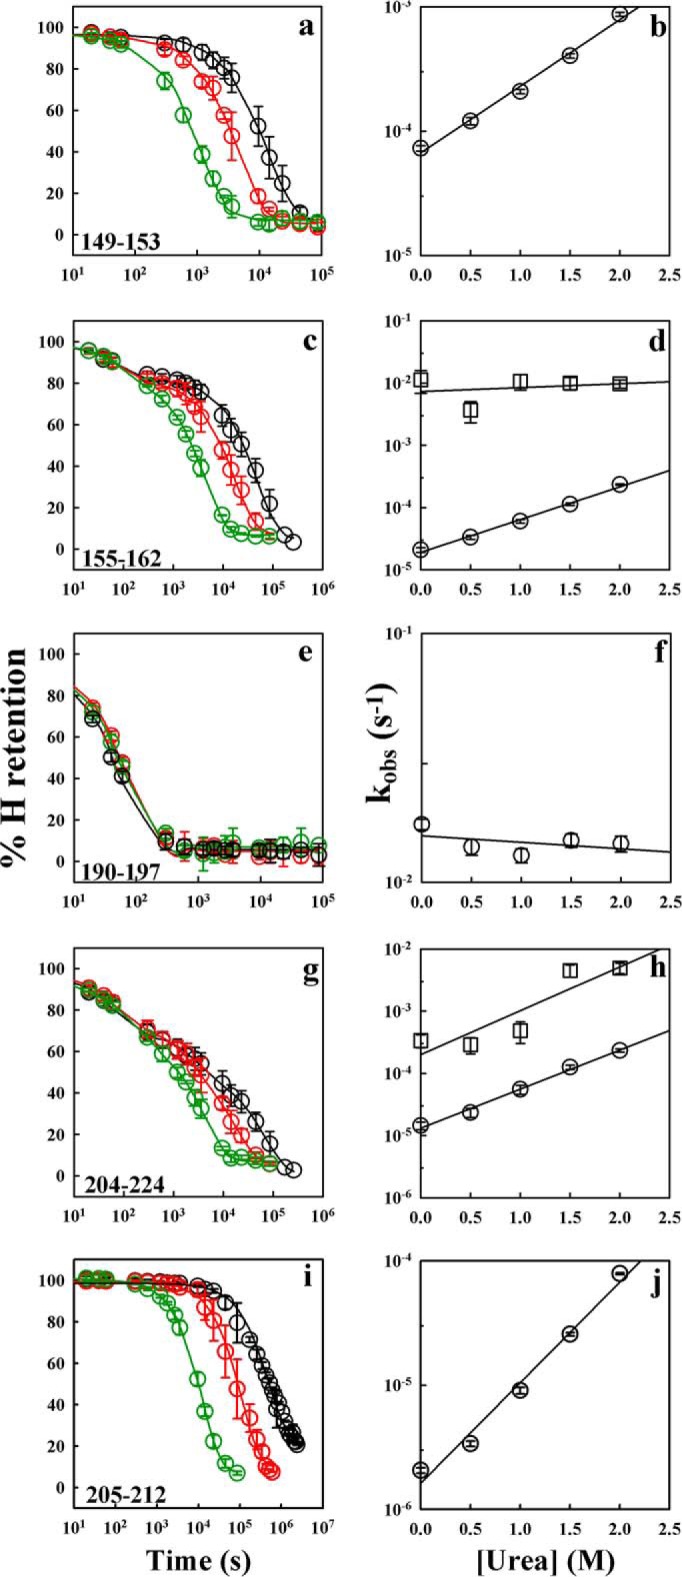
HDX-MS of backbone amide hydrogens of moPrP in deuterated solvent at 25 °C and pD 4. The percent hydrogen retention versus time data for five peptide fragments, 149–153, 155–162, 190–197, 204–224, and 205–212, in the presence of 0 (black circles), 1 (red circles), and 2 m (green circles) urea are shown (a, c, e, g, and i). The solid lines in black, red, and green are the exponential decay fits to the 0, 1, and 2 m urea data, respectively. The dependences of the rates of HDX on urea concentration for the five segments are shown (b, d, f, h, and j). For segment 155–162, both urea concentration-independent rates (squares), which correspond to intrinsic exchange rates, and urea concentration-dependent rates (circles) of HDX are shown. Segment 204–224 yields two urea concentration-dependent HDX rates as shown in h (squares and circles). The error bars represent standard deviations from three independent experiments.
Table 1 lists the various structured parts of moPrP with the sequence segments obtained from proteolytic fragmentation of the protein. The number of exchangeable backbone amide hydrogens in any segment is given by the number of backbone amide hydrogens corrected for the number of proline residues in the peptic fragment corresponding to the sequence segment. The first and second residues from the N terminus of any peptic fragment are known to exchange their amide hydrogens rapidly and hence have not been counted (42–44). The number of backbone amide hydrogens that exchange is obtained from the amplitudes of multiexponential fits to the time dependence of the number of deuteriums incorporated (not shown) in the given segment. Due to a loss in backbone amides because of back-exchange, the number of backbone amide hydrogens observed to exchange is lower than expected. Since, the percent hydrogen retention versus time curves were found to fit to a multiexponential equation, the relative amplitudes and the observed exchange rate of each kinetic phase for each sequence segment are shown. Here, for a given segment, the kint value is the average of the intrinsic rates of exchange of all the slow exchanging residues in the segment, which were identified by HDX-NMR.
Although proteolytic fragmentation coupled to HDX-MS was able to characterize the exchange properties of the different sequence segments in the protein, the identities of the protected residues within each sequence segment could not be obtained. To identify these protected residues, HDX-NMR was carried out under identical experimental conditions in the absence of urea (“Experimental Procedures”). Fig. 4, a–d, show the progressive decrease in 1H-15N cross-peak intensities of different residues in the NMR spectra collected at 0 s, 10 min, 1 h, and 4 h of exchange. Asp201 was seen to exchange almost completely within the experimental dead time, whereas Tyr154 takes 1 h to undergo complete exchange. Asn152 and Tyr156 exchange almost completely at 4 h, whereas Asn180, Arg207, and Gln211 exchange on longer time scales. Residues Arg155 and Asp177 overlap completely; hence, their exchange properties could not be determined individually. However, the single peak corresponding to both these residues was observed to exchange completely within 4 h. Fig. 5, a–h, show the change in the percent hydrogen occupancy with increasing times of exchange for Tyr127, Ile138, Met153, Val160, Asn180, Lys203, Gln211, and Gln216, respectively, which belong to different structural parts of the protein. Tyr127 is in β1, Ile138 is in the loop between β1 and α1, and Met153 is at the C-terminal end of α1. Val160 is in β2. Asn180 is in the central region of α2, whereas Lys203, Gln211, and Gln216 are residues in the N-terminal, central, and C-terminal regions of α3, respectively. The identification of the individual amide hydrogens that exchange slowly by HDX-NMR enabled the identification of the subset of residues within each proteolytic fragment whose exchange was studied by HDX-MS. The slow exchanging residues identified by HDX-NMR experiments are listed in supplemental Table S1 and Fig. 6.
FIGURE 4.

Native state HDX of moPrP at pD 4 and 25 °C monitored by NMR. a–d show the progressive decrease in 1H-15N cross-peak intensities of a few representative residues, Asn152, Tyr154, Arg155, Tyr156, Asp177, Asn180, Asp201, Arg207, and Gln211, at 0 s, 10 min, 1 h, and 4 h of HDX, respectively.
FIGURE 5.

HDX-NMR of backbone amide hydrogens of moPrP in deuterated solvent at 25 °C and pD 4. a–h show the change in percent hydrogen occupancy with increasing times of exchange for residues Tyr127, Ile138, Met153,Val160, Asn180, Lys204, Gln211, and Gln216. The solid line through each curve represents an exponential decay fit through the data.
FIGURE 6.

Residue-wise values of ΔGop at pD 4 and 25 °C. ΔGop values were obtained from HDX-NMR measurements in the absence of denaturant as shown in a. The dashed line represents the free energy of global unfolding of moPrP at pH 4, at 25 °C (5). The secondary structure of the protein is depicted at the top where arrows indicate β-strands, rectangles indicate helices, and solid lines connecting two secondary structural units indicate loops. b maps the residues for which ΔGop values were obtained from HDX-NMR, and average mop values were obtained from HDX-MS studies, onto the structure of the C-terminal domain of moPrP (Protein Data Bank code 1AG2). White corresponds to residues undergoing denaturant-independent exchange, whereas blue, orange, and red colors correspond to residues with average mop values of exchange of 0.4 ± 0.03, 0.8 ± 0.1, and 1.1 ± 0.08 kcal mol−1 m−1.
Evaluation of Stability at the Residue Level Obtained from HDX-NMR Study on moPrP in the Absence of Urea
The HDX-NMR study on moPrP at pD 4 and 25 °C enabled the determination of the rates of exchange for the backbone amides of 34 individual residues. The slow exchanging amides observed in the HDX-MS experiments for each sequence segment could be identified by the HDX-NMR experiment (Fig. 6 and Table 2), making use of the fact that the slow exchanging residues are unlikely to be the first two residues in the proteolytic fragment corresponding to the sequence segment (42–44). A detailed description of the identification of the slow exchanging residues observed in HDX-MS by HDX-NMR is given in the supplemental results. Table 2 also includes the slow exchanging residues observed by HDX-NMR that were not observed by HDX-MS. The rates of exchange of different residues obtained from HDX-NMR and their individual kint rates were used to calculate ΔGop for each residue as shown in Fig. 6. Fig. 6a shows the ΔGop values for the exchange of these 34 amides mapped onto the sequence, and Fig. 6b shows these residues mapped onto the structured, globular domain of moPrP (moPrP(121–231)).
TABLE 2.
Identification of the slow exchanging residues of moPrP by HDX-NMR
The slow exchanging residues observed in the various sequence segments of moPrP were identified by HDX-NMR at pD 4 at 25 °C. A detailed description of the identification of the slow exchanging residues in moPrP is given in supplemental Table S1. The dashes (—) corresponding to α2 indicate that exchange information on residues in the N-terminal region of α2 could not be obtained by the HDX-MS experiments as no proteolytic fragment spanning this region was identified. For sequence segments 190–197 and 197–201, the dashes (—) indicate that none of the residues were observed to exchange slowly in the HDX-MS experiments, and the exchange rates for the amide hydrogens of these residues were too fast to be monitored by HDX-NMR.
| Secondary structure | Sequence segment | No. of deuteriums incorporated in slow phase | Identified residues |
|---|---|---|---|
| β1 | 127–132 | 1 | Met128 |
| Loop between β1 and α1 | 133–143 | 1 | Ile138 |
| α1 | 133–148 | 3 | Ile138, Arg147, Tyr148 |
| 149–153 | 2 | Tyr149,a Arg150,a Glu151, Asn152, Met153 | |
| Loop between α1 and α2 including β2 strand | 154–167 | 5 | Tyr154,a Tyr156, Gln159, Val160, Tyr161, Arg163 |
| 155–162 | 3 | Gln159, Val160, Tyr161 | |
| α2 | — | — | Val175,a Val179,a Asn180,a Ile181,a Ile183a |
| α2 and loop between α2 and α3 | 182–196 | 1 | Gln185 |
| Loop between α2 and α3 | 190–197 | — | — |
| 197–201 | — | — | |
| α3 | 197–204 | 3 | Val202, Lys203, Met204 |
| 197–206 | 3 | Val202, Lys203, Met204 | |
| 204–224 | 7 | Arg207, Val209, Gln211, Cys213, Gln216, Gln218, Lys219 | |
| 205–212 | 3 | Arg207, Val209, Gln211 | |
| 217–223 | 1 | Lys219, Gln222,a Ala223,a Tyr224a |
a Slow exchanging residues that were identified by HDX-NMR but not by HDX-MS.
The identities of the slow exchanging residues obtained from HDX-NMR were used to evaluate ΔGop of the different proteolytic fragments for a range of denaturant concentrations. Fig. 7 shows the denaturant dependences of the stabilities of different segments of the protein. The stability of a proteolytic fragment was determined using the slower rates of HDX obtained from the exponential fits to the plots of percent hydrogen retention versus time of exchange. Here, the kint for any segment is the average of the intrinsic rates of exchange of all slow exchanging residues in the segment identified by HDX-NMR. For all segments, the values obtained for ΔGop are lower than the free energy of global unfolding (5). The exception is sequence segment 205–212 for which ΔGop values correspond to the global unfolding free energy. The dependence of ΔGop on urea concentration obtained from HDX-MS studies for different segments appears to merge with the global free energy of unfolding (ΔGU) at denaturant concentrations greater than 2 m. In all cases, the change in accessible surface area upon unfolding, which is represented by the slope (mop) of the linear fit to the urea concentration dependence of ΔGop, is lower than the slope (mU) of the linear least square fit to the urea concentration dependence (ΔGU) obtained from global unfolding studies.
FIGURE 7.

Denaturant dependences of ΔGop for different segments of moPrP at pD 4 and 25 °C. a–l show the denaturant dependences of ΔGop of the different sequence segments (circles). The dashed lines through the data are linear least square fits to the data, and the slopes yield the mop values for the different segments. The solid line represents the dependence of the global stability (ΔGU) on denaturant concentration; its slope is given by mU (5). In the case of segment 204–224 that spans α3, two protection factors corresponding to different regions of the segment are obtained, resulting in two distinct ΔGop values as shown in j (squares and circles).The dashed and dotted lines are linear least square fits to the data. The error bars represent standard deviations from three independent experiments.
Fig. 8 is a plot of the ΔGop of each segment in the absence of denaturant versus mop. The ΔGop values were observed to range from 2.0 to 4.8 kcal mol−1, and the mop values ranged from 0.3 to 1.1 kcal mol−1 m−1. The values of ΔGop and mop for segments 190–197 and 197–201 were negligible, indicating that this region of the protein undergoes very fast exchange, exposing negligible surface area while doing so.
FIGURE 8.
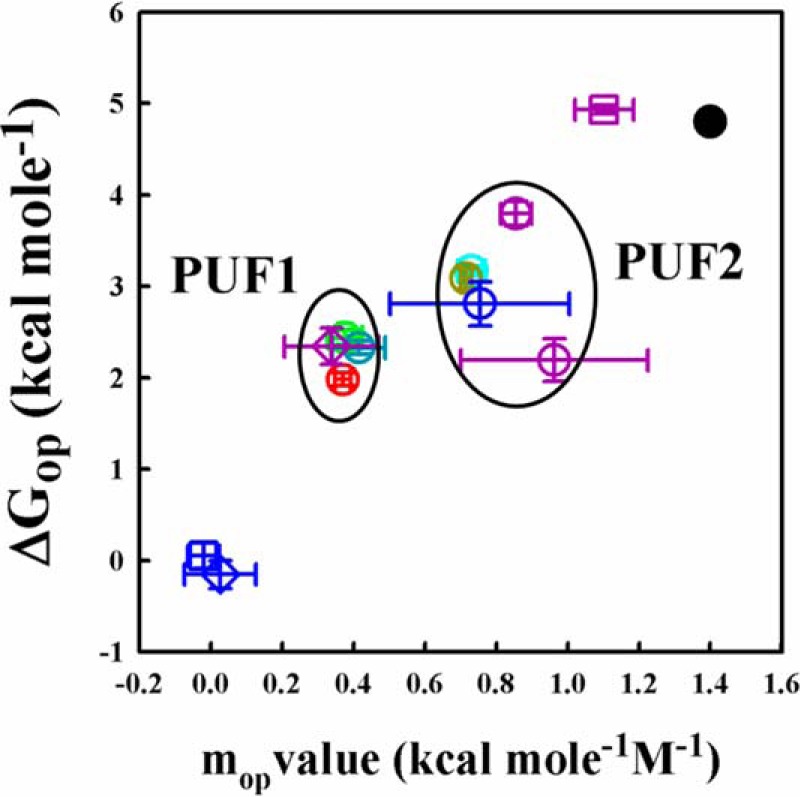
Defining partially unfolded forms of moPrP. ΔGop and mop values are shown for different segments of the protein. The ΔGop values shown are values determined in the absence of denaturant. ΔGop and mop values are shown for segments 127–132 (red circle), 133–148 (green circle), 149–153 (blue circle), 154–167 (yellow circle), 182–196 (dark blue circle), 190–197 (dark blue square), 197–201 (dark blue diamond), 197–206 (dark cyan circle), 204–224 (purple circle), 205–212 (purple square), and 217–223 (purple diamond). The black filled circle corresponds to ΔGU and mU. On the basis of mop values, sequence segments were classified into two distinct groups, PUF1 and PUF2. PUF1 corresponds to sequence segments having an mop value of 0.4 ± 0.03 kcal mol−1 m−1, and PUF2 corresponds to those having an mop value of 0.8 ± 0.1 kcal mol−1 m−1. PUF1 segments have a ΔGop of 2.2 ± 0.2 kcal mol−1, and PUF2 segments have a ΔGop of 3.1 ± 0.5 kcal mol−1.
Discussion
The molecular mechanism of conversion of PrPC to PrPSc, which is the fundamental event in almost all prion diseases, is still unknown. Studies indicating the unusual conformational plasticity of PrPC (4, 5, 45) have led to the hypothesis that partially unfolded intermediate conformations referred to as PrP* states are populated due to stochastic fluctuations of the native state, which then act as monomeric precursors to oligomeric or fibrillar forms (46). A battery of structural probes with an extensive set of perturbants of the native structure has been used to investigate the folding energy landscape of different prion proteins in an exhaustive search for partially structured intermediates. Studies of chemical denaturant-induced folding monitored by global probes such as fluorescence and circular dichroism have identified unfolding or refolding intermediates (21–23), but little structural information is available on them. NMR studies of the relaxation dynamics as well as of the effects of pressure-induced and thermally induced perturbations have revealed the presence of disordered conformations in equilibrium with the native state (47–51). Misfolded conformations can be selectively populated by refolding unfolded prion protein in solvents having high ionic strength in the presence of denaturant, and such intermediate conformations may be monomeric or oligomeric (28, 30, 33, 52, 53). However, previous native state HDX-NMR studies were unsuccessful in identifying such intermediate conformations in equilibrium with the native state under non-perturbing solvent conditions (19, 20). The current study identified partially unfolded intermediate conformations under solvent conditions where the protein is monomeric and native, but destabilized and aggregation-prone.
moPrP Has Native Structure at pH 4
Although the stability of moPrP decreases by 1.3 kcal mol−1 with a decrease in pH from 7 to 4 (5, 54), the native structure remains intact. The circular dichroism spectra of moPrP at pH 4 and pH 7 are very similar but not identical as shown in Fig. 9a. The differences most likely arise due to the pH-induced disruption of hydrophobic contacts in the C-terminal region of α2, as reported in earlier studies (31, 55). To investigate whether moPrP at pH 4 has molten globule-like properties, ANS binding studies were carried out at a protein:ANS concentration ratio of 1:10 at pH 4 and pH 7. Fig. 9, b and c, indicate that moPrP did not bind to ANS at either pH. All these studies indicate that moPrP at pH 4 is monomeric and native and lacks molten globule-like properties.
FIGURE 9.

CD spectra and ANS binding of moPrP at pH 4 and at pH 7. a shows the CD spectra of moPrP at pH 7 (black solid line) and pH 4 (black dotted line) at 25 °C. b and c show the fluorescence spectra of 2 μm moPrP at 25 °C in the presence of 20 μm ANS at pH 4 and pH 7, respectively. The solid and the dotted lines are the ANS fluorescence spectra in the presence and absence of moPrP. MRE, mean residue ellipticity; deg, degrees.
Denaturant-independent Exchange
moPrP has a total of 105 residues in the structured domain of the protein involved in the formation of the two antiparallel β-strands and three α-helices with interconnecting loops as shown in Fig. 6b. Of these, only 34 residues exhibit slow exchange in a denaturant-dependent manner as identified by HDX-NMR experiments (supplemental Table S1). However, all 34 slow exchanging backbone amide hydrogens studied by HDX-NMR could not be studied by HDX-MS because some of the amide hydrogens belonged to residues that happened to be the first two residues in the proteolytic fragments corresponding to the sequence segments and hence, exchanged very fast in the fragments (42–44). In addition to these 34 residues, overlapping residues Arg155 and Asp177, Thr182 and Thr215, and Val202 and Val208 were also observed to be slow exchangers. However, because of the overlap of their peaks in the NMR spectrum, the individual exchange rates were not determined. Of the 99 residues that were assigned, 57 residues showed denaturant-independent exchange. Although, the exact mechanism of denaturant-independent exchange is unclear, previous studies have proposed a “local structural fluctuation” (56) model, which posits a transient opening of the exchanging residues one at a time without significant surface area exposure. Alternatively, a statistical-mechanical approach proposes denaturant-induced modulation of populations of exchange-competent (open) and exchange-incompetent (closed) states to result in no net change in ΔGop with a change in denaturant concentration (57). Residues in the loops are expected to exchange fast as loops are flexible and lack any ordered structure. This was observed in moPrP where, with the exception of Ile138, all residues in the loops linking β1, α1, β2, α2, and α3 exchange out at very fast rates that could not be determined by HDX-MS or HDX-NMR. However, residues in the N-terminal region of α1, two of which are H-bonded (Glu145 to Asn142 and Asp146 to both Asn142 and Asp143) and residues in the N- and C-terminal regions of α2 and α3 were also seen to exchange out in a denaturant-independent manner. It also seems that the N-terminal region of α1 is more dynamic than the rest of the helix. The C-terminal region of α2 has been shown by studies of NMR relaxation dynamics to be destabilized due to the protonation of His186 at low pH, resulting in the disruption of hydrophobic forces and increased fluctuations (55). At pH 3.6, this region becomes disordered. Molecular dynamics simulations indicate that the residues in this region are “frustrated” in the helix and would be better accommodated in either a strand or in coiled structures (58, 59). Stabilization of this region by mutagenesis prevents the misfolding and oligomerization of the protein (32). A conformationally dynamic region is expected to exchange out fast in an HDX study. Incidentally, this region was observed to exchange very fast in previous HDX studies done at higher pH as well (19, 20).
Evidence for Subglobal Unfolding Events
Previous HDX-NMR studies were done at higher pH where the intrinsic rates of exchange are fast, and hence, only 23–28 residues could be studied (19, 20). In contrast, at the lower pH of 4, the exchange rates of 34 amide hydrogens could be determined.
The β1 strand, whose exchange could not be studied previously (19, 20), was observed to exchange out in a denaturant-dependent manner with an mop value of 0.4 kcal mol−1 m−1. The β1 strand is docked against the loop 120–126 and β2 strand and seems to undergo partial unfolding and consequently significant change in surface exposure during exchange. Figs. 6a and 7a show the ΔGop values for residues Tyr127 and Met128 in β1 as obtained from HDX-NMR and HDX-MS studies, respectively.
Most residues in the loop connecting the β1 strand and the N-terminal region of α1 exchange out at a very fast rate. Only residue Ile138 was observed to exchange slowly by both HDX-MS and HDX-NMR. The amide hydrogen of Ile138 is proximal to the methyl group of Met137 and the aromatic ring of Tyr149 and may be sterically hindered from exchange. Hence, local unfolding of the region would be essential for exposing the residue to solvent for exchange as evident from the exchange process having a denaturant dependence of 0.4 kcal mol−1 m−1.
The N-terminal residues in α1 exchange out with very different exchange rates when compared with the C-terminal residues in α1. The N-terminal residues Asp143–Asp146 exchange fast in a denaturant concentration-independent manner. Arg147 and Tyr148 exchange with an mop value of 0.4 kcal mol−1 m−1. The dependence of exchange on denaturant concentration for these residues is significantly different from that of the C-terminal region of α1 (residues Tyr149–Asn152), which shows a higher stability at 0 m urea (Fig. 7, b and c) and an mop value of 0.7 kcal mol−1 m−1. Residues Met153–Tyr156 in the loop connecting α1 and β2 have exchange rates and consequently ΔGop values similar to residues in the C-terminal region of α1. This region shows a dependence of exchange rates on denaturant concentration identical to that of the C-terminal end of α1, which is unusual for residues in loop regions. It has been reported in the case of human PrP that the C-terminal residues 153–156 of α1 undergo a pH-induced elongation to form a 310 helix at neutral pH (60) that becomes disordered at lower pH. In moPrP, residues Met153–Tyr156 were observed to be protected at pH 4, resulting in slow HDX of these residues. It is likely that the elongated 310 helix in the C-terminal end of α1 persists at pH 4.
Residues Gln159, Val160, Tyr161, and Arg163 in segment 154–167 exchange in a denaturant-dependent manner with an mop value of 0.8 kcal mol−1 m−1. Despite being in β2 and surrounded by slow exchanging residues, Tyr162 was observed to exchange fast, whereas previous studies indicate that it has a high ΔGop value at pH 5.5 (19, 20).
In α2, residues Val175, Val179, Asn180, and Ile181 surrounding the disulfide bond between Cys178 and Cys213 were observed to exchange slowly. Surprisingly, the HDX-NMR data show that Cys178, which forms the disulfide with Cys213, exchanges fast, whereas previous HDX studies indicate that it exchanges slowly at pH 5.5 (19, 20). Although the side chain of Cys178 is buried in the core region between α2 and α3, its backbone amide faces away from the core and could be more solvent-exposed at pH 4. As there were no peptides encompassing residues 168–181, the mop value for the above residues could not be determined. However, as these residues have ΔGop values similar to those of the residues around Cys213 (Fig. 6a), the average mop value is expected to be ∼1.1 kcal mol−1 m−1, which is similar to that of sequence segment 205–212. The C-terminal region of α2 has residues extensively H-bonded as a consequence of them being in a helix. But this region has only residue Gln185 protected from exchange because its NH group is H-bonded to Thr182. The highly disordered nature of the C-terminal region of α2 and the loop between α2 and α3, as discussed above, is due to the disruption of hydrophobic interactions upon protonation of His186.
α3 has three distinct regions that have different stabilities and mop values of exchange. Residues in the N- and C-terminal regions exchange with mop values of 0.4 and 0.3 kcal mol−1 m−1, respectively, whereas the central residues around the disulfide bond have an mop value of 1.1 kcal mol−1 m−1. There is also a clear difference in the ΔGop values in the three regions of the helix as shown in Fig. 6.
The ΔGop and average mop values for exchange obtained for different residues from the HDX-MS and HDX-NMR studies are lower than the ΔGU and mU values. Four distinct classes of residues were observed: residues exchanging in a denaturant-independent manner, residues undergoing exchange through unfolding events with an mop value of 0.4 ± 0.03 kcal mol−1 m−1, residues that exchange with an mop value of 0.8 ± 0.1 kcal mol−1 m−1, and a few residues that have an mop value of ∼1.1 ± 0.08 kcal mol−1 m−1. It can be clearly seen from Figs. 6a and 7 that, with the exception of Cys213, all residues exchange upon partial unfolding of the protein, and as a result, low ΔGop and mop values of exchange were observed.
Evidence for Partially Unfolded Forms
PUFs are energetically placed between the native and unfolded states (13, 15, 56, 61). A PUF is typically characterized by an enhanced solvent-accessible surface area that is buried in the native state and a stability (ΔGop) lower than that of the unfolded state relative to the N state. PUFs may be either crucial on-pathway intermediates or off-pathway intermediates populated as a result of fluctuations of the native structure (62–64). Partially unfolded forms have been indicated to be key molecular species in fibril formation (7, 65, 66). It has been seen that mutations or solvent conditions that destabilize the native protein and increase the population of these intermediate forms result in increased amyloidogenicity (67).
The results from native state HDX measurements on moPrP clearly indicate that at least two PUFs are present in equilibrium with the native state. In PUF1 characterized by an mop value of 0.4 ± 0.03 kcal mol−1 m−1 and a stability (ΔGop) of 2.2 ± 0.2 kcal mol−1, β1, the loop region between β1 and α1, and the C-terminal region of α3 appear to be disordered. PUF2 has an mop value of 0.8 ± 0.1 kcal mol−1 m−1 and a stability (ΔGop) of 3.1 ± 0.5 kcal mol−1 and is characterized by a disruption or detachment of α1 and β2 from the α2-α3 core subdomain of the protein. It has been suggested that PUFs are produced by stepwise unfolding and refolding of the cooperative structural units of a protein (64). If PUF1 and PUF2 are indeed intermediates populated sequentially on the unfolding pathway of moPrP, PUF1 would then be characterized by a disordered β1, disordered β1-α1 loop, and disordered C-terminal region of α3. PUF2 additionally would have the α1 and β2 regions either structurally disordered or displaced from the intact core subdomain comprising α2 and α3. However, in this study, native state HDX occurred in the EX2 limit in which only thermodynamic information on intermediates and not kinetic information on the pathway of unfolding can be obtained.
A recent study of the effects of destabilizing pathogenic mutations on the structural dynamics of moPrP has suggested that the unraveling or displacement of α1 from the stable core of the protein is a key initial event in conformational conversion (35). Such a structural perturbation also appears to have occurred in a molten globule-like kinetic intermediate that is also populated at equilibrium under highly acidic conditions, which has been implicated as a key precursor to oligomerization (68, 69). Molecular dynamics studies on the prion protein (34, 70) support these results. Such structural perturbations are identical to those that led to the formation of PUF2. Hence, these studies suggest a potential role of PUF2 in initiating the conversion of PrPC to PrPSc.
No Evidence for Residual Structure in the Unfolded State under Native Conditions
The residues in α2 and α3 around the disulfide bond linking residue Cys213 in α3 with residue Cys178 in α2 have a much higher stability than the rest of the residues in the protein. Their stability is similar to albeit a bit lower than the global stability as shown in Fig. 6a. In earlier studies carried out at pH 5.5, the same region was reported to be more stable than the globally unfolded state by 1.1 kcal mol−1, and as a result it was referred to as a superprotected region (19, 20). Hence, it was suggested that the unfolded state of human PrP and Syrian hamster PrP at pH 5.5 might have residual structure around the disulfide bond. In this study carried out at pH 4, the stability of this region was found to be less than that of the globally unfolded state: with the exception of Cys213, the other residues in this region exchange with an average value of ΔGop that is 1 kcal mol−1 lower than that of the globally unfolded state. This may be the result of pH-induced destabilization of this region in the native state ensemble or the stabilization of the unfolded state ensemble. However, studies of pH-induced changes in the conformational dynamics of the native protein have not indicated that structural changes occur in this region of the N state of the protein (55, 59, 60).
In summary, native state HDX of moPrP(23–231) at pH 4 where the protein is destabilized and has a higher propensity to misfold into amyloidogenic forms revealed the presence of partially unfolded forms that were not detected earlier at pH 5.5 for the human or Syrian hamster prion proteins (19, 20). At pH 4, the N state of moPrP is in equilibrium with at least two PUFs that differ in stability by ∼0.9 kcal mol−1. One of these PUFs appears to resemble a conformation that has been shown to be a key initial intermediate in misfolding and oligomerization (35) and is therefore the likely a monomeric precursor to aggregated forms.
Author Contributions
J. B. U. and R. M. designed the study and wrote the paper. R. M. and R. D. performed the experiments and analyzed the results. The final version of the manuscript was approved by all authors.
Supplementary Material
Acknowledgments
We thank the NMR facility at the National Centre for Biological Sciences and Purushottam Reddy Pothula for assistance in carrying out the experiments on the NMR instrument. We thank M. K. Mathew, R. Varadarajan, and our laboratory members for discussions.
This work was supported in part by the Tata Institute of Fundamental Research, the Department of Science and Technology, and the Department of Biotechnology, Government of India. The authors declare that they have no conflict of interest with the contents of this article.

This article contains supplemental results and Table S1.
R. Moulick, R. Goluguri, and J. B. Udgaonkar, unpublished data.
- PrPC
- cellular prion protein
- PrPSc
- scrapie prion protein
- N
- native
- moPrP
- mouse prion protein
- HDX
- hydrogen-deuterium exchange
- PUF
- partially unfolded form
- ANS
- 1-anilino-8-naphthalene sulfonate
- ΔGop
- free energy of opening of structure
- kint
- intrinsic exchange rate
- ΔGU
- global free energy of unfolding
- mop
- slope of the linear fit to the urea concentration dependence of ΔGop
- mU
- slope of the linear least square fit to the urea concentration dependence (ΔGU) obtained from global unfolding studies.
References
- 1. Gajdusek D. C. (1977) Unconventional viruses and the origin and disappearance of kuru. Science 197, 943–960 [DOI] [PubMed] [Google Scholar]
- 2. Prusiner S. B. (1982) Novel proteinaceous infectious particles cause scrapie. Science 216, 136–144 [DOI] [PubMed] [Google Scholar]
- 3. Prusiner S. B. (1991) Molecular biology of prion diseases. Science 252, 1515–1522 [DOI] [PubMed] [Google Scholar]
- 4. Soto C. (2011) Prion hypothesis: the end of the controversy? Trends Biochem. Sci. 36, 151–158 [DOI] [PMC free article] [PubMed] [Google Scholar]
- 5. Moulick R., Udgaonkar J. B. (2014) Thermodynamic characterization of the unfolding of the prion protein. Biophys. J. 106, 410–420 [DOI] [PMC free article] [PubMed] [Google Scholar]
- 6. Chiti F., Dobson C. M. (2009) Amyloid formation by globular proteins under native conditions. Nat. Chem. Biol. 5, 15–22 [DOI] [PubMed] [Google Scholar]
- 7. Dhulesia A., Cremades N., Kumita J. R., Hsu S. T., Mossuto M. F., Dumoulin M., Nietlispach D., Akke M., Salvatella X., Dobson C. M. (2010) Local cooperativity in an amyloidogenic state of human lysozyme observed at atomic resolution. J. Am. Chem. Soc. 132, 15580–15588 [DOI] [PMC free article] [PubMed] [Google Scholar]
- 8. Bessen R. A., Marsh R. F. (1992) Biochemical and physical properties of the prion protein from two strains of the transmissible mink encephalopathy agent. J. Virol. 66, 2096–2101 [DOI] [PMC free article] [PubMed] [Google Scholar]
- 9. Bessen R. A., Kocisko D. A., Raymond G. J., Nandan S., Lansbury P. T., Caughey B. (1995) Non-genetic propagation of strain-specific properties of scrapie prion protein. Nature 375, 698–700 [DOI] [PubMed] [Google Scholar]
- 10. Makarava N., Baskakov I. V. (2008) The same primary structure of the prion protein yields two distinct self-propagating states. J. Biol. Chem. 283, 15988–15996 [DOI] [PMC free article] [PubMed] [Google Scholar]
- 11. Hughson F. M., Wright P. E., Baldwin R. L. (1990) Structural characterization of a partly folded apomyoglobin intermediate. Science 249, 1544–1548 [DOI] [PubMed] [Google Scholar]
- 12. Jennings P. A., Wright P. E. (1993) Formation of a molten globule intermediate early in the kinetic folding pathway of apomyoglobin. Science 262, 892–896 [DOI] [PubMed] [Google Scholar]
- 13. Bai Y., Sosnick T. R., Mayne L., Englander S. W. (1995) Protein folding intermediates: native state hydrogen exchange. Science 269, 192–197 [DOI] [PMC free article] [PubMed] [Google Scholar]
- 14. Raschke T. M., Marqusee S. (1997) The kinetic folding intermediate of ribonuclease H resembles the acid molten globule and partially unfolded molecules detected under native conditions. Nat. Struct. Biol. 4, 298–304 [DOI] [PubMed] [Google Scholar]
- 15. Juneja J., Udgaonkar J. B. (2002) Characterization of the unfolding of ribonuclease A by a pulsed hydrogen exchange study: evidence for competing pathways for unfolding. Biochemistry 41, 2641–2654 [DOI] [PubMed] [Google Scholar]
- 16. Clarke J., Fersht A. R. (1996) An evaluation of the use of hydrogen exchange at equilibrium to probe intermediates on the protein folding pathway. Fold. Des. 1, 243–254 [DOI] [PubMed] [Google Scholar]
- 17. Dalby P. A., Clarke J., Johnson C. M., Fersht A. R. (1998) Folding intermediates of wild-type and mutants of barnase. II. Correlation of changes in equilibrium amide exchange kinetics with the population of the folding intermediate. J. Mol. Biol. 276, 647–656 [DOI] [PubMed] [Google Scholar]
- 18. Bollen Y. J., Kamphuis M. B., van Mierlo C. P. (2006) The folding energy landscape of apoflavodoxin is rugged: hydrogen exchange reveals nonproductive misfolded intermediates. Proc. Natl. Acad. Sci. U.S.A. 103, 4095–4100 [DOI] [PMC free article] [PubMed] [Google Scholar]
- 19. Hosszu L. L., Baxter N. J., Jackson G. S., Power A., Clarke A. R., Waltho J. P., Craven C. J., Collinge J. (1999) Structural mobility of the human prion protein probed by backbone hydrogen exchange. Nat. Struct. Biol. 6, 740–743 [DOI] [PubMed] [Google Scholar]
- 20. Nicholson E. M., Mo H., Prusiner S. B., Cohen F. E., Marqusee S. (2002) Differences between the prion protein and its homolog Doppel: a partially structured state with implications for scrapie formation. J. Mol. Biol. 316, 807–815 [DOI] [PubMed] [Google Scholar]
- 21. Apetri A. C., Surewicz W. K. (2002) Kinetic intermediate in the folding of human prion protein. J. Biol. Chem. 277, 44589–44592 [DOI] [PubMed] [Google Scholar]
- 22. Apetri A. C., Maki K., Roder H., Surewicz W. K. (2006) Early intermediate in human prion protein folding as evidenced by ultrarapid mixing experiments. J. Am. Chem. Soc. 128, 11673–11678 [DOI] [PMC free article] [PubMed] [Google Scholar]
- 23. Chen K. C., Xu M., Wedemeyer W. J., Roder H. (2011) Microsecond unfolding kinetics of sheep prion protein reveals an intermediate that correlates with susceptibility to classical scrapie. Biophys. J. 101, 1221–1230 [DOI] [PMC free article] [PubMed] [Google Scholar]
- 24. Wildegger G., Liemann S., Glockshuber R. (1999) Extremely rapid folding of the C-terminal domain of the prion protein without kinetic intermediates. Nat. Struct. Biol. 6, 550–553 [DOI] [PubMed] [Google Scholar]
- 25. Swietnicki W., Petersen R., Gambetti P., Surewicz W. K. (1997) pH-dependent stability and conformation of the recombinant human prion protein PrP(90–231). J. Biol. Chem. 272, 27517–27520 [DOI] [PubMed] [Google Scholar]
- 26. Borchelt D. R., Taraboulos A., Prusiner S. B. (1992) Evidence for synthesis of scrapie prion proteins in the endocytic pathway. J. Biol. Chem. 267, 16188–16199 [PubMed] [Google Scholar]
- 27. Arnold J. E., Tipler C., Laszlo L., Hope J., Landon M., Mayer R. J. (1995) The abnormal isoform of the prion protein accumulates in late-endosome-like organelles in scrapie-infected mouse brain. J. Pathol. 176, 403–411 [DOI] [PubMed] [Google Scholar]
- 28. Hornemann S., Glockshuber R. (1998) A scrapie-like unfolding intermediate of the prion protein domain PrP(121–231) induced by acidic pH. Proc. Natl. Acad. Sci. U.S.A. 95, 6010–6014 [DOI] [PMC free article] [PubMed] [Google Scholar]
- 29. Jain S., Udgaonkar J. B. (2008) Evidence for stepwise formation of amyloid fibrils by the mouse prion protein. J. Mol. Biol. 382, 1228–1241 [DOI] [PubMed] [Google Scholar]
- 30. Khan M. Q., Sweeting B., Mulligan V. K., Arslan P. E., Cashman N. R., Pai E. F., Chakrabartty A. (2010) Prion disease susceptibility is affected by β-structure folding propensity and local side-chain interactions in PrP. Proc. Natl. Acad. Sci. U.S.A. 107, 19808–19813 [DOI] [PMC free article] [PubMed] [Google Scholar]
- 31. Bjorndahl T. C., Zhou G. P., Liu X., Perez-Pineiro R., Semenchenko V., Saleem F., Acharya S., Bujold A., Sobsey C. A., Wishart D. S. (2011) Detailed biophysical characterization of the acid-induced PrPC to PrPβ conversion process. Biochemistry 50, 1162–1173 [DOI] [PubMed] [Google Scholar]
- 32. Singh J., Kumar H., Sabareesan A. T., Udgaonkar J. B. (2014) Rational stabilization of helix 2 of the prion protein prevents its misfolding and oligomerization. J. Am. Chem. Soc. 136, 16704–16707 [DOI] [PubMed] [Google Scholar]
- 33. Baskakov I. V., Legname G., Prusiner S. B., Cohen F. E. (2001) Folding of prion protein to its native α-helical conformation is under kinetic control. J. Biol. Chem. 276, 19687–19690 [DOI] [PubMed] [Google Scholar]
- 34. De Simone A., Zagari A., Derreumaux P. (2007) Structural and hydration properties of the partially unfolded states of the prion protein. Biophys. J. 93, 1284–1292 [DOI] [PMC free article] [PubMed] [Google Scholar]
- 35. Singh J., Udgaonkar J. B. (2015) Structural effects of multiple pathogenic mutations suggest a model for the initiation of misfolding of the prion protein. Angew. Chem. Int. Ed. Engl. 54, 7529–7533 [DOI] [PubMed] [Google Scholar]
- 36. Vendrely C., Valadié H., Bednarova L., Cardin L., Pasdeloup M., Cappadoro J., Bednar J., Rinaudo M., Jamin M. (2005) Assembly of the full-length recombinant mouse prion protein I. Formation of soluble oligomers. Biochim. Biophys. Acta 1724, 355–366 [DOI] [PubMed] [Google Scholar]
- 37. Singh J., Sabareesan A. T., Mathew M. K., Udgaonkar J. B. (2012) Development of the structural core and of conformational heterogeneity during the conversion of oligomers of the mouse prion protein to worm-like amyloid fibrils. J. Mol. Biol. 423, 217–231 [DOI] [PubMed] [Google Scholar]
- 38. Bai Y., Milne J. S., Mayne L., Englander S. W. (1993) Primary structure effects on peptide group hydrogen exchange. Proteins 17, 75–86 [DOI] [PMC free article] [PubMed] [Google Scholar]
- 39. Riek R., Hornemann S., Wider G., Glockshuber R., Wüthrich K. (1997) NMR characterization of the full-length recombinant murine prion protein, mPrP(23–231). FEBS Lett. 413, 282–288 [DOI] [PubMed] [Google Scholar]
- 40. Schanda P., Kupce E., Brutscher B. (2005) SOFAST-HMQC experiments for recording two-dimensional heteronuclear correlation spectra of proteins within a few seconds. J. Biomol. NMR 33, 199–211 [DOI] [PubMed] [Google Scholar]
- 41. Hvidt A., Nielsen S. O. (1966) Hydrogen exchange in proteins. Adv. Protein Chem. 21, 287–386 [DOI] [PubMed] [Google Scholar]
- 42. Molday R. S., Englander S. W., Kallen R. G. (1972) Primary structure effects on peptide group hydrogen exchange. Biochemistry 11, 150–158 [DOI] [PubMed] [Google Scholar]
- 43. Chetty P. S., Mayne L., Lund-Katz S., Stranz D., Englander S. W., Phillips M. C. (2009) Helical structure and stability in human apolipoprotein A-I by hydrogen exchange and mass spectrometry. Proc. Natl. Acad. Sci. U.S.A. 106, 19005–19010 [DOI] [PMC free article] [PubMed] [Google Scholar]
- 44. Skinner J. J., Lim W. K., Bédard S., Black B. E., Englander S. W. (2012) Protein hydrogen exchange: testing current models. Protein Sci. 21, 987–995 [DOI] [PMC free article] [PubMed] [Google Scholar]
- 45. Zhang H., Stockel J., Mehlhorn I., Groth D., Baldwin M. A., Prusiner S. B., James T. L., Cohen F. E. (1997) Physical studies of conformational plasticity in a recombinant prion protein. Biochemistry 36, 3543–3553 [DOI] [PubMed] [Google Scholar]
- 46. Cohen F. E., Pan K. M., Huang Z., Baldwin M., Fletterick R. J., Prusiner S. B. (1994) Structural clues to prion replication. Science 264, 530–531 [DOI] [PubMed] [Google Scholar]
- 47. Viles J. H., Donne D., Kroon G., Prusiner S. B., Cohen F. E., Dyson H. J., Wright P. E. (2001) Local structural plasticity of the prion protein. Analysis of NMR relaxation dynamics. Biochemistry 40, 2743–2753 [DOI] [PubMed] [Google Scholar]
- 48. Kuwata K., Li H., Yamada H., Legname G., Prusiner S. B., Akasaka K., James T. L. (2002) Locally disordered conformer of the hamster prion protein: a crucial intermediate to PrPSc? Biochemistry 41, 12277–12283 [DOI] [PubMed] [Google Scholar]
- 49. Hosszu L. L., Wells M. A., Jackson G. S., Jones S., Batchelor M., Clarke A. R., Craven C. J., Waltho J. P., Collinge J. (2005) Definable equilibrium states in the folding of human prion protein. Biochemistry 44, 16649–16657 [DOI] [PubMed] [Google Scholar]
- 50. Kachel N., Kremer W., Zahn R., Kalbitzer H. R. (2006) Observation of intermediate states of the human prion protein by high pressure NMR spectroscopy. BMC Struct. Biol. 6, 16. [DOI] [PMC free article] [PubMed] [Google Scholar]
- 51. Hart T., Hosszu L. L., Trevitt C. R., Jackson G. S., Waltho J. P., Collinge J., Clarke A. R. (2009) Folding kinetics of the human prion protein probed by temperature jump. Proc. Natl. Acad. Sci. U.S.A. 106, 5651–5656 [DOI] [PMC free article] [PubMed] [Google Scholar]
- 52. Gerber R., Tahiri-Alaoui A., Hore P. J., James W. (2007) Oligomerization of the human prion protein proceeds via a molten globule intermediate. J. Biol. Chem. 282, 6300–6307 [DOI] [PubMed] [Google Scholar]
- 53. Gerber R., Tahiri-Alaoui A., Hore P. J., James W. (2008) Conformational pH dependence of intermediate states during oligomerization of the human prion protein. Protein Sci. 17, 537–544 [DOI] [PMC free article] [PubMed] [Google Scholar]
- 54. Liemann S., Glockshuber R. (1999) Influence of amino acid substitutions related to inherited human prion diseases on the thermodynamic stability of the cellular prion protein. Biochemistry 38, 3258–3267 [DOI] [PubMed] [Google Scholar]
- 55. Bae S. H., Legname G., Serban A., Prusiner S. B., Wright P. E., Dyson H. J. (2009) Prion proteins with pathogenic and protective mutations show similar structure and dynamics. Biochemistry 48, 8120–8128 [DOI] [PMC free article] [PubMed] [Google Scholar]
- 56. Mayo S. L., Baldwin R. L. (1993) Guanidinium chloride induction of partial unfolding in amide proton exchange in RNase A. Science 262, 873–876 [DOI] [PubMed] [Google Scholar]
- 57. Wooll J. O., Wrabl J. O., Hilser V. J. (2000) Ensemble modulation as an origin of denaturant-independent hydrogen exchange in proteins. J. Mol. Biol. 301, 247–256 [DOI] [PubMed] [Google Scholar]
- 58. Dima R. I., Thirumalai D. (2004) Probing the instabilities in the dynamics of helical fragments from mouse PrPC. Proc. Natl. Acad. Sci. U.S.A. 101, 15335–15340 [DOI] [PMC free article] [PubMed] [Google Scholar]
- 59. Langella E., Improta R., Barone V. (2004) Checking the pH-induced conformational transition of prion protein by molecular dynamics simulations: effect of protonation of histidine residues. Biophys. J. 87, 3623–3632 [DOI] [PMC free article] [PubMed] [Google Scholar]
- 60. Calzolai L., Zahn R. (2003) Influence of pH on NMR structure and stability of the human prion protein globular domain. J. Biol. Chem. 278, 35592–35596 [DOI] [PubMed] [Google Scholar]
- 61. Dabora J. M., Marqusee S. (1994) Equilibrium unfolding of Escherichia coli ribonuclease H: characterization of a partially folded state. Protein Sci. 3, 1401–1408 [DOI] [PMC free article] [PubMed] [Google Scholar]
- 62. Englander S. W. (1998) Native-state HX. Trends Biochem. Sci. 23, 378–381 [DOI] [PubMed] [Google Scholar]
- 63. Clarke J., Itzhaki L. S. (1998) Hydrogen exchange and protein folding. Curr. Opin. Struct. Biol. 8, 112–118 [DOI] [PubMed] [Google Scholar]
- 64. Englander S. W. (2000) Protein folding intermediates and pathways studied by hydrogen exchange. Annu. Rev. Biophys. Biomol. Struct. 29, 213–238 [DOI] [PubMed] [Google Scholar]
- 65. Booth D. R., Sunde M., Bellotti V., Robinson C. V., Hutchinson W. L., Fraser P. E., Hawkins P. N., Dobson C. M., Radford S. E., Blake C. C., Pepys M. B. (1997) Instability, unfolding and aggregation of human lysozyme variants underlying amyloid fibrillogenesis. Nature 385, 787–793 [DOI] [PubMed] [Google Scholar]
- 66. Jahn T. R., Parker M. J., Homans S. W., Radford S. E. (2006) Amyloid formation under physiological conditions proceeds via a native-like folding intermediate. Nat. Struct. Mol. Biol. 13, 195–201 [DOI] [PubMed] [Google Scholar]
- 67. Hammarström P., Jiang X., Hurshman A. R., Powers E. T., Kelly J. W. (2002) Sequence-dependent denaturation energetics: a major determinant in amyloid disease diversity. Proc. Natl. Acad. Sci. U.S.A. 99, 16427–16432 [DOI] [PMC free article] [PubMed] [Google Scholar]
- 68. Honda R. P., Yamaguchi K., Kuwata K. (2014) Acid-induced molten globule state of a prion protein: crucial role of strand 1-helix 1-strand 2 segment. J. Biol. Chem. 289, 30355–30363 [DOI] [PMC free article] [PubMed] [Google Scholar]
- 69. Honda R. P., Xu M., Yamaguchi K., Roder H., Kuwata K. (2015) A native-like intermediate serves as a branching point between the folding and aggregation pathways of the mouse prion protein. Structure 23, 1735–1742 [DOI] [PMC free article] [PubMed] [Google Scholar]
- 70. Morrissey M. P., Shakhnovich E. I. (1999) Evidence for the role of PrP C helix 1 in the hydrophilic seeding of prion aggregates. Proc. Natl. Acad. Sci. U.S.A. 96, 11293–11298 [DOI] [PMC free article] [PubMed] [Google Scholar]
Associated Data
This section collects any data citations, data availability statements, or supplementary materials included in this article.