

Abstract
Background
Our study intended to identify potential long non-coding RNAs (lncRNAs) and genes, and to elucidate the underlying mechanisms of intervertebral disc degeneration (IDD).
Material/Methods
The microarray of GSE56081 was downloaded from the Gene Expression Omnibus database, including 5 human control nucleus pulposus tissues and 5 degenerative nucleus pulposus tissues, which was on the basis of GPL15314 platform. Identification of differentially expressed lncRNAs and mRNAs were performed between the 2 groups. Then, gene ontology (GO) and pathway enrichment analyses were performed to analyze the biological functions and pathways for the differentially expressed mRNAs. Simultaneously, lncRNA-mRNA weighted coexpression network was constructed using the WGCNA package, followed by GO and KEGG pathway enrichment analyses for the genes in the modules. Finally, the protein-protein interaction (PPI) network was visualized.
Results
A total of 135 significantly up- and 170 down-regulated lncRNAs and 2133 significantly up- and 1098 down-regulated mRNAs were identified. Additionally, UBA52 (ubiquitin A-52 residue ribosomal protein fusion product 1), with the highest connectivity degree in PPI network, was remarkably enriched in the pathway of metabolism of proteins. Eight lncRNAs – LINC00917, CTD-2246P4.1, CTC-523E23.5, RP4-639J15.1, RP11-363G2.4, AC005082.12, MIR132, and RP11-38F22.1 – were observed in the modules of lncRNA-mRNA weighted coexpression network. Moreover, SPHK1 in the green-yellow module was significantly enriched in positive regulation of cell migration.
Conclusions
LncRNAs LINC00917, CTD-2246P4.1, CTC-523E23.5, RP4-639J15.1, RP11-363G2.4, AC005082.12, MIR132, and RP11-38F22.1 were differentially expressed and might play important roles in the development of IDD. Key genes, such as UBA52 and SPHK1, may be pivotal biomarkers for IDD.
MeSH Keywords: Afferent Pathways; Gene Ontology; Intervertebral Disc Degeneration; RNA, Long Noncoding
Background
Intervertebral disc degeneration (IDD) is an important cause of low back pain, which affects patient quality of life and causes heavy socioeconomic burdens [1,2]. Currently, low back pain is mainly treated by medication combined with physiotherapy. Despite progress in surgical therapy, it is not curative and is related with several complications [3]. Fortunately, gene therapy has attracted more attention in recent years [4].
Several studies have unveiled a large number of genes or proteins that are implicated in IDD. For example, a former study has demonstrated that axin2 and Caveolin-1 are down-regulated in IDD [5]. Another study also suggests that expression of IL-1β is significantly higher in IDD [6], and IL-1β provokes the expression of brain-derived neurotrophic factor (BDNF) and vascular endothelial growth factor (VEGF), bringing about angiogenesis in human IDD [7]. Moreover, growth factors including BMP2 as well as TGF-β1 have recently been suggested to enhance the generation of proteoglycans by nucleus pulposus (NP) cells [8]. Degradation of metalloproteinases (MMPs) has been indicated to be connected with IDD [9]. Using a combination of a variety of growth factors has also been proposed to be appropriate to treat IDD, and platelet-rich plasma (PRP) is the source of these growth factors and has inhibitory effects on IDD in a rabbit model [10,11]. Targeting dysregulated genes has been suggested in animal IDD models, with inspiring results [12]. Nevertheless, dysregulation of gene expression is very complicated. Therefore, it is of great importance to elucidate the mechanisms underlying IDD at molecular levels.
Recently, aberrant expression of long non-coding RNAs (lncRNAs) is shown to cause disordered gene expression. LncRNAs are mRNA-like transcripts ranging in length from 200 nt to 100 kb, and they lack significant open reading frames [13,14]. In spite of this, accumulating studies have indicated that lncRNAs play crucial roles in many biological processes and human diseases [15,16]. For example, Wan et al. [17] demonstrated that over-expressed lncRNA RP11-296A18.3 induced the up-regulation of FAF1, which ultimately enhanced the abnormal apoptosis of disc cells. Wan et al. [17] also suggested the crucial roles of differentially expressed lncRNA in the nucleus pulposus of IDD, in which lncRNA-mRNA microarray profile GSE56081 was used. However, there are few studies investigating the role of lncRNAs in IDD. As a result, identifying the aberrant lncRNAs in IDD is still quite a challenge.
In our study, we intended to use the same microarray profile to further identify the differentially expressed lncRNA and mRNAs. Moreover, gene ontology (GO), Kyoto Encyclopedia of Genes and Genomes (KEGG) pathway, construction of lncRNA-mRNA weighted coexpression network, and protein-protein interaction (PPI) network were used to elucidate the molecular mechanism in the process of IDD. We believe that different results obtained from the microarray profile of Wan et al. might provide a profound understanding of IDD.
Material and Methods
Tissue samples and data acquisition
The gene expression data of GSE56081 deposited by Wan et al. [17] was downloaded from the National Center of Biotechnology Information (NCBI) Gene Expression Omnibus (http://www.ncbi.nlm.nih.gov/geo/) database, which was on the basis of GPL15314 platform of Arraystar Human LncRNA microarray V2.0 (Agilent_033010 Probe Name version). A total of 10 samples (5 human control nucleus pulposus tissues and 5 degenerative nucleus pulposus tissues) were included for the development of this microarray.
Data preprocessing
Expression data of probes were converted to corresponding genes symbols according to the annotation of GPL15314 platform. Aggregate() function of R was used to compute the average expression value, which was used for genes corresponding to multi-probes, and KNN method [18] of Impute package of R [19] was used to add the missing values of probes.
Then, quantile normalization was carried out using preprocessCore package of R [20]. Subsequently, the expression matrix was obtained.
Identification of differentially expressed lncRNAs and mRNAs
Limma (linear models for microarray data) package [21] in R was used to identify differentially expressed lncRNAs and mRNAs between the 2 groups through use of the t test. Multiple testing correction was implement by calculating the Benjamini-Hochberg [22] false discovery rate (FDR). |log2 fold-change| >1 and an FDR <0.05 were regarded as the criteria for differential expression.
Gene ontology (GO) and pathway enrichment analysis
GO analysis is frequently used in functional enrichment studies of large-scale genes [23]. Kyoto Encyclopedia of Genes and Genomes (KEGG) enrichment analysis was performed to analyze the biological pathways, involving the differentially expressed mRNAs. In the current study, TargetMine (http://targetmine.nibio.go.jp) [24] was used to investigate the functional enrichment condition for the up- and down-regulated differentially expressed mRNAs. FDR less than 0.05 was selected as the threshold.
The construction of lncRNA-mRNA weighted coexpression network
WGCNA package [25] in R was used to construct the lncRNA/mRNA coexpression network. The network construction steps included the following: (1) Network construction: the lncRNA-mRNA weighted coexpression network is fully specified by its adjacency matrix amn, and amn encodes the network connection strength between nodes m and n. In order to calculate the adjacency matrix, the default approach defines the co-expression similarity Smn as the absolute value of the correlation coefficient between nodes of m and n: Smn=|cor(am, an)|. The weighted adjacency amn between 2 genes is proportional to their similarity on a logarithmic scale with β ≥0.8, log(amn)=β×log(Smn). Adjacency functions were obtained by approximate scale-free topology criterion. Then, the adjacency matrix was converted into topology matrix; (2) Module detection: we applied Dynamic Tree Cut method and Static Tree Cut method to detect modules with a minimum of 30 lncRNA/genes; and (3) Correlation analysis between disease information and gene module using the correlation coefficient method and gene significance (GS) value.
Then, we performed the GO and KEGG pathway enrichment analysis of genes in the module.
PPI network construction
The interaction of the proteins were analyzed by means of the online STRING database (Search Tool for the Retrieval of Interacting Genes, http://string-db.org/) [26] and the combined score >0.9 was used as the cut-off criterion. Subsequently, Cytoscape (http://cytoscapeweb.cytoscape.org/) [27] was used to display the PPI network.
Results
Data preprocessing
On the basis of the annotation information of GPL56081, a total of 18 208 probes were identified, including 1970 lncRNAs and 16238 mRNAs. The data before and after normalization are shown in Figure 1A and 1B.
Figure 1.

(A) Box plot of gene expressions in human control nucleus pulposus tissue and degenerative nucleus pulposus tissue before normalization. (B) Box plot of gene expressions in human control nucleus pulposus tissue and degenerative nucleus pulposus tissue after normalization. The X axis represents samples and the Y axis represents expression level of genes after log2-transformation. The black line in the center is the median of expression value, and consistent distribution implies a good normalization.
Identification of differentially expressed lncRNAs and mRNAs
Based on the cut-off criteria, 135 significantly up- and 170 down-regulated lncRNAs were screened out. Moreover, 2133 significantly up- and 1098 down-regulated mRNAs were observed, as shown in Figure 2.
Figure 2.
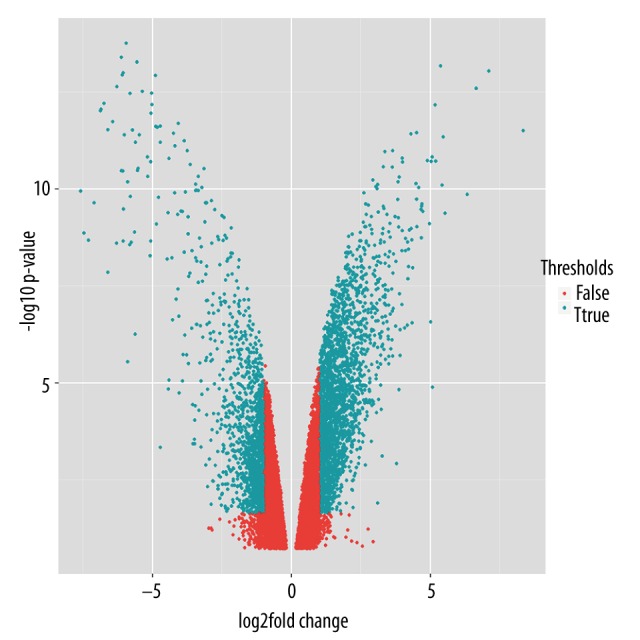
Volcano plots of fold change values of Probesets vs. transformed (log10) and FDR of case group relative to control group. Green points stand for differentially expressed lncRNAs and mRNAs. Red points represent lncRNAs and mRNAs, which are not differentially expressed.
GO and pathway enrichment analysis
TargetMine was used to identify GO enriched functions for significant differentially expressed mRNAs. Top 5 GO and KEGG terms are listed in Table 1. Up-regulated genes were significantly enriched in macromolecule metabolic process (FDR=1.41E-03) and cellular macromolecule metabolic process (FDR=1.28E-03) of BP, membrane-bounded organelle (FDR=1.13E-08) and organelle (FDR=1.74E-07) of CC, RNA binding (FDR=1.31E-05), and nucleic acid binding (FDR=9.35E-04).
Table 1.
The top 5 Gene Ontology (GO) functions and Kyoto Encyclopedia of Genes and Genomes (KEGG) pathways enrichment analysis of up-regulated differentially expressed genes.
| Ontology | Term | FDR | Count |
|---|---|---|---|
| GO terms | |||
| GO-BP | Metabolic process | 2.55×10⁻² | 827 |
| GO-BP | Macromolecule metabolic process | 1.41×10⁻³ | 650 |
| GO-BP | Cellular macromolecule metabolic process | 1.28×10⁻³ | 610 |
| GO-BP | Cellular component organization or biogenesis | 5.10×10⁻³ | 471 |
| GO-BP | Cellular component organization | 1.33×10⁻³ | 468 |
| GO-CC | Intracellular | 2.64×10⁻⁷ | 972 |
| GO-CC | Intracellular part | 9.77×10⁻⁷ | 963 |
| GO-CC | Organelle | 1.74×10⁻⁷ | 946 |
| GO-CC | Membrane-bounded organelle | 1.13×10⁻⁸ | 903 |
| GO-CC | Intracellular organelle | 2.34×10⁻⁷ | 837 |
| GO-MF | Binding | 1.03×10⁻² | 904 |
| GO-MF | Organic cyclic compound binding | 3.76×10⁻² | 309 |
| GO-MF | Heterocyclic compound binding | 2.22×10⁻² | 305 |
| GO-MF | Nucleic acid binding | 9.35×10⁻⁴ | 262 |
| GO-MF | RNA binding | 1.31×10⁻⁵ | 185 |
| KEGG pathways | |||
| KEGG | Gene expression | 2.44×10⁻⁶ | 168 |
| Metabolism of proteins | 9.99×10⁻⁸ | 116 | |
| Cellular responses to stress | 6.40×10⁻¹⁰ | 64 | |
| Translation | 2.24×10⁻¹⁵ | 52 | |
| Alcoholism | 8.50×10⁻¹⁰ | 50 | |
BP – biological process; CC – cellular components; MF – molecular function.
Significantly enriched KEGG pathways of up-regulated differentially expressed mRNAs were mainly on translation (FDR=2.24E-15) and cellular responses to stress (FDR=6.40E-10). However, the significant functions and pathways of down-regulated genes were not identified.
The construction of lncRNA-mRNA weighted coexpression network
In the current study, a total of 7 weighted coexpression sub-networks were identified. The results of correlation analysis demonstrated that in addition to the grey module, the other 6 modules were highly relevant in intervertebral disc degeneration, as shown in Table 2 and Figure 3. Then, lncRNA-mRNA weighted coexpression network was constructed on the basis of the genes with top 30 connectivity degrees in 6 modules and P value <0.01. Among these, 8 lncRNAs were involved in the 4 modules (green module: CTC-523E23.5, RP4-639J15.1 and RP11-363G2.4; green-yellow module: CTD-2246P4.1 and LINC00917; magenta module: AC005082.12; purple module: MIR132 and RP11-38F22.1, Table 3) and were up-regulated (Figure 4A–4D). Notably, in these modules, red diamond nodes represented up-regulated lncRNA, pink square nodes represented up-regulated genes, and pastel green square nodes represented down-regulated genes (Figure 4).
Table 2.
The results of correlation analysis based on correlation coefficient method.
| Module | ME purple | ME greenyellow | ME magenta | ME yellow | ME green | ME grey60 | ME grey |
|---|---|---|---|---|---|---|---|
| Significant | −0.81 | −0.85 | −0.85 | −0.86 | −0.9 | −0.97 | −0.034 |
| P value | 4.93×10⁻³ | 1.80×10⁻³ | 1.67×10⁻³ | 1.29×10⁻³ | 4.65×10⁻⁴ | 4.19×10⁻⁶ | 9.27×10⁻¹ |
Figure 3.
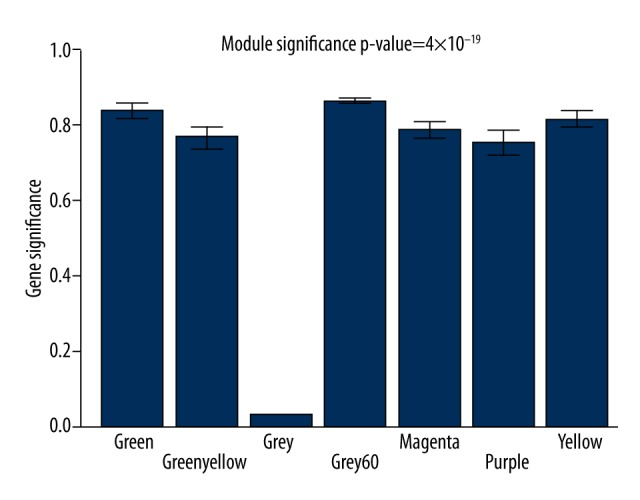
Significant modules in the lncRNA-mRNA weighted coexpression network based on the gene significance (GS) value.
Table 3.
The information of key lncRNAs in different modules.
| Module | Gene id | Gene name | Chromesome | log2FC |
|---|---|---|---|---|
| Purple | ENSG00000267200.1 | MIR132 | chr17 | 1.47 |
| Green | ENSG00000269086.2 | CTC-523E23.5 | chr19 | 1.81 |
| Green | ENSG00000236102.2 | RP4-639J15.1 | chr7 | 1.96 |
| Green yellow | ENSG00000267065.1 | CTD-2246P4.1 | chr17 | 1.53 |
| Green | ENSG00000229556.2 | RP11-363G2.4 | chr13 | 1.90 |
| Magenta | ENSG00000226816.2 | AC005082.12 | chr7 | 2.13 |
| Green yellow | ENSG00000168367.5 | LINC00917 | chr16 | 1.41 |
| Purple | ENSG00000258220.1 | RP11-38F22.1 | chr12 | 1.90 |
FC – fold change.
Figure 4.

The sub-network of genes with top 30 connectivity degrees in green module (A), green-yellow module (B), magenta module (C), and purple module (D). Red diamond nodes stand for up-regulated lncRNA; pink nodes stand for up-regulated genes; pastel green nodes stand for down-regulated genes.
Then, we performed the GO and KEGG pathway enrichment analysis of genes in the module. As shown in Table 4, the genes in the green module were significantly enriched in regulation of cell adhesion and response to axon injury. The genes in the green-yellow module were significantly enriched in positive regulation of cell migration and positive regulation of cell motion. The genes in the magenta module were significantly enriched in nucleotide catabolic process as well as nucleobase, nucleoside, nucleotide, and nucleic acid catabolic process. The genes in the purple module were significantly enriched in contractile fiber part and striated muscle thin filament.
Table 4.
The GO and KEGG pathways enrichment analysis of differentially expressed genes.
| Category | Term | Count | P value | Genes |
|---|---|---|---|---|
| Green module | ||||
| GO_BP | Regulation of cell adhesion | 3 | 3.03×10⁻² | LAMA2, S1PR1, JAK2 |
| GO_BP | Response to axon injury | 2 | 3.92×10⁻² | TXN2, JAK2 |
| GO_BP | Regulation of cell migration | 3 | 4.44×10⁻² | LAMA2, S1PR1, JAK2 |
| GO_BP | Activation of MAPKK activity | 2 | 4.88×10⁻² | ZAK, JAK2 |
| GO_CC | Integral to plasma membrane | 6 | 4.76×10⁻² | STX8, TSPAN31, ICAM3, ITGA11, HLA-DPA1, KCNJ2 |
| REACTOME_PATHWAY | Integrin cell surface interactions | 3 | 1.43×10⁻² | LAMA2, ICAM3, ITGA11 |
| Greenyellow module | ||||
| GO_BP | Positive regulation of cell migration | 3 | 8.29×10⁻³ | EGFR, SPHK1, F7 |
| GO_BP | Positive regulation of cell motion | 3 | 9.97×10⁻³ | EGFR, SPHK1, F7 |
| GO_BP | Positive regulation of locomotion | 3 | 9.97×10⁻³ | EGFR, SPHK1, F7 |
| GO_BP | Regulation of ATPase activity | 2 | 2.46×10⁻² | TPM2, TNNI3 |
| GO_BP | Positive regulation of cell proliferation | 4 | 2.51×10⁻² | EGFR, FGF7, SPHK1, SHC1 |
| GO_MF | Cytoskeletal protein binding | 5 | 7.94×10⁻³ | EGFR, SUN2, FXYD5, TPM2, TNNI3 |
| GO_MF | Actin binding | 4 | 1.49×10⁻² | EGFR, FXYD5, TPM2, TNNI3 |
| GO_CC | Shc-EGFR complex | 2 | 2.97×10⁻³ | EGFR, SHC1 |
| GO_CC | Striated muscle thin filament | 2 | 2.21×10⁻² | TPM2, TNNI3 |
| Magenta module | ||||
| GO_BP | Nucleotide catabolic process | 3 | 3.95×10⁻³ | SMUG1, NTHL1, AMPD3 |
| GO_BP | Nucleobase, nucleoside, nucleotide and nucleic acid catabolic process | 3 | 5.09×10⁻³ | SMUG1, NTHL1, AMPD3 |
| GO_BP | Nucleobase, nucleoside and nucleotide catabolic process | 3 | 5.09×10⁻³ | SMUG1, NTHL1, AMPD3 |
| GO_BP | Nitrogen compound catabolic process | 3 | 6.74×10⁻³ | SMUG1, NTHL1, AMPD3 |
| GO_BP | Heterocycle catabolic process | 3 | 8.81×10⁻³ | SMUG1, NTHL1, AMPD3 |
| GO_MF | Oxidized base lesion DNA N-glycosylase activity | 2 | 5.77×10⁻³ | SMUG1, NTHL1 |
| GO_MF | DNA N-glycosylase activity | 2 | 2.10×10⁻² | SMUG1, NTHL1 |
| GO_MF | Hydrolase activity, hydrolyzing N-glycosyl compounds | 2 | 3.78×10⁻² | SMUG1, NTHL1 |
| Purple module | ||||
| GO_CC | Contractile fiber part | 9 | 4.26×10⁻³ | ACTG2, TNNT3, ACTA1, MYL2, TNNC2, MYL3, TNNC1, ANKRD1, LMAN1 |
| GO_CC | Striated muscle thin filament | 4 | 4.34×10⁻³ | TNNT3, ACTA1, TNNC2, TNNC1 |
| GO_CC | Contractile fiber | 9 | 6.42×10⁻³ | ACTG2, TNNT3, ACTA1, MYL2, TNNC2, MYL3, TNNC1, ANKRD1, LMAN1 |
| GO_CC | Sarcomere | 8 | 7.00×10⁻³ | TNNT3, ACTA1, MYL2, TNNC2, MYL3, TNNC1, ANKRD1, LMAN1 |
| GO_CC | Actin cytoskeleton | 14 | 8.75×10⁻³ | PRKCZ, MYL2, HAX1, ACTA1, TNNC2, MYO1B, TNNC1, MYL3, SNCA, VILL, AMPH, LSP1, ACTG2, TNNT3 |
| GO_BP | Regulation of megakaryocyte differentiation | 3 | 5.55×10⁻³ | TESC, HIST1H4L, PF4, HIST1H4D |
| GO_BP | Negative regulation of protein metabolic process | 12 | 5.81×10⁻³ | BAK1, PRKCZ, SET, EIF4EBP2, ANAPC5, SERPINA5, SNCA, CDC23, ANKHD1, MDM4, EIF2B3, PSMB9 |
| GO_BP | Negative regulation of cellular protein metabolic process | 11 | 1.22×10⁻² | BAK1, PRKCZ, SET, EIF4EBP2, ANAPC5, SERPINA5, SNCA, CDC23, ANKHD1, EIF2B3, PSMB9 |
| GO_BP | Ventricular cardiac muscle morphogenesis | 4 | 1.53×10⁻² | MYL2, MYL3, TNNC1, COL11A1 |
| GO_BP | Nucleosome assembly | 7 | 1.60×10⁻² | HIST1H2AB, HIST1H2BB, HIST1H4L, TSPYL2, SET, HIST1H1A, HIST1H3E, HIST1H4D, HIST1H3G |
| GO_MF | Carbohydrate binding | 16 | 2.02×10⁻² | EPM2A, HEXB, HK2, CHI3L1, POSTN, PF4, LMAN2, GYG1, LMAN1, ITGAM, TNFAIP6, SERPINA5, VEGFA, PKD1, FGF1, SELPLG |
| KEGG_PATHWAY | Cardiac muscle contraction | 8 | 3.55×10⁻³ | UQCRC1, SLC9A6, ATP2A2, MYL2, MYL3, TNNC1, CACNG6, COX6C |
| KEGG_PATHWAY | Systemic lupus erythematosus | 7 | 4.03×10⁻² | HIST1H2AB, HIST1H2BB, TROVE2, HIST1H4L, HLA-DRB4, HIST1H3E, HIST1H4D, HIST1H3G, CTSG |
PPI network
The PPI network of significantly up-regulated genes was constructed using the STRING database. As shown in Figure 5, several PPI nodes were high in connectivity degrees, as follows: UBA52 (ubiquitin A-52 residue ribosomal protein fusion product 1, degree=51), RPS3 (ribosomal protein S3, degree=41), RPL9 (ribosomal protein L9, degree=38), RPL19 (ribosomal protein L19, degree=37), RPL23 (ribosomal protein L23, degree=36), RPL30 (ribosomal protein L30, degree=36), and RPS14 (ribosomal protein S14, degree=36).
Figure 5.

The protein-protein interaction network of significantly up-regulated genes.
Discussion
In this study, we identified 135 significantly up- and 170 down-regulated lncRNAs and 2133 significantly up- and 1098 down-regulated mRNAs. Additionally, up-regulated UBA52 had the highest connectivity degree in PPI network and was remarkably enriched in the pathway of metabolism of proteins. lncRNA-mRNA weighted coexpression network analysis showed that a total of 8 key lncRNAs were identified and were remarkably higher in IDD samples relative to normal tissues, for example, lncRNA LINC00917 and CTD-2246P4.1 were identified in the green-yellow module. These lncRNAs and their interacting genes may be responsible for IDD development and merit further consideration.
Significantly, up-regulated UBA52 had the highest connectivity degrees in PPI network and was remarkably enriched in the pathway of metabolism of proteins in our study. The intervertebral disc (IVD), a specialized fibrocartilaginous connective tissue, is mainly composed of the cell and extracellular matrix (ECM), and the molecular components of ECM are collagen, elastin, and proteoglycans [28]. Generally, the destruction of ECM is believed to be an important cause of IDD because the degradation of ECM help endothelial cells to migrate to further induce the generation of neovascularization [29,30]. MMPs are demonstrated to be the major proteolytic enzymes responsible for destruction of the ECM in the IVD [31]. UBA52 is a fusion protein composed of ubiquitin and ribosomal protein. Moreover, ubiquitin proteins are encoded by some genes, including UBA52 and UBA80, and are typically related with tagging proteins for proteosome degradation [32,33]. A previous study has demonstrated that extracellular ubiquitin increases MMP-2 protein level and enhances the migration of endothelial cells [34]. In light of these results, we infer that inhibiting the expression of UBA52 may be a good strategy in the treatment of IDD by reducing the ubiquitin proteins levels to further suppress the destruction of ECM.
In the green-yellow module, lncRNA LINC00917 and CTD-2246P4.1 were remarkably higher in IDD samples relative to normal tissues. Moreover, their interacted genes, such as up-regulated SPHK1 and down-regulated EGFR, were significantly enriched in positive regulation of cell migration. Several growth factors have been demonstrated to increase endothelial cell migration to further induce the generation of neovascularization [30]. Significantly, the loss of ECM and infiltration of blood vessels are 2 characteristics of IDD [28]. SPHK1 is a members of the SPHKs family, which has been indicated to play a crucial role in cell migration [35]. Moreover, growing evidence has demonstrated that SPHK1 participates in the production of angiogenesis. SPHK1 overexpression promoted endothelial cells survival in the absence of extracellular matrix and played a crucial role in vascular generation [36]. In the current study, the level of SPHK1 was up-regulated. Accordingly, SPHK1 might be a potential biomarker in the process of IDD through increasing endothelial cell migration to further induce the generation of neovascularization. Several previous studies have indicated that the abnormal expression of lncRNAs may dysregulate the expression of their neighboring genes [37]. Our findings suggest that the aberrant expression of SPHK1 may be caused by the up-regulated LINC00917 or CTD-2246P4.1, to further influence the occurrence of IDD. Therefore, lncRNAs LINC00917 and CTD-2246P4.1 may play a key role in the development of IDD via interacting with SPHK1. However, this assumption needs to be further investigated.
Furthermore, our study also identified the other 6 differentially expressed lncRNAs as well as hundreds of differentially expressed genes in different modules. CTC-523E23.5, RP4-639J15.1, and RP11-363G2.4 were identified and could interact with Integrin, Alpha 11 (ITGA11) in the green module. ITGA11 is shown to be differentially expressed and is associated with cell proliferation in IVD [38]. AC005082.12 was screened out and could interact with Ephrin-A3 (EFNA3) in the magenta module. MIR132 and RP11-38F22.1 could interact with Cathepsin L (CTSL) in the purple module. CTSL is demonstrated to degrade ECM and basement membrane components [39]. The destruction of ECM has been regarded to be an important cause of IDD [29,30]. Although the underlying mechanisms of these key lncRNAs in the development of IDD have not been fully discussed in our study, our results indicate that they may contribute to IDD development to some extent.
However, there were still some limitations in the current study. First, sample size was small which might limit the validity of the results. Second, no animal experiments were performed in our study to further validate these results. Thus, large sample sizes and more experiments, such as RNA interference and fluorescence in situ hybridization, are required in future work to more comprehensively elucidate the mechanisms of lncRNAs in the development of IDD.
Conclusions
lncRNAs LINC00917, CTD-2246P4.1, CTC-523E23.5, RP4-639J15.1, RP11-363G2.4, AC005082.12, MIR132, and RP11-38F22.1 were differentially expressed and might play important roles in the development of IDD. Key genes, such as UBA52 and SPHK1, may be pivotal biomarkers for IDD. Nevertheless, further experiments are required to validate their effects and mechanisms in IDD.
Footnotes
Conflict of interest
The authors declare that they have no competing interests.
Source of support: Departmental sources
References
- 1.Luoma K, Riihimäki H, Luukkonen R, et al. Low back pain in relation to lumbar disc degeneration. Spine. 2000;25:487–92. doi: 10.1097/00007632-200002150-00016. [DOI] [PubMed] [Google Scholar]
- 2.Vos T, Flaxman AD, Naghavi M, et al. Years lived with disability (YLDs) for 1160 sequelae of 289 diseases and injuries 1990–2010: a systematic analysis for the Global Burden of Disease Study 2010. Lancet. 2013;380:2163–96. doi: 10.1016/S0140-6736(12)61729-2. [DOI] [PMC free article] [PubMed] [Google Scholar]
- 3.Kumar M, Baklanov A, Chopin D. Correlation between sagittal plane changes and adjacent segment degeneration following lumbar spine fusion. Eur Spine J. 2001;10:314–19. doi: 10.1007/s005860000239. [DOI] [PMC free article] [PubMed] [Google Scholar]
- 4.Tow BP, Hsu WK, Wang JC. Disc regeneration: a glimpse of the future. Clin Neurosurg. 2007;54:122. [PubMed] [Google Scholar]
- 5.Smolders LA, Meij BP, Onis D, et al. Gene expression profiling of early intervertebral disc degeneration reveals a down-regulation of canonical Wnt signaling and caveolin-1 expression: implications for development of regenerative strategies. Arthritis Res Ther. 2013;15:R23. doi: 10.1186/ar4157. [DOI] [PMC free article] [PubMed] [Google Scholar]
- 6.Le Maitre CL, Hoyland JA, Freemont AJ. Catabolic cytokine expression in degenerate and herniated human intervertebral discs: IL-1beta and TNFalpha expression profile. Arthritis Res Ther. 2007;9:R77. doi: 10.1186/ar2275. [DOI] [PMC free article] [PubMed] [Google Scholar]
- 7.Lee JM, Song JY, Baek M, et al. Interleukin-1β induces angiogenesis and innervation in human intervertebral disc degeneration. Orthop Res. 2011;29:265–69. doi: 10.1002/jor.21210. [DOI] [PubMed] [Google Scholar]
- 8.Yoon ST, Kim KS, Li J, et al. The effect of bone morphogenetic protein-2 on rat intervertebral disc cells in vitro. Spine. 2003;28:1773–80. doi: 10.1097/01.BRS.0000083204.44190.34. [DOI] [PubMed] [Google Scholar]
- 9.Eskola PJ, Kjaer P, Daavittila IM, et al. Genetic risk factors of disc degeneration among 12–14-year-old Danish children: a population study. Int J Mol Epidemiol Genet. 2010;1:158–65. [PMC free article] [PubMed] [Google Scholar]
- 10.Wang S-Z, Rui Y-F, Tan Q, Wang C. Enhancing intervertebral disc repair and regeneration through biology: platelet-rich plasma as an alternative strategy. Arthritis Res Ther. 2013;15:220. doi: 10.1186/ar4353. [DOI] [PMC free article] [PubMed] [Google Scholar]
- 11.Gui K, Ren W, Yu Y, et al. Inhibitory effects of platelet-rich plasma on intervertebral disc degeneration: A preclinical study in a rabbit model. Med Sci Monit. 2015;21:1368–75. doi: 10.12659/MSM.892510. [DOI] [PMC free article] [PubMed] [Google Scholar]
- 12.Zhang Y-H, Zhao C-Q, Jiang L-S, Dai L-Y. Lentiviral shRNA silencing of CHOP inhibits apoptosis induced by cyclic stretch in rat annular cells and attenuates disc degeneration in the rats. Apoptosis. 2011;16:594–605. doi: 10.1007/s10495-011-0596-y. [DOI] [PubMed] [Google Scholar]
- 13.Gibb EA, Brown CJ, Lam WL. The functional role of long non-coding RNA in human carcinomas. Mol Cancer. 2011;10:38–55. doi: 10.1186/1476-4598-10-38. [DOI] [PMC free article] [PubMed] [Google Scholar]
- 14.Qi P, Du X. The long non-coding RNAs, a new cancer diagnostic and therapeutic gold mine. Mod Pathol. 2012;26:155–65. doi: 10.1038/modpathol.2012.160. [DOI] [PubMed] [Google Scholar]
- 15.Wilusz JE, Sunwoo H, Spector DL. Long noncoding RNAs: functional surprises from the RNA world. Genes Dev. 2009;23:1494–504. doi: 10.1101/gad.1800909. [DOI] [PMC free article] [PubMed] [Google Scholar]
- 16.Li J, Xuan Z, Liu C. Long non-coding RNAs and complex human diseases. Int J Mol Sci. 2013;14:18790–808. doi: 10.3390/ijms140918790. [DOI] [PMC free article] [PubMed] [Google Scholar]
- 17.Wan Z-Y, Song F, Sun Z, et al. Aberrantly expressed long noncoding RNAs in human intervertebral disc degeneration: a microarray related study. Arthritis Res Ther. 2014;16:465. doi: 10.1186/s13075-014-0465-5. [DOI] [PMC free article] [PubMed] [Google Scholar]
- 18.Altman NS. An introduction to kernel and nearest-neighbor nonparametric regression. Am Stat. 1992;46:175–85. [Google Scholar]
- 19.Hastie T, Tibshirani R, Narasimhan B, Gilbert C. Imputation for microarray data. Bioinformatics. 2001;17:520–25. [Google Scholar]
- 20.Bolstad BM. R package version. 2013. A collection of pre-processing functions; p. 1. [Google Scholar]
- 21.Limma SG. Linear models for microarray data. In: Gentleman R, Carey V, Dudoit S, et al., editors. Bioinformatics and computational biology solutions using R and Bioconductor. Springer; New York: 2005. pp. 397–420. [Google Scholar]
- 22.Benjamini Y, Hochberg Y. Controlling the false discovery rate: a practical and powerful approach to multiple testing. J R Stat Soc Series B. 1995:289–300. [Google Scholar]
- 23.Ashburner M, Ball CA, Blake JA, et al. Gene ontology: tool for the unification of biology. The Gene Ontology Consortium. Nat Genet. 2000;25:25–29. doi: 10.1038/75556. [DOI] [PMC free article] [PubMed] [Google Scholar]
- 24.Chen Y-A, Tripathi LP, Mizuguchi K. TargetMine, an integrated data warehouse for candidate gene prioritisation and target discovery. PLoS One. 2011;6:e17844. doi: 10.1371/journal.pone.0017844. [DOI] [PMC free article] [PubMed] [Google Scholar]
- 25.Langfelder P, Horvath S. WGCNA: an R package for weighted correlation network analysis. BMC Bioinformatics. 2008;9:559. doi: 10.1186/1471-2105-9-559. [DOI] [PMC free article] [PubMed] [Google Scholar]
- 26.Franceschini A, Szklarczyk D, Frankild S, et al. STRING v9. 1: protein-protein interaction networks, with increased coverage and integration. Nucleic Acids Res. 2013;41:D808–15. doi: 10.1093/nar/gks1094. [DOI] [PMC free article] [PubMed] [Google Scholar]
- 27.Saito R, Smoot ME, Ono K, et al. A travel guide to Cytoscape plugins. Nat Methods. 2012;9:1069–76. doi: 10.1038/nmeth.2212. [DOI] [PMC free article] [PubMed] [Google Scholar]
- 28.Le Maitre C, Pockert A, Buttle D, et al. Matrix synthesis and degradation in human intervertebral disc degeneration. Biochem Soc Trans. 2007;35:652–55. doi: 10.1042/BST0350652. [DOI] [PubMed] [Google Scholar]
- 29.Castro MM, Tanus-Santos JE. Inhibition of matrix metalloproteinases (MMPs) as a potential strategy to ameliorate hypertension-induced cardiovascular alterations. Curr Drug Deliv. 2013;14:335–43. doi: 10.2174/1389450111314030005. [DOI] [PubMed] [Google Scholar]
- 30.Urban J, Roberts S. Degeneration of the intervertebral disc. Arthritis Res Ther. 2003;5:120–38. doi: 10.1186/ar629. [DOI] [PMC free article] [PubMed] [Google Scholar]
- 31.Vo NV, Hartman RA, Yurube T, et al. Expression and regulation of metalloproteinases and their inhibitors in intervertebral disc aging and degeneration. Spine J. 2013;13:331–41. doi: 10.1016/j.spinee.2012.02.027. [DOI] [PMC free article] [PubMed] [Google Scholar]
- 32.Lee JH, Lee MJ. Emerging roles of the ubiquitin-proteasome system in the steroid receptor signaling. Arch Pharm Res. 2012;35:397–407. doi: 10.1007/s12272-012-0301-x. [DOI] [PubMed] [Google Scholar]
- 33.Goldberg AL. Protein degradation and protection against misfolded or damaged proteins. Nature. 2003;426:895–99. doi: 10.1038/nature02263. [DOI] [PubMed] [Google Scholar]
- 34.Steagall RJ, Daniels CR, Dalal S, et al. Extracellular ubiquitin increases expression of angiogenic molecules and stimulates angiogenesis in cardiac microvascular endothelial cells. Microcirculation. 2014;21:324–32. doi: 10.1111/micc.12109. [DOI] [PMC free article] [PubMed] [Google Scholar]
- 35.Spiegel S, Milstien S. Sphingosine-1-phosphate: an enigmatic signalling lipid. Nat Rev Mol Cell Biol. 2003;4:397–407. doi: 10.1038/nrm1103. [DOI] [PubMed] [Google Scholar]
- 36.Limaye V, Li X, Hahn C, et al. Sphingosine kinase-1 enhances endothelial cell survival through a PECAM-1–dependent activation of PI-3K/Akt and regulation of Bcl-2 family members. Blood. 2005;105:3169–77. doi: 10.1182/blood-2004-02-0452. [DOI] [PubMed] [Google Scholar]
- 37.Ørom UA, Derrien T, Beringer M, et al. Long noncoding RNAs with enhancer-like function in human cells. Cell. 2010;143:46–58. doi: 10.1016/j.cell.2010.09.001. [DOI] [PMC free article] [PubMed] [Google Scholar]
- 38.Markova DZ, Kepler CK, Addya S, et al. An organ culture system to model early degenerative changes of the intervertebral disc II: profiling global gene expression changes. Arthritis Res Ther. 2013;15:R121. doi: 10.1186/ar4301. [DOI] [PMC free article] [PubMed] [Google Scholar]
- 39.Zhang L, Wei L, Shen G, et al. Cathepsin L is involved in proliferation and invasion of ovarian cancer cells. Mol Med Rep. 2015;11:468–74. doi: 10.3892/mmr.2014.2706. [DOI] [PubMed] [Google Scholar]