

Background: Glucose metabolism in many bacteria is based on the standard linear Embden-Meyerhof-Parnas pathway.
Results: Pseudomonas putida operates a cycle merging components of the Entner-Doudoroff and pentose phosphate pathways along with gluconeogenic reactions from the upper glycolysis to process glucose (EDEMP cycle).
Conclusion: This unusual glycolytic cycle nucleates the central metabolism of P. putida.
Significance: The environmental lifestyle of P. putida is reflected in its central metabolic map.
Keywords: bacterial metabolism, glycolysis, metabolic engineering, Pseudomonas, redox regulation, Entner-Doudoroff, metabolic flux analysis, Pseudomonas putida
Abstract
The soil bacterium Pseudomonas putida KT2440 lacks a functional Embden-Meyerhof-Parnas (EMP) pathway, and glycolysis is known to proceed almost exclusively through the Entner-Doudoroff (ED) route. To investigate the raison d'être of this metabolic arrangement, the distribution of periplasmic and cytoplasmic carbon fluxes was studied in glucose cultures of this bacterium by using 13C-labeled substrates, combined with quantitative physiology experiments, metabolite quantification, and in vitro enzymatic assays under both saturating and non-saturating, quasi in vivo conditions. Metabolic flux analysis demonstrated that 90% of the consumed sugar was converted into gluconate, entering central carbon metabolism as 6-phosphogluconate and further channeled into the ED pathway. Remarkably, about 10% of the triose phosphates were found to be recycled back to form hexose phosphates. This set of reactions merges activities belonging to the ED, the EMP (operating in a gluconeogenic fashion), and the pentose phosphate pathways to form an unforeseen metabolic architecture (EDEMP cycle). Determination of the NADPH balance revealed that the default metabolic state of P. putida KT2440 is characterized by a slight catabolic overproduction of reducing power. Cells growing on glucose thus run a biochemical cycle that favors NADPH formation. Because NADPH is required not only for anabolic functions but also for counteracting different types of environmental stress, such a cyclic operation may contribute to the physiological heftiness of this bacterium in its natural habitats.
Introduction
The genome of the soil bacterium and rhizosphere colonizer Pseudomonas putida KT2440 encodes the enzymes needed to run the following three prominent metabolic routes known for glucose catabolism: the Entner-Doudoroff (ED)3 pathway, the Embden-Meyerhof-Parnas (EMP) pathway, and the pentose phosphate (PP) pathway (Fig. 1) (1–4). One conspicuous absence in this picture, however, is the glycolytic enzyme 6-phosphofructo-1-kinase (Pfk) (5, 6), which catalyzes the ATP-dependent conversion of fructose-6-P (Fru-6-P) into fructose-1,6-P2 (FBP). The lack of Pfk helps explain why P. putida uses almost exclusively the ED pathway (with a very minor contribution of the PP pathway) for hexose degradation, a phenomenon recognized previously by labeling experiments using 14C-labeled substrates and 13C-based metabolic flux analysis (3, 5–11).
FIGURE 1.

Biochemical pathways involved in glucose catabolism in P. putida KT2440. The transformations that take place in the outer membrane and in the periplasmic space are shown at the top of the scheme, along with the transport of glucose, gluconate, and 2-ketogluconate into the cell cytoplasm. The metabolic network was sketched around six main metabolic blocks, identified with different colors: (i) the peripheral pathways, that encompass the oxidative transformation of glucose into gluconate and 2-ketogluconate (and the corresponding phosphorylated derivatives of these metabolites); (ii) EMP pathway (non-functional, due to the absence of a 6-phosphofructo-1-kinase activity); (iii) the pentose phosphate (PP) pathway; (iv) the ED pathway; (v) the tricarboxylic acid cycle and glyoxylate shunt; and (vi) anaplerotic and gluconeogenic bioreactions. Some bioreactions have been lumped to simplify the diagram. The transport of gluconate and 2-ketogluconate from the extracellular space is indicated by gray arrows. The complete list of the enzymes and isozymes catalyzing each reaction is shown below the biochemical network. The information for the network was compiled from the Pseudomonas Genome Database (75) and MetaCyc (76) and several studies available in the literature (3, 5, 7, 8, 11). In the instances in which no gene name has been assigned, the PP number is given for each open reading frame. Note that, according to Nelson et al. (77), pckA (encoding phosphoenolpyruvate carboxykinase) contains an authentic frameshift and therefore the open reading frame is classified as a pseudogene in the Pseudomonas Genome Database (75). Abbreviations are as follows: G6P, glucose-6-P; F6P, fructose-6-P; FBP, fructose-1,6-P2; DHAP, dihydroxyacetone-P; 6PG, 6-phosphogluconate; KDPG, 2-keto-3-deoxy-6-phosphogluconate; Ri5P, ribulose-5-P; R5P, ribose-5-P; X5P, xylulose-5-P; S7P, sedoheptulose-7-P; E4P, erythrose-4-P; G3P, glyceraldehyde-3-P; 3PG, glycerate-3-P; PEP, phosphoenolpyruvate; Acetyl-CoA, acetyl-coenzyme A; OAA, oxaloacetate; 2-KGT, 2-ketoglutarate; and Pi, inorganic phosphate.
In P. putida KT2440, glucose can be either phosphorylated in the cytoplasm by glucokinase (Glk) or oxidized in the periplasm to gluconate and/or 2-ketogluconate (2-KG) by means of glucose dehydrogenase and/or gluconate 2-dehydrogenase (8, 12). Three convergent pathways further transform these metabolic intermediates into 6-phosphogluconate (6PG) as follows: (i) the phosphorylative branch, in which glucose-6-P (Glc-6-P) is the intermediate via the sequential activity of Glc-6-P 1-dehydrogenase (Zwf) and 6-phosphogluconolactonase; (ii) the direct phosphorylation of gluconate, mediated by gluconokinase (GnuK); and (iii) the 2-KG loop, which involves its transport back into the cytoplasm and its conversion into 2-keto-6-phosphogluconate (2K6PG) via 2-KG kinase (KguK), later reduced to 6PG via 2K6PG reductase (KguD) (Fig. 1). The ED pathway encompasses 6PG dehydratase (Edd), which uses 6PG to yield 2-keto-3-deoxy-6-phosphogluconate (KDPG). This product is in turn split by KDPG aldolase (Eda) into two trioses, pyruvate (Pyr) and glyceraldehyde-3-P (Glc-3-P).
The conservation and prevalence of the ED route in many environmental bacteria and archaea over a linear glycolysis (13–16) suggest a connection between metabolism and lifestyle that has not been disclosed so far. Currently available metabolic models of P. putida KT2440, based on genome annotations, entertain a simple top-down operation of a linear ED pathway (17–19). Yet, the co-existence of a complete ED route along with a partial EMP route and three alternative possibilities for glucose uptake (Fig. 1) hint at more complex scenarios. Such conspicuous metabolic plasticity potentially echoes the many survival strategies of this bacterium in its natural habitats (20, 21).
In this work, we explored which parts of the aforementioned sugar consumption pathways are active in P. putida KT2440 under specific and controlled environmental conditions. Our strategy encompassed 13C-tracer experiments, combined with the exploration of physiological parameters and the in vitro measurement of enzymatic activities under both saturating and non-saturating, quasi in vivo conditions. Taken together, our results demonstrate that the ED pathway merges its activity with a gluconeogenic operation of the upper EMP and the PP pathway for recycling triose phosphates back into hexose phosphates. This situation gives rise to a metabolic itinerary of key intermediates through what we call the EDEMP cycle (i.e. recruiting activities from the ED, EMP, and PP pathways). This particular metabolic architecture could have evolved to ensure an appropriate supply of NADPH reducing power for coping with the environmental stress that prevails in the natural niches of this bacterium.
Experimental Procedures
Chemicals and Enzymes
[1-13C]Glucose and [6-13C]glucose were purchased from Cambridge Isotope Laboratories, Inc. (Tewksbury, MA), and [U-13C6]glucose was purchased from Sigma. Other chemicals and enzymes used for in vitro assays were obtained from Sigma and Merck KGaA (Darmstadt, Germany).
Bacterial Strains and Growth Conditions
P. putida strains used in this work are derivatives of wild-type KT2440 (22). Quantitative physiology experiments were carried out in M9 minimal medium (6 g liter−1 Na2HPO4, 3 g liter−1 KH2PO4, 1.4 g liter−1 (NH4)2SO4, 0.5 g liter−1 NaCl, 0.2 g liter−1 MgSO4·7H2O) with 2.5 ml liter−1 of a trace elements solution added (23). Media were amended either with glucose (20 mm), gluconate (20 mm), 2-KG (20 mm), succinate (30 mm), or benzoate (17 mm) as the sole carbon and energy source (i.e. 120 mm carbon atoms). Solid media contained 15 g liter−1 agar. Tn5 mutants of P. putida KT2440 (24) were maintained by adding kanamycin to the culture media at 25 μg ml−1. Growth was estimated by measuring the absorbance at 600 nm (A600) after diluting the culture with 9 g liter−1 NaCl when needed. Correlation factors between cell dry weight (CDW) and A600 were determined in batch cultures. All cultures were started with an isolated colony from a fresh LB medium (25) plate and suspended in 5 ml of the culture medium in a test tube. After incubating the culture for 18 h, it was used to inoculate fresh medium at an A600 of 0.05. Working cultures were set in 250-ml Erlenmeyer flasks containing culture medium up to one-fifth of their nominal volume.
Determination of Physiological Parameters
Regression analysis was applied during exponential growth to calculate the following: (i) the maximum specific growth rate (μ); (ii) the biomass yield on substrate (YX/S); (iii) the specific rate of glucose or succinate consumption (qS); and (iv) the molar yield of organic acids on glucose (yP/S). CDW was measured by harvesting cells by fast filtration in pre-weighed nitrocellulose filters (0.45 μm), washed twice with 9 g liter−1 NaCl, and dried at 105 °C to a constant weight. Succinate was determined with a kit from Megazyme International (Wicklow, Ireland), with the modifications previously described by Nikel et al. (26). Glucose was assayed using a commercial kit from R-Biopharm AG (Darmstadt, Germany). Gluconate and 2-KG were measured in culture supernatants as indicated elsewhere (6, 26).
Determination of Metabolite Concentrations by LC-MS/MS
Cultures were grown until they reached the mid-exponential phase (A600 = 0.5), at which point the biomass corresponding to 0.5–0.6 mg of CDW was collected in triplicate by fast centrifugation (13,000 × g, 30 s, −4 °C). Bacterial pellets were immediately frozen in liquid N2. Samples were then extracted three times with 0.5 ml of 60% (v/v) ethanol buffered with 10 mm ammonium acetate (pH 7.2) at 78 °C for 1 min. After each extraction step, the biomass was separated by centrifugation at 13,000 × g for 1 min. The three liquid extracts were pooled and dried at 120 microbars and then stored at −80 °C. Samples were resuspended in 20 μl of MilliQ water, distributed in sealed 96-well microtiter plates, and injected into a Waters Acquity UPLC (Waters Corp., Milford, MA) with a Waters Acquity T3 column (150 mm × 2.1 mm × 1.8 μm, Waters Corp.) coupled to a Thermo TSQ Quantum Ultra triple quadrupole instrument (Thermo Fisher Scientific Inc., Waltham, MA) with electrospray ionization (27).
Determination of 13C Labeling Patterns by LC-MS/MS
Cultures were grown on either 100% [1-13C]glucose or 100% [6-13C]glucose as the sole carbon source, harvested, and processed as described above. The 13C labeling patterns of free intracellular metabolites were determined on the system mentioned above for dihydroxyacetone-P (DHAP), Fru-6-P, FBP, Glc-6-P, 6PG, phosphoenolpyruvate, ribose-5-P, ribulose-5-P, sedoheptulose-7-P, xylulose-5-P, and Pyr as described previously (28). The raw data of two independent labeling experiments are available in supplemental Table S1.
Determination of 13C Labeling Patterns by GC-MS
Cultures were grown on either 100% [1-13C]glucose or a mixture of 20% (w/w) [U-13C6]glucose and 80% (w/w) natural glucose, and 5-ml aliquots of cell broth were harvested at the mid-exponential phase of growth (A600= 0.5) by centrifugation at 1,200 × g and 4 °C for 10 min. Bacterial pellets were washed twice with 1 ml of 9 g liter−1 NaCl, hydrolyzed in 1 ml of 6 m HCl for 24 h at 110 °C, and desiccated overnight at 85 °C under a constant air stream. The hydrolysate was dissolved in 50 μl of 99.8% (w/v) dimethyl formamide and subsequently transferred into a new tube. For derivatization, 30 μl of N-methyl-N-(tert-butyldimethylsilyl)-trifluoroacetamide was added to the hydrolysate and incubated at 85 °C for 60 min. The 13C labeling patterns of proteinogenic amino acids were determined on a 6890N Network GC system with a 5975 inert XL mass selective detector (Agilent Technologies Inc., Santa Clara, CA) as described previously (29, 30). The raw GC-MS data from four independent experiments is presented in supplemental Table S2.
Metabolic Flux Ratio Analysis
Mass distribution vectors of the proteinogenic amino acids were corrected for the natural abundance of all stable isotopes, and the relative metabolic flux ratios (i) oxaloacetate (OAA) from Pyr, (ii) glyoxylate shunt, (iii) phosphoenolpyruvate from OAA, and (iv) the lower and upper bound for Pyr from malate (Table 2) were calculated using the Fiat Flux software (31). The mass distribution vectors of the free intracellular metabolites were corrected for the natural abundance of all stable isotopes using MatLab (The MathWorks Inc., Natick, MA) and novel relative flux ratios (Table 2) were defined and calculated as follows.
TABLE 2.
Selected metabolic flux ratios used for ratio-constrained flux balance analysis
Calculations for each ratio are indicated in Equations 5–12 under “Experimental Procedures.” Abbreviations used in this table are as follows: UB, upper bound; LB, lower bound; S.D., standard deviation, and ND, not detected.
| Metabolic flux ratio | Reaction code(s) in Fig. 1 | Relative value (mean ± S.D.)a |
|---|---|---|
| Glc-6-P from glucoseb | 3 | 0.53 ± 0.06 |
| 6PG from Glc-6-Pb | 7 | 0.14 ± 0.02 |
| 6PG from Glc-6-Pc | 7 | 0.17 ± 0.02 |
| Fru-6-P from the PP pathwayc | 14, 15 | 0.23 ± 0.03 |
| Pyruvate through the ED pathwayb | 9 | 0.44 ± 0.02 |
| Glyoxylate shuntd | 31 | ND |
| OAA from pyruvated | 32 | 0.68 ± 0.01 |
| Phosphoenolpyruvate from oxaloacetated | 33 | −0.03 ± 0.03 |
| Pyruvate from malate (UB) d | 34 | 0.92 ± 0.05 |
| Pyruvate from malate (LB) d | 34 | 0.29 ± 0.01 |
a Standard deviations for each relative metabolic flux ratio were calculated using the covariance matrices of the respective mass distribution vectors by applying the Gaussian law of error propagation.
b Data were determined from 100% [1-13C]glucose experiments.
c Data were determined from 100% [6-13C]glucose experiments.
d Data were determined from 20% [U-13C6]glucose experiments.
The fraction of Glc-6-P originating from glucose was estimated using data from the experiments using 100% [1-13C]glucose as shown in Equation 1,
 |
and 6PG from Glc-6-P was calculated using data from either 100% [1-13C]glucose or 100% [6-13C] glucose experiments as shown in Equation 2:
 |
Fru-6-P through the PP pathway using data from 100% [6-13C]glucose experiments is shown in Equation 3,
 |
Fru-6-Psim(1–6) was calculated from the experimentally determined mass distribution vectors of DHAP, ribose-5-P, ribulose-5-P, and xylulose-5-P by assuming that Fru-6-Psim is formed exclusively by the forward reaction flux through the PP pathway.
Pyr through the ED pathway was calculated using data from 100% [1-13C]glucose experiments as shown in Equation 4,
 |
The PP pathway yields unlabeled trioses-3-P, whereas the ED pathway yields 50% unlabeled and 50% triose-3-P that is 13C-labeled at position C1.
13C-Constrained Metabolic Flux Analysis
The metabolic model used for net flux analysis was based on a master reaction network with 45 reactions and 33 metabolites. Fluxes were calculated using the following: (i) the stoichiometric reaction matrix; (ii) constraints accounting for the ratios from FiatFlux analysis and additionally for the ratios in the initial steps of glucose catabolism as described above (see also Table 2); (iii) physiological data; and (iv) precursor requirements for biomass. The experimentally determined relative flux ratios were translated into constraints as follows (the reaction numbers, vx, are defined in Fig. 1). The fraction of Glc-6-P originating from glucose (a) was estimated as shown in Equation 5,
 |
The fraction of Fru-6-P originating through the PP pathway (b) was calculated as shown in Equation 6,
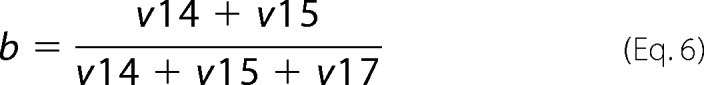 |
The fraction of 6PG originating from Glc-6-P (c) was determined as shown in Equation 7,
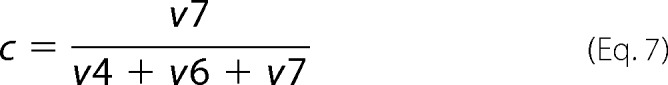 |
For this ratio, the values from the experiments using data from either 100% [1-13C]glucose or [6-13C]glucose were averaged.
The fraction of Pyr originating through the ED pathway (d) was determined as shown in Equation 8,
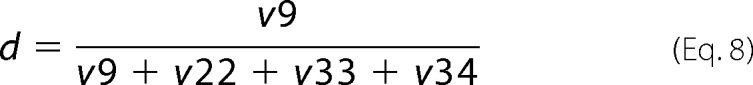 |
The upper and lower bounds of Pyr originating from malate (e and f, respectively) were obtained according to Equations 9 and 10,
 |
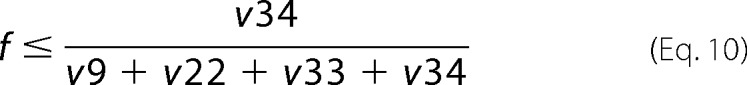 |
The fraction of OAA originating from Pyr (g) was obtained following Equation 11,
 |
Finally, the fraction of Pyr originating from OAA (h) was derived from Equation 12,
 |
The determined linear system of mass balances, flux ratios, quantitative physiology data, and biomass requirements was then solved with the fmincon function from MatLab using the Netto module from FiatFlux (31) to obtain the net metabolic fluxes as described previously (32). The values for all the fluxes within the network are provided in supplemental Table S4.
Preparation of Cell-free Extracts and In Vitro Enzymatic Assays under Saturating and Non-saturating, Quasi in Vivo Conditions
Cell-free extracts were prepared from cells grown to the mid-exponential phase (A600 = 0.5; except for AceA, which was assayed at 24 h) and harvested by centrifugation from an appropriate culture volume at 4,000 × g at 4 °C for 10 min. Pellets were suspended in 1 volume of 10 mm PBS (pH 7.5, previously refrigerated) containing 10 mm 2-mercaptoethanol and centrifuged again. Cells were finally resuspended in 0.3–0.5 volume of the same buffer and sonicated intermittently for 6 min in an ice bath (33–35). Sonicated cells were centrifuged at 7,500 × g at 4 °C for 30 min, and the total protein concentration in cell extracts was measured by the Bradford method (36).
The activities of Edd, Eda, fructose-1,6-bisphosphatase (Fbp), Fda (FBP aldolase), triose-phosphate isomerase (TpiA), citrate synthase (GltA), AceA (isocitrate lyase), Glk, GnuK, and KguK were assayed under saturating conditions using standard protocols (6, 26, 34, 37–41). The activity of the main NAD(P)(+/H)-dependent dehydrogenases within the biochemical network (i.e. Zwf, Gnd, Icd, Mdh, KguD, Glc-3-P dehydrogenase, and MaeB) were assayed under both saturating and non-saturating, quasi in vivo conditions. For those reactions in which more than one enzyme catalyzes the corresponding transformation (e.g. Zwf, for which there are three isozymes in P. putida KT2440), the total activity is reported. In the latter case, the concentrations of the substrates (experimentally determined in cell-free extracts of glucose-grown KT2440 by means of LC-MS/MS, except for 2K6PG, which was taken from the literature (42)) were as follows: Glc-6-P, 1200 μm; 6PG, 2300 μm; isocitrate, 25 μm; oxaloacetate, 300 μm; 2K6PG, 1 μm; Glc-3-P, 140 μm; and malate, 150 μm. The intracellular concentrations of pyridine nucleotides were also experimentally determined (see below), and each dehydrogenase was assayed in the presence of NAD(+/H) or NADP(+/H) to calculate its cofactor specificity. The intracellular volume was taken from van der Werf et al. (42). Protocols used were described by Fuhrer and Sauer (39), except for the KguD assay, adapted from Latrach-Tlemçani et al. (6). In these assays, the reduction of NAD(P)+ or the oxidation of NAD(P)H was dynamically monitored spectrophotometrically at 340 nm. An extinction coefficient (ϵNAD(P)H) of 6.22 mm−1 cm−1, representing the difference between the extinction coefficients of NAD(P)H and NAD(P)+, was used. In all cases, 1 unit of enzyme activity was defined as the quantity of enzyme that catalyzed the formation of 1 μmol of the corresponding product per min at 30 °C.
Determination of Pyridine Nucleotides and Redox Balances
The redox status of the cells growing on glucose was explored by assessing the intracellular levels of NADP+ and NADPH using in vitro cyclic assays (43, 44). Exponentially growing P. putida cells (A600 = 0.5) were immersed in liquid N2 to inactivate metabolism, followed by nucleotide extraction with either HCl or NaOH. NADPH/NADP+ redox ratios were derived from these measurements as described previously (5). Net rates of NADPH formation were obtained by subtracting all fluxes consuming NADPH from the sum of those forming NADPH (each flux multiplied by the corresponding cofactor specificity of the dehydrogenase catalyzing the bioreaction at stake). Further details on these calculations are given by Nikel and Chavarría (45).
Results
Growth of P. putida KT2440 Mutants Lacking Key Enzymes of the Central Carbon Metabolism
The starting point of this study was the assessment of the relevance of the three glucose catabolism routes in P. putida KT2440, composed of the ED, PP, and the partial EMP pathways (Fig. 1 and supplemental Table S3). To this end, we determined growth phenotypes of mutants bearing Tn5 insertions (24) in genes of each route. Cultures were grown on M9 minimal medium plates with either glucose or the gluconeogenic substrate succinate (Fig. 2A). 6PG dehydratase (encoded by edd) was essential for growth on glucose but not under a gluconeogenic regime. The eda mutant, predicted to grow on both glucose and succinate (46), only grew on the organic acid. In this case, the loss of the KDPG aldolase may result in accumulation of toxic KDPG when cells metabolize sugars (10), thereby inhibiting growth. The requirement of Glc-6-P dehydrogenase was less clear to verify, as the zwf-1 mutant (lacking the main Zwf isoenzyme) grew in the two carbon sources. However, it is possible that the two other paralogs encoded by zwf-2 and zwf-3 can take over and complement an otherwise essential metabolic functionality, as recently shown in Pseudomonas fluorescens (47). Furthermore, a complete Zwf mutant has not been attainable thus far in our laboratory, and the individual functionality of each isozyme remains to be explored.
FIGURE 2.
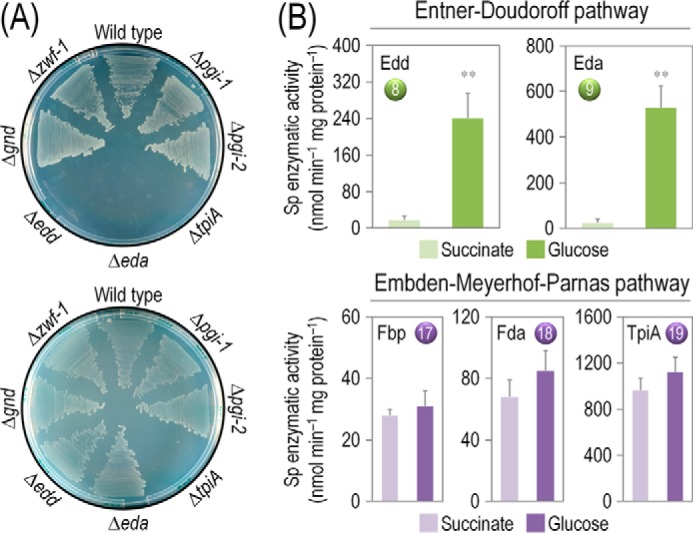
Growth of P. putida KT2440 and mutant derivatives under glycolytic and gluconeogenic growth conditions and in vitro determination of key enzymatic activities. A, M9 minimal medium plates, containing either 20 mm glucose (top plate) or 30 mm succinate (bottom plate), were seeded with P. putida KT2440 (wild-type strain (22)), and the single mutants pgi-1 (PP1808, glucose-6-P isomerase), pgi-2 (PP4701, glucose-6-P isomerase), tpiA (PP4715, triose phosphate isomerase), eda (PP1024, 2-keto-3-deoxy-6-phosphogluconate aldolase), edd (PP1010, 6-phosphogluconate dehydratase), gnd (PP4043, 6-phosphogluconate dehydrogenase), and zwf-1 (PP1022, glucose-6-P 1-dehydrogenase) (24). Plates were incubated at 30 °C for 36 h and photographed. B, in vitro determination of enzyme activities belonging to the Entner-Doudoroff and the Embden-Meyerhof-Parnas pathways. Specific (Sp) enzymatic activities of Edd, Eda, Fbp, Fda, and TpiA were determined in cell-free extracts from P. putida KT2440 cells grown on M9 minimal medium added with either 30 mm succinate or 20 mm glucose during exponential growth. The circled numbers identify the enzymes in the biochemical network of Fig. 1. Each bar represents the mean value of the corresponding enzymatic activity ± standard deviations of duplicate measurements from at least three independent experiments, and the asterisk symbols indicate a significant difference with p < 0.01 (**) (Student's t test) in the level of the corresponding enzymatic activity in glucose cultures as compared with that in succinate cultures.
Regarding the PP route, the gnd mutant (lacking 6PG dehydrogenase) grew in either culture condition, indicating that the key reaction that feeds the PP pathway is not essential. Inspection of mutants in the EMP pathway, in contrast, originated some puzzling results. First, because pgi mutants (lacking either pgi-1 or pgi-2) grew on both glucose and succinate, it is possible that each of them separately delivers the necessary Glc-6-P isomerase activity. Second, several attempts in our laboratory to obtain an fbp mutant of P. putida KT2440 were unsuccessful, indicating the same essential role already suggested for the orthologous gene of P. aeruginosa (48). Yet, the most unexpected result was the lack of growth of a tpiA mutant in either glucose or succinate. TpiA is a key step of the downward EMP pathway. According to the current metabolic picture of P. putida, this reaction should be dispensable (46), as was shown for Escherichia coli (49, 50). As the ED pathway yields Glc-3-P and Pyr from glucose, thereby replenishing the pool of triose phosphates, the reaction catalyzed by TpiA is not expected to have a major effect on bacterial growth on the hexose. Taken together, these results indicate that the ED pathway is essential for the growth of P. putida KT2440 on glucose, with a negligible contribution of the PP pathway. The partial EMP route, however, was found to be remarkably relevant for glucose processing under these conditions.
The results of the growth tests above were further substantiated by measuring in vitro the activity of some enzymes within the biochemical network of P. putida (Fig. 2B). As expected, Edd and Eda, catalyzing the two steps of the ED pathway, were significantly active in glucose cultures. In contrast, Fbp, Fda, and TpiA, components of the EMP pathway, were equally active in both glucose and succinate cultures. The high activity of these enzymes not only helps explain why the tpiA mutant failed to grow on succinate cultures (Fig. 2A), but it also indicates that Fbp and Fda are unexpectedly active in glucose-grown P. putida KT2440 cells, which are conditions under which the EMP pathway is in principle not expected to participate in the catabolism of glucose (1, 8). These inconsistencies between the extant biochemical models (i.e. indicating that the ED pathway is the only route involved in glucose catabolism) and the observed growth phenotypes of P. putida mutants (i.e. in some mutants lacking enzymes of the partial EMP pathway) prompted us to quantitatively revisit the cell physiology as well as the principal enzyme activities and metabolic fluxes that rule the functioning of the central carbon metabolism in this bacterium.
Physiological Parameters in Batch Cultures of P. putida KT2440 Grown on Different Carbon Sources
The key growth parameters of wild-type strain KT2440 were analyzed in shaken-flask cultures under glycolytic or gluconeogenic growth regimes (Table 1). Succinate promoted the fastest growth, probably because of the constitutive expression of the enzymes needed for its catabolism (26), accompanied by the absence of any detectable lag phase. However, this fast growth was also paralleled by lower qS and YX/S values as compared with the same parameters in glucose cultures. The YX/S value on glucose suggests that approximately half of the carbon consumed by P. putida is ultimately channeled into biomass formation. Interestingly, we detected a lag phase of 1.2 ± 0.5 h when fresh glucose-containing medium was inoculated with cells pre-grown under the same conditions.
TABLE 1.
Growth parameters in batch cultures of P. putida KT2440 grown under glycolytic or gluconeogenic metabolic regimes
The values shown in this table represent the mean of the corresponding parameter ± standard deviation of triplicate measurements from at least four independent experiments.
| Carbon sourcea | μb | qSb | YX/Sc | Organic acids concentrationd |
|
|---|---|---|---|---|---|
| Gluconate | 2-Ketogluconate | ||||
| h−1 | mmol gCDW−1 h−1 | gCDW g−1 | mm | ||
| Glucose | 0.55 ± 0.01 | 6.14 ± 0.04 | 0.49 ± 0.02 | 2.13 ± 0.08 | 0.44 ± 0.03 |
| Succinate | 0.71 ± 0.09 | 4.35 ± 0.08 | 0.38 ± 0.03 | ND | ND |
a Each carbon source was amended to M9 minimal medium to provide 120 mm carbon atoms (i.e., 20 mm glucose or 30 mm succinate).
b The specific growth rate (μ) and the specific rate of carbon uptake (qS) were determined during exponential growth by linear regression.
c The yield of biomass on substrate (YX/S) was determined at 24 h, after the corresponding carbon source was exhausted.
d The organic acid concentration is the maximal reached during the whole culture period. ND, not detected.
One of the noteworthy characteristics of glucose metabolism in P. putida KT2440 (and other pseudomonads as well (51)) is an oxidative pathway for hexose processing (involving glucose dehydrogenase and gluconate 2-dehydrogenase), along with the more classical phosphorylative pathway (in which glucose is phosphorylated to Glc-6-P by the ATP-dependent Glk) (3, 8, 52, 53). However, the partial contribution of these two branches of hexose processing to carbon breakdown has remained elusive so far. In shaken-flask cultures, P. putida KT2440 formed both gluconate and 2-KG from glucose (Table 1). The concentration of these acids peaked during exponential growth, and the corresponding molar yields of gluconate and 2-KG on glucose were yG/S = 0.34 ± 0.02 and yK/S = 0.11 ± 0.01 C-mol C-mol−1, respectively. The concentration of both acids decreased as the growth proceeded, almost disappearing after 24 h. Neither gluconate nor 2-KG was detected in supernatants of succinate cultures, and no other excreted by-product was observed in either carbon source (e.g. acetate, lactate, or Pyr). These results suggest that the catabolic pathways of P. putida, including the periplasmic oxidation of hexoses, are dependent on the carbon source used and also on the activity of the three kinases in the upper metabolic domain (Fig. 1).
Functional Assessment of the Peripheral Pathways for Glucose Catabolism in P. putida KT2440
The relative contribution of the three initial routes for glucose processing in P. putida (i.e. direct phosphorylation or conversion into gluconate and 2-KG followed by phosphorylation of the oxidized intermediates, Fig. 1) remains obscure. Note that strain KT2440 can grow not only on glucose but also on gluconate or 2-KG as the sole carbon source (Fig. 3A). The different doubling times suggest that gluconate is the most preferred substrate followed by glucose and then by 2-KG. Interestingly, all three kinases acting on glucose, gluconate, or 2-KG (i.e. Glk, GnuK, and KguK, respectively) were highly active in cells grown on glucose, although during gluconeogenesis their activity was very low (Fig. 3B). Glk had the highest in vitro activity, closely followed by GnuK and then by KguK. This distribution of kinase activities provides a first indication that most of the gluconate formed by glucose dehydrogenase is directly phosphorylated to 6PG, rather than being further oxidized into 2-KG and converted into 2K6PG. This biochemical information was used to further explore the actual distribution of metabolic fluxes in the biochemical network of P. putida KT2440 as explained below.
FIGURE 3.
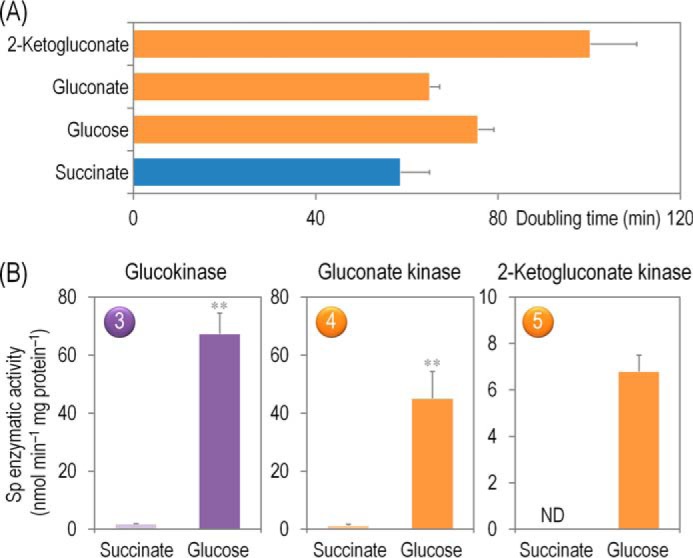
Growth parameters of P. putida KT2440 on different carbon sources and in vitro biochemical characterization of the three kinases involved in the phosphorylation of glucose, gluconate, and 2-ketogluconate. A, assessment of the characteristic doubling time of strain KT2440 growing on the three forms of hexoses differing in their degree of oxidation (glucose, gluconate, and 2-ketogluconate) and on succinate. Doubling time values were calculated during exponential growth. Bars represent the mean value of the doubling time ± S.D. of triplicate measurements from at least two independent experiments. B, in vitro evaluation of the specific (Sp) activity of glucokinase, gluconate kinase, and 2-ketogluconate kinase in cell-free extracts of P. putida KT2440 grown in M9 minimal medium containing 20 mm glucose during exponential growth. The circled numbers identify the enzymes in the biochemical network of Fig. 1. Bars represent the mean value of the corresponding enzymatic activity ± S.D. of duplicate measurements from at least three independent experiments, and ** indicated a significant difference (p < 0.01, Student's t test) in the level of enzymatic activity in glucose cultures as compared with that in succinate cultures. ND, not detected.
13C-based Metabolic Flux Ratio Analysis of the Central Carbon Metabolism in Glucose-grown P. putida KT2440
In addition to the possibility of glucose being converted into different oxidized intermediates (Fig. 3), the biochemical evidence shown in Fig. 2 indicates that there might be gluconeogenic activity of elements of the EMP pathway. To contemplate this possibility, and to resolve the relative contributions of reverse (i.e. gluconeogenic) flux from triose phosphates or through the PP pathway to the hexose phosphate pool, novel relative flux ratios were derived from [1-13C]- and [6-13C]glucose-labeling experiments. Given that the reaction catalyzed by Pfk is absent, and considering the irreversibility of Gnd and Edd, the calculation of relative ratios around the hexose node was possible (see “Experimental Procedures” for details, and also Table 2). The use of [6-13C]glucose allowed us to resolve fluxes from the PP and ED pathways back to hexose phosphates because the C6 position is maintained in both pathways and can lead to double-labeled hexose molecules. It was observed that more than 80% of the glucose influx was channeled through the periplasmic oxidation pathway via gluconate or 2-KG and only a minor fraction through Glc-6-P. About 25% of the Fru-6-P was formed through the PP pathway, whereas the remaining Fru-6-P was found to be recycled from trioses phosphates by means of the Fbp activity (assuming that there is no net glycolytic flux possible due to the absence of Pfk). The lack of an EMP-based glycolysis was in addition confirmed by the almost 50% relative flux contribution of the ED pathway to Pyr formation. The relative anaplerotic flux from Pyr to OAA as well as the relative flux through malic enzyme were in agreement with other published data (1, 8, 11).
Absolute Net Fluxes
The above-mentioned novel relative flux ratios in the initial glucose catabolism network allowed us to calculate absolute net fluxes incorporating quantitative physiology data and biomass formation as additional constraints (Fig. 4 and supplemental Table S4).
FIGURE 4.

In vivo carbon flux distribution in glucose-grown P. putida KT2440 obtained from ratio-constrained flux balance analysis. All fluxes were normalized to the specific glucose uptake rate (arbitrarily set to 100), and the thickness of each arrow is scaled to the relative flux percentage. Dashed lines indicate that no significant flux through the corresponding biochemical step was detected under the experimental conditions tested. The abbreviations used for the metabolic intermediates and the main metabolic blocks within the biochemical network are given in the legend to Fig. 1.
Only 10% of the glucose entering the network was phosphorylated to Glc-6-P by Glk, and 90% of the hexose was oxidized by glucose dehydrogenase, from which point on 12% was further converted into 2-KG (i.e. almost all the gluconate formed was directly phosphorylated into 6PG by GnuK). Note that the relative contribution of the direct phosphorylation of gluconate to 6PG and that of the indirect route though 2-KG cannot be resolved by 13C labeling data. To constrain this split for net flux analysis, we used the relative ratio of the in vitro enzyme activities of GnuK (i.e. direct phosphorylation) and KguD (i.e. 6PG from 2-KG). 6PG represents the converging point for all the parallel glucose-processing pathways. At this metabolic node, 91% of the intermediate was channeled into the ED pathway; these fluxes were among the highest obtained within the entire biochemical network. The remaining 6PG entered into the PP pathway (through Gnd). In general, the relative flux through the PP pathway was low (particularly in the non-oxidative branch). Approximately 14–17% of the total 6PG was generated from Glc-6-P through Zwf (Table 2). Net fluxes in the lower glycolysis and through the ED pathway confirmed previous results proposed for pseudomonads, where the ED pathway is the main pathway for glucose processing (3, 7, 8, 10, 52, 54, 55).
The distribution of metabolic fluxes allowed us to identify a functional cyclic operation of gluconeogenic flux from the triose phosphate pool back to Glc-6-P coupled with the fluxes through both the ED and the PP pathway in P. putida KT2440 grown on glucose. This metabolic architecture was termed the EDEMP cycle, as elements from the three main pathways for sugar processing act together to recycle triose phosphates back to hexose phosphates. Next, we asked whether recycling part of the triose phosphates from the ED pathway or from Fru-6-P via the PP pathway could impact NADPH formation, because both pathways contain potentially NADPH-forming dehydrogenases.
Cofactor Dependence of Key Dehydrogenases in the Central Carbon Metabolism of P. putida KT2440
The management of redox metabolism was investigated in strain KT2440 through the assessment of the activity of key dehydrogenases within the biochemical network. NADPH balances are typically derived from stoichiometric modeling for 13C-based metabolic flux analysis assuming that dehydrogenases have exclusive cofactor specificities. To clarify this scenario in P. putida KT2440, the in vitro enzyme activities were systematically determined for all the reactions that could provide or consume NADPH with both NAD+ and NADP+ as the cofactors (Fig. 5), and the cofactor specificities were calculated from these determinations (Table 3). To further refine our knowledge on the cofactor preference of these dehydrogenases, they were assayed not only under saturating conditions (Fig. 5A) but also using quasi in vivo conditions (Fig. 5B), in which the concentration of cofactors and substrates was derived from metabolite measurements of glucose-grown P. putida KT2440 cells.
FIGURE 5.
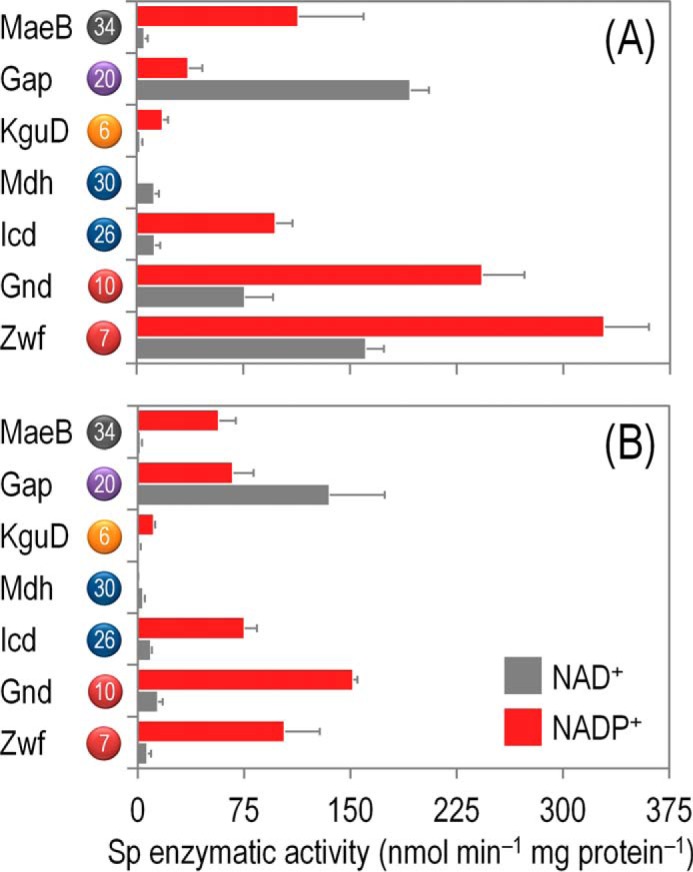
In vitro biochemical characterization of the main dehydrogenases in the core biochemical network of P. putida KT2440 under both saturating and non-saturating, quasi in vivo conditions. Specific (Sp) enzymatic activities of glucose-6-P 1-dehydrogenase (Zwf), 6-phosphogluconate dehydrogenase (Gnd), isocitrate dehydrogenase (Icd), malate dehydrogenase (Mdh), 2-ketogluconate-6-P reductase (KguD), glyceraldehyde-3-P dehydrogenase (Gap), and malic enzyme (MaeB) in cell-free extracts from P. putida KT2440 cells grown on M9 minimal medium added with 20 mm glucose during exponential growth. Assays were conducted with either saturating concentrations of substrates and cofactors (A) or in vivo-like, experimentally determined concentrations of substrates and cofactors (B). All dehydrogenases were assayed in the presence of NAD(+/H) or NADP(+/H) to assess the cofactor specificity of the corresponding enzymes (see also Table 2). Each bar represents the mean value of the corresponding enzymatic activity ± S.D. of triplicate measurements from at least two independent experiments. The circled numbers identify the enzymes in the biochemical network of Fig. 1.
TABLE 3.
In vitro determination of the cofactor specificity for the main dehydrogenases in the central metabolism of P. putida KT2440
The values shown in this table represent the mean of the relative cofactor specificity ± S.D. of triplicate measurements from at least two independent experiments (each one conducted in the presence of either NAD(+/H) or NADP(+/H), see also Fig. 5). All the enzymatic activities from which the cofactor specificities were derived were assayed in cell-free extracts obtained from exponentially growing cells cultured on M9 minimal medium containing 20 mm glucose. In the case of activities represented by more than one enzyme, the cofactor specificity of the total activity is given.
| Enzyme | Enzyme/isozymes in P. putida KT2440 | Relative cofactor specificity (%) under |
|||
|---|---|---|---|---|---|
| Saturating conditions |
Non-saturating, quasi in vivo conditions |
||||
| NAD+ | NADP+ | NAD+ | NADP+ | ||
| Glucose-6-P 1-dehydrogenase | Zwf-1 (PP1022) | 32.9 ± 8.7 | 67.1 ± 10.8 | 6.2 ± 0.1 | 93.8 ± 0.7 |
| Zwf-2 (PP4042) | |||||
| Zwf-3 (PP5351) | |||||
| 6-Phosphogluconate dehydrogenase | Gnd (PP4043) | 23.9 ± 2.5 | 76.1 ± 14.5 | 8.6 ± 0.5 | 91.4 ± 1.9 |
| Isocitrate dehydrogenase | Icd (PP4011) PP4012 | 11.5 ± 1.9 | 88.5 ± 6.6 | 11.1 ± 0.9 | 88.9 ± 2.3 |
| Malate dehydrogenase | Mdh (PP0654) PP5391 | 98.4 ± 0.7 | 1.6 ± 0.7 | 97.5 ± 8.4 | 2.5 ± 1.2 |
| 2-Ketogluconate-6-P reductase | KguD (PP3376) | 13.3 ± 0.9 | 86.7 ± 3.7 | 10.2 ± 0.9 | 89.8 ± 2.7 |
| Glyceraldehyde-3-P dehydrogenase | Gap-1 (PP1009) Gap-2 (PP2149) PP0665 | 84.1 ± 8.8 | 15.9 ± 2.9 | 66.8 ± 1.4 | 33.2 ± 0.3 |
| PP3443 | |||||
| Malic enzyme | MaeB (PP5085) | 4.6 ± 1.5 | 95.4 ± 2.8 | 3.5 ± 0.2 | 96.5 ± 4.2 |
Under saturating conditions (Fig. 5A), Glc-6-P and 6PG dehydrogenases had the highest activity among the dehydrogenases studied, and they exhibited significant activity with both NAD+ and NADP+, with a clear preference for the latter cofactor. However, these two activities were the most promiscuous enzymes assayed in terms of cofactor dependence. Isocitrate dehydrogenase and the malic enzyme had a >80% specificity for NADP+ over NAD+. Malate dehydrogenase and Glc-3-P dehydrogenase showed the opposite trend, with a 98 and 84% specificity for NAD+ as the cofactor, respectively. Note that the malic enzyme is not required for the growth of P. putida KT2440 on glucose and that a very high activity of this enzyme (concomitant with a low activity of malate dehydrogenase) is characteristic of the so-called Pyr shunt (11). The only enzyme within the biochemical network that consumes reducing equivalents, KguD (Fig. 1), showed an ∼90% specificity for NADPH.
The landscape of cofactor specificities was different when the enzymes were assayed under quasi in vivo conditions (Fig. 5B and Table 3). Both Glc-6-P dehydrogenase and 6PG dehydrogenase had a higher preference for NADP+ (>90%) than the one displayed under saturating conditions. These two dehydrogenases also had the highest specific activities among the enzymes evaluated. The cofactor preference of Icd, Mdh, MaeB, and KguD, in contrast, did not display a significant difference between the two types of biochemical assays explored. Finally, under quasi in vivo assay conditions, the cofactor preference of Glc-3-P dehydrogenase followed the opposite trend as the one observed under saturating conditions and the specificity for NADP+ as the cofactor increased from 15.9 to 33.2%. With this information at hand, we combined the in vivo distribution of metabolic fluxes with the experimentally obtained cofactor specificity of the main dehydrogenases to obtain the overall redox balances in P. putida KT2440.
NADPH Balance in Glucose-grown P. putida KT2440
By combining the previously calculated absolute fluxes through all NADP(+/H)-specific dehydrogenases with the respective cofactor specificities (both under saturating and in vivo-like conditions), we calculated the overall NADPH production rate during growth on glucose (Fig. 6). In all cases, the NADPH consumption rate was dominated by the demand for biomass production and to a minor extent by the flux through the NADPH-dependent 2K6PG reductase (i.e. KguD) reaction (Fig. 6, A and C).
FIGURE 6.

NADPH balance in glucose-grown P. putida KT2440 and mutant strains. Overall NADPH balance for the wild-type strain using the cofactor specificities of the main dehydrogenases was assessed under saturating conditions (A) or quasi in vivo conditions (C). NADPH formation was determined from the carbon fluxes through the cofactor-dependent reactions (Fig. 6 and supplemental Table S4) multiplied by the experimentally determined relative cofactor specificities for NAD(P)+ (Table 3). NADPH consumption was calculated from the NADPH requirements for biomass production and the activity of KguD. The rates of total NADPH formation (green) and total NADPH consumption (red) are separately given. Dependence of the overall NADPH ratio on the GnuK/KguD flux ratio and the relative preference of Zwf for NADP+ or NAD+ as the cofactor using the cofactor specificities of the main dehydrogenases were assessed under saturating conditions (B) or quasi in vivo conditions (D). Selected values for the NADPH balance are given for the experimentally determined NADP+ specificity of Zwf.
In terms of the overall NADPH balance, during exponential growth of wild-type strain KT2440 on glucose, the formation and consumption of NADPH were balanced when using the experimental cofactor dependence of the dehydrogenases obtained under saturating conditions (Fig. 6A). However, a catabolic overproduction of NADPH at a net rate of 1.5 ± 0.2 mmol gCDW−1 h−1 was calculated when using the quasi in vivo cofactor specificities of the dehydrogenases (Fig. 6C). Under these conditions, the experimentally determined NADPH/NADP+ ratio was 1.18 ± 0.16 mol mol−1.
We also explored the sensitivity of the overall NADPH formation rate with respect to the two main parameters we identified as affecting it. On the one hand, the GnuK/KguD ratio (i.e. the two possible origins of 6PG, which we constrained in our metabolic flux analysis by means of the in vitro activity of the corresponding kinases) determines NADPH consumption besides anabolic demands. On the other hand, because Zwf had the highest flux among all the dehydrogenases tested (Fig. 5), this dehydrogenase is considered the main source of NADPH. Fig. 6, B and D, indicates the corresponding plots showing how NADPH formation is affected by these two parameters when using the cofactor specificities under saturating conditions or in vivo-like conditions, respectively. When using the latter data, the overall NADPH balance resulted more positively over the entire range of values of possible GnuK/KguD ratios, becoming neutral at GnuK/KguD = 0.6. With the cofactor specificities obtained under saturating conditions, the net NADPH formation rate becomes zero at GnuK/KguD = 0.9. Taken together, the results above indicate that the operativity of the entire biochemical network of P. putida KT2440 is characterized by a slight catabolic overproduction of NADPH.
Discussion
Taken together, the results presented in this study expose a connection between the layout of central metabolic pathways and the way of living of environmental microorganisms. Although the EMP pathway used by many organisms is considered to be the predominant textbook route for metabolism of glucose (16, 56), in reality the ED counterpart is the most frequent biochemical device found in free-living bacteria and archaea. Also, the ED pathway was recently shown to operate not only on glucose as the substrate but also on sulfoquinovose (6-deoxy-6-sulfoglucose), thereby mediating an entirely new way to process hexoses through the so-called sulfoglycolysis (57). Notably, the prokaryotic world includes strains with either EMP or ED pathways, as well as with both of them co-existing in the same host (55, 58–64). The advantage of using the ED pathway may rely on the production of central C3 metabolites (Pyr and Glc-3-P) with a reduced complement of enzymes (65), the synthesis of which is comparatively less costly than the equivalent biochemical elements of the EMP pathway (66, 67). The ED pathway is considered to operate in a linear, forward fashion, and it has been assumed to happen as such in metabolic models of P. putida KT2440 (17–19). However, the fact that the ED route co-exists with a partial EMP pathway in this bacterium and that a tpiA mutant cannot grow on glucose or succinate suggested an atypical metabolic scenario that was thoroughly examined in this study.
Specifically, the data shown above clarifies how the flow of carbon splits between the two different biochemical branches present in most pseudomonads (i.e. phosphorylative and oxidative), from which the intermediates enter the central carbon metabolism. But the key conclusion of this investigation was that the upper part of the central catabolism of P. putida KT2440 involves a recycling of metabolites through what we propose to call the EDEMP cycle (i.e. a cycle recruiting elements from the ED, EMP, and PP pathways; Fig. 7). This metabolic module forces part of the triose phosphates (that would otherwise be further oxidized in the lower catabolism, i.e. downward acetyl-CoA) to be recycled back to hexose phosphates. This rotation takes place through the stepwise biochemical sequence Glc-3-P → DHAP → FBP → Fru-6-P → Glc-6-P that involves the gluconeogenic activities of TpiA, Fda, Fbp, and Pgi. Moreover, the data indicate that the EDEMP cycle operates under both glycolytic and gluconeogenic regimes, and therefore, it is an essential distributor of carbon through the central metabolic metabolism. It is remarkable that such metabolic traits have emerged not through the acquisition of different genes but by expanding the connectivity of metabolic elements already in place. These data uncover correlations between a given metabolic architecture and environmental lifestyles, which is by no means evident through the mere perusal of the complement of metabolic genes of the corresponding genomes.
FIGURE 7.
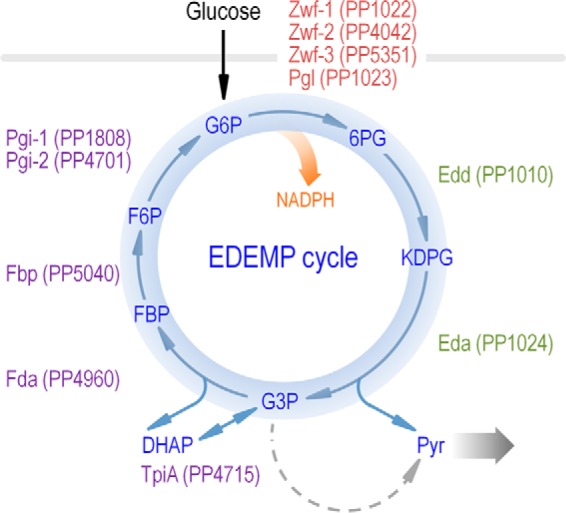
EDEMP cycle of P. putida KT2440. The architecture of central carbon metabolism is shown along the key elements belonging to the Entner-Doudoroff pathway (in green), the Embden-Meyerhof-Parnas pathway (in purple, operating in the gluconeogenic direction), and the pentose phosphate pathway (in red). Reactions downward to pyruvate are indicated with a wide shaded arrow. G6P, Glc-6-P; F6P, Fru-6-P.
The existence of the hereby proposed EDEMP cycle explains in retrospect the poor growth of P. putida KT2440 when a heterologous Pfk enzyme (PfkAE. coli) was expressed (5). PfkAE. coli catalyzes a reaction that opposes the innate carbon flow through the EDEMP cycle. This artificial arrangement results in a futile cycle in the central carbon metabolism that wastes the ATP needed for other biological functions. Such scenario might be distinctive not only for P. putida KT2440 but it was also observed in Zymomonas mobilis (68), the only bacterium know to use the ED pathway anaerobically. In contrast, expression of PfkAE. coli in Cupriavidus necator (which also operates an ED route) does result in a functional EMP pathway of sorts (69). What is then the value of having such a metabolic cycle for the lifestyle of P. putida? We entertain at least two advantages. First, the EDEMP cycle not only stimulates biosynthesis of DHAP, FBP, and Glc-6-P for biomass production, but it would also ensure a supply of Fru-6-P under very different metabolic conditions (13). Fru-6-P is a precursor of extracellular polysaccharides (e.g. alginate; see Ref. 70), which increases tolerance to desiccation and other adverse environmental circumstances (71). Second, because a considerable number of anti-oxidant enzymes are coupled to NADPH as a redox cofactor (72, 73), it is plausible that the architecture of the EDEMP cycle helps protect P. putida from endogenous or exogenous oxidative stress due to the enhanced supply of reducing equivalents that would take place under cyclic glycolytic conditions. It is therefore conceivable that the EDEMP cycle described in this work also facilitates to curb different types of environmental hardships that P. putida recurrently faces in its habitual environmental niches (1, 20, 74). Work is currently in progress to clarify the hypothesized connections between central metabolic activities and physicochemical endurance of this remarkable bacterial species.
Author Contributions
P. I. N., M. C., and T. F. conducted the experiments, analyzed the data, and drafted the manuscript. P. I. N. and M. C. performed the quantitative physiology and labeling experiments, and P. I. N. carried out the in vitro determinations of enzyme activities. T. F. conducted the LC-MS/MS and GC-MS measurements, analyzed the data in silico, and obtained the distribution of metabolic fluxes and redox balances. P. I. N., M. C., T. F., U. S., and V. D. L. discussed the experimental evidence and drafted the conclusions. U. S. and V. D. L. conceived the project and wrote the manuscript. All authors reviewed the results and approved the final version of the manuscript.
Supplementary Material
Acknowledgments
We thank Harald Ruijssenaars, Lars M. Blank, and Esteban Martínez-García for helpful discussions and critical reading of our manuscript
This work was supported in part by the CAMBIOS Project of the Spanish Ministry of Economy and Competitiveness, the ST-FLOW, EVOPROG, ARISYS, and EmpowerPutida Contracts of the European Union, the PROMT Project of the Autonomous Community of Madrid (to V. D. L.), and Marie Skłodowska-Curie Actions Program Grant from the European Union ALLEGRO, UE-FP7-PEOPLE-2011-IIF-300508 (to P. I. N.). The authors declare that they have no conflicts of interest with the contents of this article.

This article contains supplemental Tables 1–4.
- ED pathway
- Entner-Doudoroff pathway
- EMP pathway
- Embden-Meyerhof-Parnas pathway
- PP pathway
- pentose phosphate pathway
- Fru-6-P
- fructose-6-P
- FBP
- fructose-1,6-P2
- Glc-6-P
- glucose-6-P
- 6PG
- 6-phosphogluconate
- 2-KG
- 2-ketogluconate
- 2K6PG
- 2-keto-6-phosphogluconate
- KDPG
- 2-keto-3-deoxy-6-phosphogluconate
- Pyr
- pyruvate
- Glc-3-P
- glyceraldehyde-3-P
- DHAP
- dihydroxyacetone-P
- OAA
- oxaloacetate
- Fbp
- fructose-1,6-bisphosphatase
- Edd
- 6PG dehydratase
- Zwf
- Glc-6-P 1-dehydrogenase
- GnuK
- gluconokinase
- Glk
- glucokinase
- KguK
- 2-KG kinase
- Fda
- FBP aldolase
- TpiA
- triose-phosphate isomerase
- CDW
- cell dry weight
- Pfk
- 6-phosphofructo-1-kinase.
References
- 1.Nikel P. I., Martínez-García E., and de Lorenzo V. (2014) Biotechnological domestication of pseudomonads using synthetic biology. Nat. Rev. Microbiol. 12, 368–379 [DOI] [PubMed] [Google Scholar]
- 2.Lessie T. G., and Phibbs P. V. Jr. (1984) Alternative pathways of carbohydrate utilization in pseudomonads. Annu. Rev. Microbiol. 38, 359–388 [DOI] [PubMed] [Google Scholar]
- 3.Sudarsan S., Dethlefsen S., Blank L. M., Siemann-Herzberg M., and Schmid A. (2014) The functional structure of central carbon metabolism in Pseudomonas putida KT2440. Appl. Environ. Microbiol. 80, 5292–5303 [DOI] [PMC free article] [PubMed] [Google Scholar]
- 4.Chubukov V., Gerosa L., Kochanowski K., and Sauer U. (2014) Coordination of microbial metabolism. Nat. Rev. Microbiol. 12, 327–340 [DOI] [PubMed] [Google Scholar]
- 5.Chavarría M., Nikel P. I., Pérez-Pantoja D., and de Lorenzo V. (2013) The Entner-Doudoroff pathway empowers Pseudomonas putida KT2440 with a high tolerance to oxidative stress. Environ. Microbiol. 15, 1772–1785 [DOI] [PubMed] [Google Scholar]
- 6.Latrach Tlemçani L., Corroler D., Barillier D., and Mosrati R. (2008) Physiological states and energetic adaptation during growth of Pseudomonas putida mt-2 on glucose. Arch. Microbiol. 190, 141–150 [DOI] [PubMed] [Google Scholar]
- 7.Blank L. M., Ionidis G., Ebert B. E., Bühler B., and Schmid A. (2008) Metabolic response of Pseudomonas putida during redox biocatalysis in the presence of a second octanol phase. FEBS J. 275, 5173–5190 [DOI] [PubMed] [Google Scholar]
- 8.del Castillo T., Ramos J. L., Rodríguez-Herva J. J., Fuhrer T., Sauer U., and Duque E. (2007) Convergent peripheral pathways catalyze initial glucose catabolism in Pseudomonas putida: genomic and flux analysis. J. Bacteriol. 189, 5142–5152 [DOI] [PMC free article] [PubMed] [Google Scholar]
- 9.Vicente M., and Cánovas J. L. (1973) Regulation of the glucolytic enzymes in Pseudomonas putida. Arch. Mikrobiol. 93, 53–64 [DOI] [PubMed] [Google Scholar]
- 10.Vicente M., and Cánovas J. L. (1973) Glucolysis in Pseudomonas putida: physiological role of alternative routes from the analysis of defective mutants. J. Bacteriol. 116, 908–914 [DOI] [PMC free article] [PubMed] [Google Scholar]
- 11.Chavarría M., Kleijn R. J., Sauer U., Pflüger-Grau K., and de Lorenzo V. (2012) Regulatory tasks of the phosphoenolpyruvate-phosphotransferase system of Pseudomonas putida in central carbon metabolism. MBio. 3, e00028. [DOI] [PMC free article] [PubMed] [Google Scholar]
- 12.del Castillo T., Duque E., and Ramos J. L. (2008) A set of activators and repressors control peripheral glucose pathways in Pseudomonas putida to yield a common central intermediate. J. Bacteriol. 190, 2331–2339 [DOI] [PMC free article] [PubMed] [Google Scholar]
- 13.Conway T. (1992) The Entner-Doudoroff pathway: history, physiology and molecular biology. FEMS Microbiol. Rev. 9, 1–27 [DOI] [PubMed] [Google Scholar]
- 14.Entner N., and Doudoroff M. (1952) Glucose and gluconic acid oxidation of Pseudomonas saccharophila. J. Biol. Chem. 196, 853–862 [PubMed] [Google Scholar]
- 15.Peekhaus N., and Conway T. (1998) What's for dinner?: Entner-Doudoroff metabolism in Escherichia coli. J. Bacteriol. 180, 3495–3502 [DOI] [PMC free article] [PubMed] [Google Scholar]
- 16.Romano A. H., and Conway T. (1996) Evolution of carbohydrate metabolic pathways. Res. Microbiol. 147, 448–455 [DOI] [PubMed] [Google Scholar]
- 17.Nogales J., Palsson B. Ø., and Thiele I. (2008) A genome-scale metabolic reconstruction of Pseudomonas putida KT2440: iJN746 as a cell factory. BMC Syst. Biol. 2, 79. [DOI] [PMC free article] [PubMed] [Google Scholar]
- 18.Puchałka J., Oberhardt M. A., Godinho M., Bielecka A., Regenhardt D., Timmis K. N., Papin J. A., and Martins dos Santos V. A. (2008) Genome-scale reconstruction and analysis of the Pseudomonas putida KT2440 metabolic network facilitates applications in biotechnology. PLoS Comput. Biol. 4, e1000210. [DOI] [PMC free article] [PubMed] [Google Scholar]
- 19.Sohn S. B., Kim T. Y., Park J. M., and Lee S. Y. (2010) In silico genome-scale metabolic analysis of Pseudomonas putida KT2440 for polyhydroxyalkanoate synthesis, degradation of aromatics and anaerobic survival. Biotechnol. J. 5, 739–750 [DOI] [PubMed] [Google Scholar]
- 20.Martins dos Santos V. A., Heim S., Moore E. R., Strätz M., and Timmis K. N. (2004) Insights into the genomic basis of niche specificity of Pseudomonas putida KT2440. Environ. Microbiol. 6, 1264–1286 [DOI] [PubMed] [Google Scholar]
- 21.Nikel P. I., Silva-Rocha R., Benedetti I., and de Lorenzo V. (2014) The private life of environmental bacteria: pollutant biodegradation at the single cell level. Environ. Microbiol. 16, 628–642 [DOI] [PubMed] [Google Scholar]
- 22.Bagdasarian M., Lurz R., Rückert B., Franklin F. C., Bagdasarian M. M., Frey J., and Timmis K. N. (1981) Specific purpose plasmid cloning vectors. II. Broad host range, high copy number, RSF1010-derived vectors, and a host-vector system for gene cloning in Pseudomonas. Gene 16, 237–247 [DOI] [PubMed] [Google Scholar]
- 23.Nikel P. I., and de Lorenzo V. (2013) Engineering an anaerobic metabolic regime in Pseudomonas putida KT2440 for the anoxic biodegradation of 1,3-dichloroprop-1-ene. Metab. Eng. 15, 98–112 [DOI] [PubMed] [Google Scholar]
- 24.Duque E., Molina-Henares A. J., de la Torre J., Molina-Henares M. A., del Castillo T., Lam J., and Ramos J. L. (2007) in Pseudomonas: A Model System in Biology (Ramos J. L., and Filloux A., eds) pp. 227–251, Springer, Kluwer, London, UK [Google Scholar]
- 25.Green M. R., and Sambrook J. (2012) Molecular Cloning: A Laboratory Manual, 4th Ed., Cold Spring Harbor Laboratory Press, Cold Spring Harbor, NY [Google Scholar]
- 26.Nikel P. I., Kim J., and de Lorenzo V. (2014) Metabolic and regulatory rearrangements underlying glycerol metabolism in Pseudomonas putida KT2440. Environ. Microbiol. 16, 239–254 [DOI] [PubMed] [Google Scholar]
- 27.Buescher J. M., Moco S., Sauer U., and Zamboni N. (2010) Ultrahigh performance liquid chromatography-tandem mass spectrometry method for fast and robust quantification of anionic and aromatic metabolites. Anal. Chem. 82, 4403–4412 [DOI] [PubMed] [Google Scholar]
- 28.Rühl M., Rupp B., Nöh K., Wiechert W., Sauer U., and Zamboni N. (2012) Collisional fragmentation of central carbon metabolites in LC-MS/MS increases precision of 13C metabolic flux analysis. Biotechnol. Bioeng. 109, 763–771 [DOI] [PubMed] [Google Scholar]
- 29.Fischer E., and Sauer U. (2003) Metabolic flux profiling of Escherichia coli mutants in central carbon metabolism using GC-MS. Eur. J. Biochem. 270, 880–891 [DOI] [PubMed] [Google Scholar]
- 30.Nanchen A., Fuhrer T., and Sauer U. (2007) Determination of metabolic flux ratios from 13C-experiments and gas chromatography-mass spectrometry data: protocol and principles. Methods Mol. Biol. 358, 177–197 [DOI] [PubMed] [Google Scholar]
- 31.Zamboni N., Fischer E., and Sauer U. (2005) FiatFlux–A software for metabolic flux analysis from 13C-glucose experiments. BMC Bioinformatics 6, 209. [DOI] [PMC free article] [PubMed] [Google Scholar]
- 32.Fischer E., Zamboni N., and Sauer U. (2004) High-throughput metabolic flux analysis based on gas chromatography-mass spectrometry derived 13C constraints. Anal. Biochem. 325, 308–316 [DOI] [PubMed] [Google Scholar]
- 33.Nikel P. I., Romero-Campero F. J., Zeidman J. A., Goñi-Moreno Á., and de Lorenzo V. (2015) The glycerol-dependent metabolic persistence of Pseudomonas putida KT2440 reflects the regulatory logic of the GlpR repressor. MBio. 6, e00340–00315 [DOI] [PMC free article] [PubMed] [Google Scholar]
- 34.Nikel P. I., Zhu J., San K. Y., Méndez B. S., and Bennett G. N. (2009) Metabolic flux analysis of Escherichia coli creB and arcA mutants reveals shared control of carbon catabolism under microaerobic growth conditions. J. Bacteriol. 191, 5538–5548 [DOI] [PMC free article] [PubMed] [Google Scholar]
- 35.Nikel P. I., Chavarría M., Martínez-García E., Taylor A. C., and de Lorenzo V. (2013) Accumulation of inorganic polyphosphate enables stress endurance and catalytic vigour in Pseudomonas putida KT2440. Microb. Cell Fact. 12, 50. [DOI] [PMC free article] [PubMed] [Google Scholar]
- 36.Bradford M. M. (1976) A rapid and sensitive method for the quantitation of microgram quantities of protein utilizing the principle of protein-dye binding. Anal. Biochem. 72, 248–254 [DOI] [PubMed] [Google Scholar]
- 37.Banerjee P. C., Darzins A., and Maitra P. K. (1987) Gluconeogenic mutations in Pseudomonas aeruginosa: genetic linkage between fructose-bisphosphate aldolase and phosphoglycerate kinase. J. Gen. Microbiol. 133, 1099–1107 [DOI] [PubMed] [Google Scholar]
- 38.Baumann P., and Baumann L. (1975) Catabolism of d-fructose and d-ribose by Pseudomonas doudoroffi. I. Physiological studies and mutant analysis. Arch. Microbiol. 105, 225–240 [DOI] [PubMed] [Google Scholar]
- 39.Fuhrer T., and Sauer U. (2009) Different biochemical mechanisms ensure network-wide balancing of reducing equivalents in microbial metabolism. J. Bacteriol. 191, 2112–2121 [DOI] [PMC free article] [PubMed] [Google Scholar]
- 40.Heath H. E., and Gaudy E. T. (1978) Relationship between catabolism of glycerol and metabolism of hexosephosphate derivatives by Pseudomonas aeruginosa. J. Bacteriol. 136, 638–646 [DOI] [PMC free article] [PubMed] [Google Scholar]
- 41.Klinke S., Dauner M., Scott G., Kessler B., and Witholt B. (2000) Inactivation of isocitrate lyase leads to increased production of medium-chain-length poly(3-hydroxyalkanoates) in Pseudomonas putida. Appl. Environ. Microbiol. 66, 909–913 [DOI] [PMC free article] [PubMed] [Google Scholar]
- 42.van der Werf M. J., Overkamp K. M., Muilwijk B., Koek M. M., van der Werff-van der Vat B. J., Jellema R. H., Coulier L., and Hankemeier T. (2008) Comprehensive analysis of the metabolome of Pseudomonas putida S12 grown on different carbon sources. Mol. BioSyst. 4, 315–327 [DOI] [PubMed] [Google Scholar]
- 43.Bidart G. N., Ruiz J. A., de Almeida A., Méndez B. S., and Nikel P. I. (2012) Manipulation of the anoxic metabolism in Escherichia coli by ArcB deletion variants in the ArcBA two-component system. Appl. Environ. Microbiol. 78, 8784–8794 [DOI] [PMC free article] [PubMed] [Google Scholar]
- 44.Nikel P. I., Giordano A. M., de Almeida A., Godoy M. S., and Pettinari M. J. (2010) Elimination of d-lactate synthesis increases poly(3-hydroxybutyrate) and ethanol synthesis from glycerol and affects cofactor distribution in recombinant Escherichia coli. Appl. Environ. Microbiol. 76, 7400–7406 [DOI] [PMC free article] [PubMed] [Google Scholar]
- 45.Nikel P. I., and Chavarría M. (2015) in Hydrocarbon and Lipid Microbiology Protocols (McGenity T. J., ed), Humana Press, New York, in press [Google Scholar]
- 46.Molina-Henares M. A., de la Torre J., García-Salamanca A., Molina-Henares A. J., Herrera M. C., Ramos J. L., and Duque E. (2010) Identification of conditionally essential genes for growth of Pseudomonas putida KT2440 on minimal medium through the screening of a genome-wide mutant library. Environ. Microbiol. 12, 1468–1485 [DOI] [PubMed] [Google Scholar]
- 47.Maleki S., Mærk M., Valla S., and Ertesvåg H. (2015) Mutational analyses of glucose dehydrogenase and glucose-6-phosphate dehydrogenase genes in Pseudomonas fluorescens reveal their effects on growth and alginate production. Appl. Environ. Microbiol. 81, 3349–3356 [DOI] [PMC free article] [PubMed] [Google Scholar]
- 48.Banerjee P. C. (1989) Fructose-bisphosphatase-deficient mutants of mucoid Pseudomonas aeruginosa. Folia Microbiol. 34, 81–86 [DOI] [PubMed] [Google Scholar]
- 49.Baba T., Ara T., Hasegawa M., Takai Y., Okumura Y., Baba M., Datsenko K. A., Tomita M., Wanner B. L., and Mori H. (2006) Construction of Escherichia coli K-12 in-frame, single-gene knockout mutants: the Keio collection. Mol. Syst. Biol. 2, 2006.0008. [DOI] [PMC free article] [PubMed] [Google Scholar]
- 50.Anderson A., and Cooper R. A. (1969) Gluconeogenesis in Escherichia coli: The role of triose-phosphate isomerase. FEBS Lett. 4, 19–20 [DOI] [PubMed] [Google Scholar]
- 51.Behrends V., Bell T. J., Liebeke M., Cordes-Blauert A., Ashraf S. N., Nair C., Zlosnik J. E., Williams H. D., and Bundy J. G. (2013) Metabolite profiling to characterize disease-related bacteria: gluconate excretion by Pseudomonas aeruginosa mutants and clinical isolates from cystic fibrosis patients. J. Biol. Chem. 288, 15098–15109 [DOI] [PMC free article] [PubMed] [Google Scholar]
- 52.Fuhrer T., Fischer E., and Sauer U. (2005) Experimental identification and quantification of glucose metabolism in seven bacterial species. J. Bacteriol. 187, 1581–1590 [DOI] [PMC free article] [PubMed] [Google Scholar]
- 53.Schleissner C., Reglero A., and Luengo J. M. (1997) Catabolism of d-glucose by Pseudomonas putida U occurs via extracellular transformation into d-gluconic acid and induction of a specific gluconate transport system. Microbiology 143, 1595–1603 [DOI] [PubMed] [Google Scholar]
- 54.Ebert B. E., Kurth F., Grund M., Blank L. M., and Schmid A. (2011) Response of Pseudomonas putida KT2440 to increased NADH and ATP demand. Appl. Environ. Microbiol. 77, 6597–6605 [DOI] [PMC free article] [PubMed] [Google Scholar]
- 55.Berger A., Dohnt K., Tielen P., Jahn D., Becker J., and Wittmann C. (2014) Robustness and plasticity of metabolic pathway flux among uropathogenic isolates of Pseudomonas aeruginosa. PLoS ONE 9, e88368. [DOI] [PMC free article] [PubMed] [Google Scholar]
- 56.Bar-Even A., Flamholz A., Noor E., and Milo R. (2012) Rethinking glycolysis: on the biochemical logic of metabolic pathways. Nat. Chem. Biol. 8, 509–517 [DOI] [PubMed] [Google Scholar]
- 57.Felux A. K., Spiteller D., Klebensberger J., and Schleheck D. (2015) Entner-Doudoroff pathway for sulfoquinovose degradation in Pseudomonas putida SQ1. Proc. Natl. Acad. Sci. U.S.A. 112, E4298–E4305 [DOI] [PMC free article] [PubMed] [Google Scholar]
- 58.Ahmed H., Tjaden B., Hensel R., and Siebers B. (2004) Embden-Meyerhof-Parnas and Entner-Doudoroff pathways in Thermoproteus tenax: metabolic parallelism or specific adaptation? Biochem. Soc. Trans. 32, 303–304 [DOI] [PubMed] [Google Scholar]
- 59.Hanke T., Nöh K., Noack S., Polen T., Bringer S., Sahm H., Wiechert W., and Bott M. (2013) Combined fluxomics and transcriptomics analysis of glucose catabolism via a partially cyclic pentose phosphate pathway in Gluconobacter oxydans 621H. Appl. Environ. Microbiol. 79, 2336–2348 [DOI] [PMC free article] [PubMed] [Google Scholar]
- 60.Klingner A., Bartsch A., Dogs M., Wagner-Döbler I., Jahn D., Simon M., Brinkhoff T., Becker J., and Wittmann C. (2015) Large-scale 13C-flux profiling reveals conservation of the Entner-Doudoroff pathway as glycolytic strategy among glucose-using marine bacteria. Appl. Environ. Microbiol. 81, 2408–2422 [DOI] [PMC free article] [PubMed] [Google Scholar]
- 61.Patra T., Koley H., Ramamurthy T., Ghose A. C., and Nandy R. K. (2012) The Entner-Doudoroff pathway is obligatory for gluconate utilization and contributes to the pathogenicity of Vibrio cholerae. J. Bacteriol. 194, 3377–3385 [DOI] [PMC free article] [PubMed] [Google Scholar]
- 62.Reher M., Fuhrer T., Bott M., and Schönheit P. (2010) The nonphosphorylative Entner-Doudoroff pathway in the thermoacidophilic euryarchaeon Picrophilus torridus involves a novel 2-keto-3-deoxygluconate-specific aldolase. J. Bacteriol. 192, 964–974 [DOI] [PMC free article] [PubMed] [Google Scholar]
- 63.Schatschneider S., Huber C., Neuweger H., Watt T. F., Pühler A., Eisenreich W., Wittmann C., Niehaus K., and Vorhölter F. J. (2014) Metabolic flux pattern of glucose utilization by Xanthomonas campestris pv. campestris: prevalent role of the Entner-Doudoroff pathway and minor fluxes through the pentose phosphate pathway and glycolysis. Mol. Biosyst. 10, 2663–2676 [DOI] [PubMed] [Google Scholar]
- 64.Waligora E. A., Fisher C. R., Hanovice N. J., Rodou A., Wyckoff E. E., and Payne S. M. (2014) Role of intracellular carbon metabolism pathways in Shigella flexneri virulence. Infect. Immun. 82, 2746–2755 [DOI] [PMC free article] [PubMed] [Google Scholar]
- 65.Noor E., Eden E., Milo R., and Alon U. (2010) Central carbon metabolism as a minimal biochemical walk between precursors for biomass and energy. Mol. Cell 39, 809–820 [DOI] [PubMed] [Google Scholar]
- 66.Flamholz A., Noor E., Bar-Even A., Liebermeister W., and Milo R. (2013) Glycolytic strategy as a tradeoff between energy yield and protein cost. Proc. Natl. Acad. Sci. U.S.A. 110, 10039–10044 [DOI] [PMC free article] [PubMed] [Google Scholar]
- 67.Stettner A. I., and Segrè D. (2013) The cost of efficiency in energy metabolism. Proc. Natl. Acad. Sci. U.S.A. 110, 9629–9630 [DOI] [PMC free article] [PubMed] [Google Scholar]
- 68.Chen R. R., Agrawal M., and Mao Z. (2013) Impact of expression of EMP enzymes on glucose metabolism in Zymomonas mobilis. Appl. Biochem. Biotechnol. 170, 805–818 [DOI] [PubMed] [Google Scholar]
- 69.Steinbüchel A. (1986) Expression of the Escherichia coli pfkA gene in Alcaligenes eutrophus and in other Gram-negative bacteria. J. Bacteriol. 166, 319–327 [DOI] [PMC free article] [PubMed] [Google Scholar]
- 70.Neidhardt F. C., Ingraham J. L., and Schaechter M. (1990) Physiology of the Bacterial Cell: A Molecular Approach, Sinauer Associates, Sunderland, MA [Google Scholar]
- 71.Nikel P. I., Pérez-Pantoja D., and de Lorenzo V. (2013) Why are chlorinated pollutants so difficult to degrade aerobically? Redox stress limits 1,3-dichloroprop-1-ene metabolism by Pseudomonas pavonaceae. Philos. Trans. R. Soc. Lond. B Biol. Sci. 368, 20120377. [DOI] [PMC free article] [PubMed] [Google Scholar]
- 72.Cabiscol E., Tamarit J., and Ros J. (2000) Oxidative stress in bacteria and protein damage by reactive oxygen species. Int. Microbiol. 3, 3–8 [PubMed] [Google Scholar]
- 73.Imlay J. A. (2003) Pathways of oxidative damage. Annu. Rev. Microbiol. 57, 395–418 [DOI] [PubMed] [Google Scholar]
- 74.Kim J., and Park W. (2014) Oxidative stress response in Pseudomonas putida. Appl. Microbiol. Biotechnol. 98, 6933–6946 [DOI] [PubMed] [Google Scholar]
- 75.Winsor G. L., Lam D. K., Fleming L., Lo R., Whiteside M. D., Yu N. Y., Hancock R. E., and Brinkman F. S. (2011) Pseudomonas Genome Database: improved comparative analysis and population genomics capability for Pseudomonas genomes. Nucleic Acids Res. 39, D596–D600 [DOI] [PMC free article] [PubMed] [Google Scholar]
- 76.Caspi R., Altman T., Dreher K., Fulcher C. A., Subhraveti P., Keseler I. M., Kothari A., Krummenacker M., Latendresse M., Mueller L. A., Ong Q., Paley S., Pujar A., Shearer A. G., Travers M., et al. (2012) The MetaCyc database of metabolic pathways and enzymes and the BioCyc collection of pathway/genome databases. Nucleic Acids Res. 40, D742–D753 [DOI] [PMC free article] [PubMed] [Google Scholar]
- 77.Nelson K. E., Weinel C., Paulsen I. T., Dodson R. J., Hilbert H., Martins dos Santos V. A., Fouts D. E., Gill S. R., Pop M., Holmes M., Brinkac L., Beanan M., DeBoy R. T., Daugherty S., Kolonay J., et al. (2002) Complete genome sequence and comparative analysis of the metabolically versatile Pseudomonas putida KT2440. Environ. Microbiol. 4, 799–808 [DOI] [PubMed] [Google Scholar]
Associated Data
This section collects any data citations, data availability statements, or supplementary materials included in this article.