Background: Fenugreek is an edible plant used to treat diabetes and other disorders.
Results: We isolated a new structure in fenugreek that enhances glucagon-like peptide-1 (GLP-1) potency.
Conclusion: The antidiabetic plant fenugreek is a rich source of GLP-1 activity-enhancing compounds.
Significance: GLP-1 peptide is a target for new drug screening and drug safety studies.
Keywords: bioluminescence resonance energy transfer (BRET), cyclic AMP (cAMP), diabetes, endocytosis, G protein-coupled receptor (GPCR), natural product, 4-hydroxyisoleucine, fenugreek, glucagon-like peptide-1
Abstract
The glucagon-like peptide-1 receptor (GLP-1R) is expressed in many tissues and has been implicated in diverse physiological functions, such as energy homeostasis and cognition. GLP-1 analogs are approved for treatment of type 2 diabetes and are undergoing clinical trials for other disorders, including neurodegenerative diseases. GLP-1 analog therapies maintain chronically high plasma levels of the analog and can lead to loss of spatiotemporal control of GLP-1R activation. To avoid adverse effects associated with current therapies, we characterized positive modulators of GLP-1R signaling. We screened extracts from edible plants using an intracellular cAMP biosensor and GLP-1R endocytosis assays. Ethanol extracts from fenugreek seeds enhanced GLP-1 signaling. These seeds have previously been found to reduce glucose and glycated hemoglobin levels in humans. An active compound (N55) with a new N-linoleoyl-2-amino-γ-butyrolactone structure was purified from fenugreek seeds. N55 promoted GLP-1-dependent cAMP production and GLP-1R endocytosis in a dose-dependent and saturable manner. N55 specifically enhanced GLP-1 potency more than 40-fold, but not that of exendin 4, to stimulate cAMP production. In contrast to the current allosteric modulators that bind to GLP-1R, N55 binds to GLP-1 peptide and facilitates trypsin-mediated GLP-1 inactivation. These findings identify a new class of modulators of GLP-1R signaling and suggest that GLP-1 might be a viable target for drug discovery. Our results also highlight a feasible approach for screening bioactive activity of plant extracts.
Introduction
Glucagon-like peptide-1 receptors (GLP-1R)3 are expressed in a wide variety of tissues, including pancreatic islet β-cells, lungs, heart, kidneys, blood vessels, neurons, and lymphocytes (1). Mice with GLP-1R gene knock-out or with functionally deficient GLP-1R signaling exhibit impaired glucose homeostasis, learning, and memory (1). Clinical trials have also targeted GLP-1 signaling in other conditions, including psoriasis, heart disease, and neurodegenerative disease (2–5). As such, GLP-1R signaling might be an ideal research target for the discovery and development of drugs for the treatment of various conditions from metabolic disorders to neurodegeneration. The GLP-1Ris a current therapeutic target for treatment of type 2 diabetes (6, 7).
After food intake, plasma levels of GLP-1 rapidly rise 3–4-fold, enhancing glucose-dependent insulin secretion, to maintain normoglycemia (8, 9). Bioactive forms of GLP-1 contain an alanine at position 2 and are rapidly degraded by dipeptidyl peptidase 4 to its inactive forms, GLP-1(9–36)-amide or GLP-1(9–37), following release from gut L cells. In general, GLP-1 is quickly secreted after food intake and rapidly cleared by dipeptidyl peptidase 4 and the kidneys (10). GLP-1 has a very short half-life and is sensed by its receptor in a transient and tightly regulated manner in healthy subjects.
Current therapeutic strategies aim to enhance activation of GLP-1R in target tissues by maintaining chronically high plasma levels of GLP-1 analogs (6, 7). This approach is in contrast to the natural rapid secretion and clearance of GLP-1, and it can lead to loss of temporal regulation of GLP-1R signaling. GLP-1R is present in many different tissues and is involved in diverse physiological functions (1). It is often the case that local concentrations of GLP-1, rather than systemic levels, regulate tissue-specific GLP-1R activation (11). Therefore, constitutive activation of GLP-1R could result in various off-target effects; chronically high plasma GLP-1 levels can also lead to loss of spatial or tissue-specific control of GLP-1R activation. In some conditions, tissue-specific impairment of GLP-1R signaling, rather than a global decrease in plasma GLP-1, leads to disease pathogenesis, as is the case for type 2 diabetes (12–14). These findings indicate that constitutive activation of GLP-1R by chronically high plasma levels of GLP-1 analogs are likely not the best therapeutic strategy. Clinical observations also suggest that side effects, such as nausea, vomiting, and gastrointestinal distress, may be related to chronically high plasma GLP-1 (15). Concerns about risks for developing pancreatitis and pancreatic malignancies with therapies targeting GLP-1R signaling have also been raised (16). These findings emphasize that other strategies should be considered when treating GLP-1R-related disorders.
To avoid these potentially adverse effects of treatment with GLP-1 analogs, we searched for positive modulators of GLP-1R signaling that themselves do not activate GLP-1R. Compounds that positively modulate GLP-1/GLP-1R signaling would control the degree of activation according to endogenous levels of GLP-1 and are less likely to lead to chronic activation of GLP-1R. Furthermore, such compounds would not affect temporal control of receptor activation.
To this end, we utilized two independent assay platforms designed to detect positive modulators of GLP-1R activity from crude plant extracts. One assay relates to GLP-1R internalization, a common step for activation of most of the G protein-coupled receptors (GPCRs) (17). Because activation of GLP-1R leads to an increase in intracellular cAMP production (18), the second assay employs a real time intracellular cAMP biosensor (RG-cAMP sensor) (19), capable of sensing intracellular cAMP production within minutes. These two assays were used in our initial screening of GLP-1 modulatory activity and for tracking and quantifying such activity during compound purification. In screening extracts from edible plants, we identified fenugreek seed extract that potentiates both GLP-1-dependent GLP-1R endocytosis and cAMP response. Fenugreek seeds have traditionally been used in Middle Eastern, Indian, Mediterranean, and Central Asian cuisine. Fenugreek seeds may also help with reducing blood sugar levels in diabetic patients (20). In addition, fenugreek seed also displays neuroprotective effects (21) and anti-inflammatory properties in animal models (22, 23), these effects may be related to GLP-1R signaling.
The ability to potentiate GLP-1 potency would be a highly desirable characteristic of small molecules for the purpose of targeting GLP-1R signaling pathways. The methods we describe here represent important conceptual and operational approaches in discovering class B1 positive modulators of GPCRs. We report the isolation of an active compound with a new structure (N55) from fenugreek seeds. N55 itself does not trigger GLP-1R signaling but instead binds to GLP-1 and enhances its potency in stimulating GLP-1R.
Experimental Procedures
Reagents
U2OS cell line stably expressing a β-arrestin2:GFP fusion protein was obtained from Norak Biosciences (now Molecular Devices, a part of MDS, Mississauga, Ontario, Canada). RINm5F cells stably expressing the RG-cAMP protein were described previously (19). Stearoyl ethanolamide (SEA), 2-oleoylglycerol, and oleoyl ethanolamide (OEA) were purchased from Cayman Chemical Co. (Ann Arbor, MI). Peptides of GLP-1(7–36)-amide, GLP-1(7–36) with six consecutive histidines linked to the C terminus of GLP-1(7–36) (His-tagged GLP-1), and gastric inhibitory polypeptide (GIP) were from LifeTein (Hillsborough, NJ). Exendin 4 (Ex-4) and exendin 9 (Ex-9) were synthesized by Genomics BioSci & Technology (Taipei, Taiwan). Forskolin and G418 were from Sigma. RPMI 1640 tissue culture medium, MEM, fetal bovine serum (FBS), sodium pyruvate, l-glutamine, HEPES, penicillin/streptomycin, amphotericin B, gentamicin, phenol red-free MEM, and 0.05% trypsin EDTA were from Gibco. Coelentarazine 400a was from Gold Biotechnology (St. Louis, MO). The 96-well plates for scanning bioluminescent signals were from PerkinElmer Life Sciences. The black wall clear-bottom 384 microplates for receptor endocytosis assay were from Thermo Fisher Scientific (Waltham, MA). DNA-binding dye Hoechst 33342 was from Molecular Probes (Eugene, OR). PMSF was from U. S. Biochemicals (Cleveland OH). Oleoyl[9,10-3H]ethanolamide ([3H]OEA) was from American Radiolabeled Chemicals Inc. (St. Louis, MO). 125I-Tyr-GLP-1(7–36) (125I-GLP-1(7–36)), UniFilter-96, GF/C, and Microscint-20 and -40, and the 96-well plates for scanning bioluminescent signals were from PerkinElmer Life Sciences. Copper-IDA-agarose was from Jena Bioscience (Germany).
Determination of Concentrations of GLP-1(7–36)-Amide, Exendin 4, and Exendin 9
Molar concentrations were determined using the equation whereby peptide concentration (M) = (A280 × -fold dilution)/(a × 1200 + b × 5560); 1200 and 5560 are the molar extinction coefficients for tyrosine and tryptophan, respectively. a and b are the number of tyrosine and tryptophan residues in the peptide, respectively.
cAMP Assay
Real time intracellular cAMP assay was performed as described previously (19). In brief, RINm5F cells stably expressing the RG-cAMP protein were seeded at 3 × 10⁴ cells/well in 96-well white plates in 0.15 ml of RPMI 1640 medium containing 400 μg/ml G418. The next day, cells were washed twice with 0.1 ml of phenol red-free MEM containing 5 mm HEPES and incubated in the same medium for 1 h. The medium was replaced with 90 μl of the same medium containing 1 mg/ml BSA and 5 μm DeepBlueC. The whole plate was immediately loaded onto a SpectraMax Paradigm Detection Platform equipped with a Dual-Color luminescence detection cartridge and SoftMax Pro 6.2.2 (Molecular Devices, Sunnyvale, CA) to obtain the background BRET signal based on the sequential integration of the luminescence detected at 370–450 and 500–530 nm over 60–150 s. Each well was then stimulated by adding 10 μl of 10× solutions of peptide and lipids and 1 mg/ml BSA in phenol red-free MEM containing 5 mm HEPES, and BRET signals were obtained immediately under identical settings. The BRET ratio is the ratio of light emitted between 90 and 300 s at 500–530 nm to that emitted at 370–450 nm. The cAMP response was expressed as a percentage of cAMP production and was calculated as 100 × (BRET ratio from 0.01 nm GLP-1(7–36)-amide − BRET ratio from indicated concentration of peptide with or without lipids)/(BRET ratio from 0.01 nm GLP-1(7–36)-amide − BRET ratio from 250 nm GLP-1(7–36)-amide). The dose-response curve, maximal response, and concentration of peptide needed to yield half-maximal response (EC50) were obtained by nonlinear regression to fit the data to the agonist versus response equation using Prism software 5.0 (GraphPad, San Diego). Unless specified, all cAMP response data are the means ± S.E. from three independent experiments with triplicate assays.
Receptor Endocytosis Assay
U2OS osteosarcoma cell line stably expressing a β-arrestin2:GFP fusion protein was obtained from Norak Biosciences. The pcDNA3 GLP-1R-V2R chimeric construct contains the first 440 amino acids of the GLP-1R (Met-1 to Thr-440) fused to the last 29 amino acids of the vasopressin V2 receptor (Ala-343 to Ser-371) (24) and separated by two alanine residues as linker. GLP-1R-V2R chimeric construct is inserted into the EcoRI site of pcDNA3 (pcDNA3-GLP-1R-V2R) such that expression of the chimeric protein is under the control of the CMV promoter. pcDNA3-GLP-1R-V2R was used to transfect U2OS osteosarcoma cells stably expressing β-arrestin2:GFP to obtain a cell line stably co-expressing GLP-1R-V2R and β-arrestin2:GFP. High content imaging of receptor endocytosis in cells was conducted with 0.03 to 0.001 mg/ml extract to identify potentiating activity for GLP-1-dependent GLP-1R endocytosis. Extract were supplied at a concentration of 100 mg/ml in 100% DMSO. Three replicate 384-well assay microplates were plated with U2OS cells stably co-expressing GLP-1R-V2R and β-arrestin2:GFP at a density of 3 × 10³ cells/well. Aliquots of 2.5 μl of 10× stocks of the indicated concentration of extract in phenol red-free MEM containing increasing concentrations (0.12–3000 nm) of GLP-1(7–36)-amide and 1 mg/ml BSA were transferred to each well of the assay plate, which contained 22.5 μl of phenol red-free MEM containing 1 mg/ml BSA. The three assay plates were incubated at room temperature for 60 min before cell fixation with 2% formaldehyde and labeling of the cell nuclei with 5 μg/ml of the DNA-binding dye Hoechst 33342 for 1 h. Plates were washed twice with PBS and sealed; plates were used immediately.
Imaging and Analysis
Images were acquired on an XL model of the ImageXpress® Micro System (Molecular Devices, Sunnyvale, CA) and analyzed with MetaXpress High-Content Image Acquisition and Analysis Software (Molecular Devices, Sunnyvale, CA) using the granularity and variable grain analysis modules. MetaXpress was used to retrieve images using DAPI (to retrieve the blue fluorescent Hoechst 33342-labeled nuclear images) and FITC (to retrieve the green fluorescent GFP-β-arrestin images) filter sets and a Plan Fluor ELWD objective. A 20 × 0.45-numerical aperture microscope objective was used for the imaging; two fields were imaged per well. The number of spots, total area covered by spots, average and integrated fluorescence intensity of the spots, and nuclear area and fluorescence intensity were logged into the database. Data from abnormal cells for which the values were above threshold (abnormal: average nuclear staining intensity <500; integrated fluorescence intensity of area covered by spots <150) were ruled out using Acuity Xpress, followed by selection of the measurement method, spot fluorescence integrated intensity to calculate the average number of spots per nucleus. Dose-response curve, maximal response, and the concentration needed to yield half-maximal response were obtained using nonlinear regression to fit the data to the agonist versus response equation with Prism software 5.0. The extent of receptor endocytosis response was expressed as percent of that elicited by 750 nm GLP-1(7–36)-amide.
Competition Binding Assay
Competition assays to evaluate the binding of signal non-enhancing SEA and N55 to His-tagged GLP-1 were carried out as described previously (19). Briefly, increasing concentrations of N55 or SEA were incubated with 0.2 μm [3H]OEA in the presence (total binding) or absence (nonspecific binding) of 0.2 μm His-tagged GLP-1. The reaction was carried out in 50 μl of Dulbecco's phosphate-buffered saline (DPBS) containing 0.02 mg/ml bovine serum albumin (BSA) at room temperature for 90 min. Copper-iminodiacetic acid-agarose (Cu2+-agarose), 3 μl in 30 μl of DPBS, was added to capture all His-tagged GLP-1 (up to 60 μm peptide in an 80-μl reaction), and the mixture was further incubated with rotation at room temperature for 30 min. The mixture was centrifuged at 20,600 × g for 10 min at 4 °C to precipitate His-tagged GLP-1 trapped in the resin, and 20 μl of supernatant containing the unbound free [3H]OEA was mixed with 120 μl of MicroScint 40 (PerkinElmer Life Sciences) for quantification of tritium using single-photon counting (60 s/well read) on a TopCount scintillation counter (PerkinElmer Life Sciences). Specific binding was calculated, wherein bound [3H]OEA = (supernatant [3H]OEA of nonspecific binding reaction) − (supernatant [3H]OEA in the total binding reaction).
Preparation of GLP-1 Receptor Membrane
U2OS cells stably expressing GLP-1R-V2R were grown to 90% confluence (about 107 cell per 15 cm dish). The media were removed and washed twice with 30 ml of PBS, followed by adding 2.2 ml of ice-cold homogenization buffer (20 mm HEPES, 1 mm EDTA, 0.7% protease inhibitor mixture P8340 (Sigma) per dish. The cells were scraped immediately and centrifuged at 3000 × g, 4 °C, for 30 min. The pellet was resuspended with 5 ml of homogenization buffer and then homogenized at maximal speed on a Polytron 3000 for 10 s on ice with a 30-s interval rest, three times. The homogenized cells were centrifuged for 10 min at 4 °C and 1000 × g. The supernatants were transferred to a fresh transparent centrifuge tube and centrifuged for 60 min at 4 °C and 55,000 × g. The pellets were resuspended with resuspension buffer (20 mm HEPES, 1 mm MgCl2, 0.7% protease inhibitor) by passing through a 22-gauge needle one time, a 25-gauge needle three times, then a 26-gauge needle one time. The protein concentration of the membrane preparation was determined according to the Qubit fluorometer instructions (Life Technologies, Inc.). 4–5 μg of this membrane yielded greater than 5-fold signal/background with 125I-labeled GLP-1 at 5 nm in a 0.22-ml assay volume.
Assay for Insulin Release from RINm5F Cells
For measuring insulin release, RINm5F cells were seeded at 60,000 cells/well in a 96-well plate in 0.15 ml of RPMI 1640 medium. The next day, cells were washed twice with 0.1 ml of phenol red-free MEM (11 mm glucose) containing 5 mm HEPES, pH 7.0, and 1 mg/ml BSA; cells were incubated at the same medium for 1 h. The medium was replaced with 0.05 ml of the same fresh medium containing the indicated compound and were incubated for 30 min at 37 °C. Media were withdrawn, centrifuged, and assayed for insulin by rat insulin ELISA (Mercodia AB, Uppsala, Sweden). Each assay was performed in duplicate, and each was repeated three times.
Cell Viability Test
Cytotoxicity of H460 cells to various compounds was assessed using PrestoBlue® reagent, which is modified by the reducing environment of the viable cell and turns from blue to red in color. In brief, 3000 H460 cells were seeded with 0.1 ml of RPMI 1640 medium in each well of a 96-well plate and incubated at 37 °C for 24 h before compound treatment. After a 72-h compound treatment, PrestoBlueTM cell viability reagent (Invitrogen) was added to each well according to the manufacturer's protocol. The plates were further incubated in the dark at 37 °C in 5% CO2 for 10 min, and absorbance of all wells was read at both the 570- and 600-nm wavelengths using automatic enzyme-linked immunosorbent assay plate reader (Molecular Devices, Union City, CA). The raw data were normalized and corrected according to the manufacturer's protocol. All samples were tested in triplicate, and each test was repeated three times. Cell viability was calculated using the following formula: percent of 100 × (average corrected values of compound treated cells)/(average corrected values of untreated cells).
Receptor Binding Assay
Assays were conducted in 0.22 ml of 50 mm HEPES, pH 7.4, 5 mm MgCl2, 1 mm CaCl2, and 1 mg/ml BSA containing 3.9 μg of GLP-1 receptor membranes and varying concentrations of 125I-labeled GLP-1(7–36) radioactive ligand with or without 7.7 μm N55 and in the absence (total binding) or presence (nonspecific binding) of 1000-fold excess unlabeled exendin 4. The reactions were incubated for 90 min. Prior to filtration, an FC 96-well harvest plate (Millipore, MAFC N0B 10; Billerica, MA) was coated with 0.5% polyethyleneimine for 30 min, then washed with 50 mm HEPES, pH 7.4. 0.1 ml of binding reaction was transferred to the filter plate and washed 15 times (0.1 ml per well per wash) with ice-cold 25 mm HEPES, pH 7.4, and 50 mm NaCl. The plate was dried followed by adding 30 μl of MicroScint 20 (PerkinElmer Life Sciences) per well and, the activity was determined by using single-photon counting (60 s/well read) on a TopCount scintillation counter (PerkinElmer Life Sciences). Specific bindings were obtained by subtracting nonspecific binding from total binding. Dissociation constant (Kd) for GLP-1(7–36)-amide was obtained using Prism software 5.0 (Graph Pad, La Jolla, CA). Data shown are the means ± S.E. and were duplicated from three independent experiments.
In Vitro Assay of Trypsin Activity in the Presence of N55
To determine whether N55 affects trypsin activity, we used the trypsin activity colorimetric test kit (BioVision, Milpitas, CA). Briefly, 2 μl of substrate were added to a well in a 96-well plate containing 48 μl of 0.000125% trypsin in the presence or absence of 77 μm N55. Reactions were conducted at room temperature, and the extent of cleavage was monitored by real time reading of absorbance at 405 nm.
Limited Trypsin Digestion of GLP-1(7–36)-Amide
Trypsin digestion was carried out at 37 °C for 30 min in 0.1 ml of phenol red-free MEM containing 5 mm HEPES, pH 7.0, 2 μm GLP-1(7–36)-amide, 2 × 10⁻³ to 2.47 × 10⁻⁵% of trypsin (prepared by diluting 0.05% trypsin-EDTA), and the indicated concentrations of N55 or SEA. Reaction was terminated by incubating at 94 °C for 30 min and then at 4 °C for 10 min, followed by addition of PMSF to 1 mm, and 30 min of incubation at room temperature. N55 was adjusted to 7.7 μm for all the cAMP responses to titration of the GLP-1 in RINm5F cells.
Isolation of N55 from Fenugreek Seeds
Ethanol extraction of fenugreek seeds and solvent partition of the extracts are outlined in Fig. 1. Ethyl acetate fraction of solvent partition (FE-E-EA) was further fractionated by normal phase silica gel chromatography. 25 g of FE-E-EA was absorbed onto 79 g of silica gel and then chromatographed on a column (4.5 × 43 cm) packed with 370 g of silica gel by stepwise elution with 2500 ml of 20:80 ethyl acetate/hexane (20% EA/Hx), 2500 ml of 40:60 ethyl acetate/hexane (40% EA/Hx), 2500 ml of 60:40 ethyl acetate/hexane (60% EA/Hx), 2500 ml of 80:20 ethyl acetate/hexane (80% EA/Hx), and 2500 ml of 100% ethyl acetate (100% EA), followed by 2500 ml of methanol/ethyl acetate (50:50; 50% EA/Me). Thirty 500-ml fractions were collected, evaporated, and subjected to activity tests, and fractions with expected activities were combined. Final purification of the combined F2 fraction and primary structure elucidation of the active compound was contracted to AnalytiCon Discovery GmbH (Potsdam, Germany). Briefly, 3 g of the partially purified extract with expected activity from normal phase silica gel chromatography (F2) was further fractionated by preparative reverse phase-HPLC (RP-HPLC) (LiChrospher® select B column 250 × 25 mm, 10 μm). The column was first eluted using a linear gradient of 50–95% acetonitrile/methanol in water for 57.7 min at a flow rate of 80 ml/min, followed by elution with 100% acetonitrile/methanol for 10 min. Based on detected peaks (evaporative light scattering detector and UV light), the neighboring similar fractions per fractionation were partially combined to give 72 fractions. The resulting final fractions were evaporated and subjected to activity tests. Fractions exhibiting potent activity enhancing GLP-1R signaling through GLP-1 were subjected to structure elucidation.
FIGURE 1.
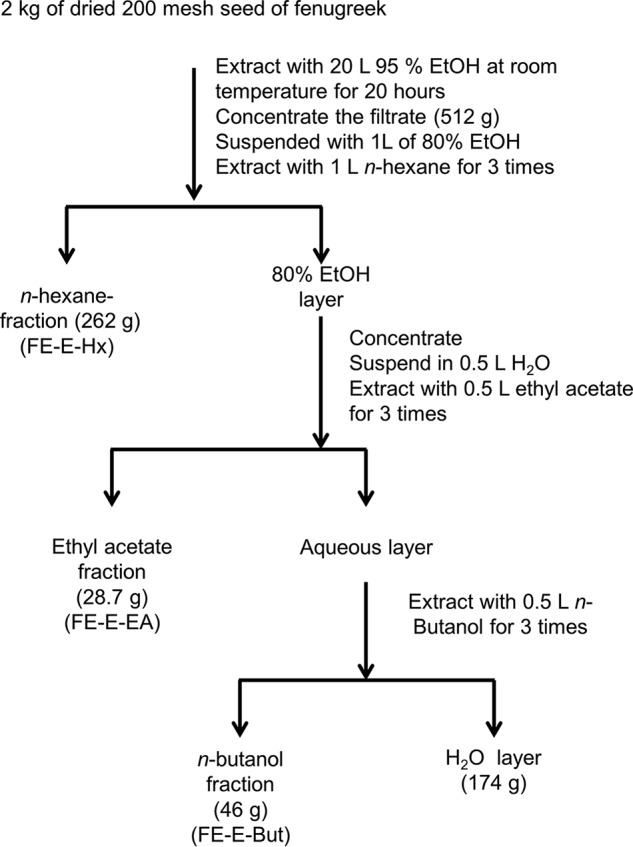
Ethanol extraction and solvent partition of 2 kg of fenugreek seed. The extraction started with extracting 2 kg of dried seed powder of fenugreek with 20 liters of 95% ethanol for 20 h. The 519 g of concentrated and dried ethanol extract (FE-E) were further subjected to solvent partition with n-hexane, ethyl acetate, n-butanol, and water to give 262 g of n-hexane fraction (FE-E-Hx), 28.7 g of ethyl acetate fraction (FE-E-EA), 46 g of n-butanol fraction (FE-E-But), and 174 g of water fraction.
Synthesis and Final Structure Characterization of N55
See supplemental material for synthesis and final structure characterization of N55.
Results
Fenugreek Seed Extracts Potentiate GLP-1 Signaling
Initial extraction and solvent partition of fenugreek seeds is illustrated in Fig. 1. To investigate GLP-1R signaling, we employed β-arrestin2-GFP biosensing technology, based on the observation that β-arrestin binding of an activated receptor is a convergent step in GPCR signaling (17). These processes can be visualized (25), allowing for exclusion of false-positive hits. Because GLP-1R activation also leads to an increase in cAMP production (19), the RG-cAMP sensor (an Epac1 cAMP biosensor) (19) was used to monitor real time cAMP production in rat insulinoma RINm5F cells (19). This rapid real time cAMP response assay significantly reduced detection of nonspecific effects of the extract mixture and allowed us to detect receptor-specific responses.
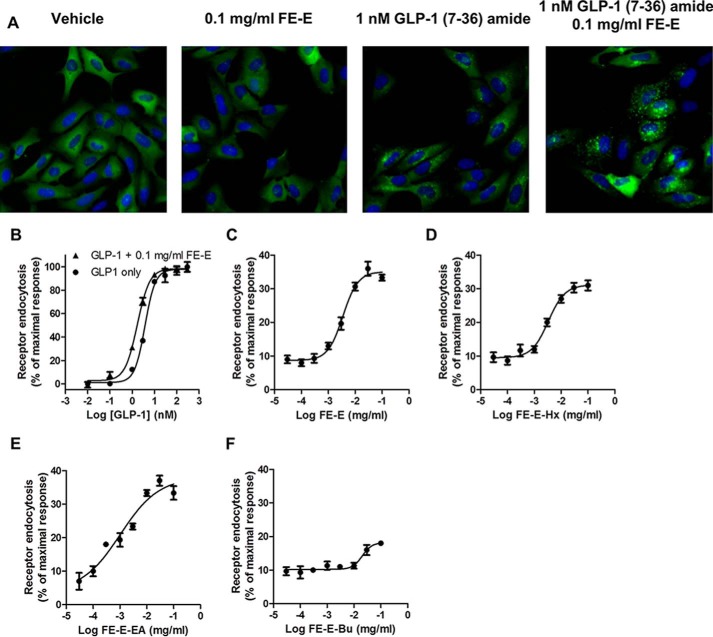
Ethanol extracts of seeds of fenugreek (FE-E) enhanced the response to GLP-1(7–36)-amide stimulation. β-Arrestin2-GFP fusion proteins were originally evenly distributed in the cytosol of U2OS cells co-expressing β-arrestin2-GFP and GLP-1R (Fig. 2A). The formation of pit complex β-arrestin2-GFP-GLP-1R can be visualized when cells were stimulated with 1 nm GLP-1(7–36)-amide. Pit complexes became more prominent when 0.1 mg/ml FE-E was included. FE-E alone did not induce formation of pits (Fig. 2A). Fig. 2B illustrates the effect of FE-E on receptor endocytosis with titration of GLP-1(7–36)-amide. EC50 of GLP-1(7–36)-amide required to induce half-maximal response was reduced from 3.8 to 1.7 nm by 0.1 mg/ml FE-E. This effect of FE-E is highly dependent on the concentration of GLP-1, as it was diminished when GLP-1 concentration was reduced to 0.01 nm (Fig. 2B). FE-E facilitated receptor endocytosis elicited by 1 nm GLP-1(7–36)-amide in a dose-dependent and saturable manner (Fig. 2C). Receptor endocytosis elicited by 1 nm GLP-1(7–36)-amide was no more than 10% of that elicited by 750 nm GLP-1(7–36)-amide. Addition of 0.0037 mg/ml FE-E enhanced receptor endocytosis by up to 20%, and the response was saturated at 33%, when the concentration of FE-E reached 0.03 mg/ml (Fig. 2C). EC50 of FE-E required to enhance stimulation by 1 nm GLP-1 was 0.0035 mg/ml. FE-E was further subjected to fractionation by solvent partition to produce hexane (FE-E-Hx), ethyl acetate (FE-E-EA), and butanol fractions (FE-E-Bu) (Fig. 1), and their effects on receptor endocytosis were examined (Fig. 2, D–F). Signal-enhancing activity was enriched in FE-E-EA. EC50 of extract required to enhance receptor endocytosis by 1 nm GLP-1 was reduced from 0.0035 mg/ml (FE-E) to 0.0009 mg/ml (FE-E-EA) (Table 1). Because GLP-1R activation leads to intracellular cAMP production in pancreatic β-cells, we tested whether these extracts potentiate GLP-1-induced cAMP production in RINm5F cells. We examined the effect of 0.1 mg/ml FE-E-Hx and FE-E-EA fractions on the potency of GLP-1 stimulation of cAMP production (Fig. 3). GLP-1 stimulated cAMP production in RINm5F cells expressing the RG-cAMP sensor (19) in a dose-dependent and saturable manner, with an EC50 of 2.8 nm (Fig. 3). In the presence of 0.1 mg/ml FE-E-EA or FE-E-Hx, EC50 was reduced to 0.18 or 1.67 nm, respectively. The butanol and the water fractions did not show any activity. A summary of this step of fractionation is shown in Table 1. Activity of FE-E was highly enriched in the ethyl acetate fraction (FE-E-EA), whereas butanol and water fractions displayed little activity.
FIGURE 2.
Effect of extracts from fenugreek seeds on GLP-1 receptor endocytosis to the titration of GLP-1(7–36)-amide. A, fluorescent images of effect of vehicle, 0.1 mg/ml ethanol extract of fenugreek seed (FE-E), 1 nm GLP-1(7–36)-amide, and 1 nm of GLP-1(7–36)-amide plus 0.1 mg/ml FE-E on the distribution of β-arrestin2-GFP in U2OS cells co-expressing GLP-1R-V2R. B, dose-response curve of receptor endocytosis in response to increasing concentrations of GLP-1(7–36)-amide in the presence (black triangles) or absence (black circles) of 0.1 mg/ml FE-E. GLP-1R endocytosis elicited by 1 nm GLP-1(7–36)-amide and in the presence of increasing concentration of FE-E (C), n-hexane partition fraction of FE-E (FE-E-Hx) (D), ethyl acetate partition fraction of FE-E (FE-E-EA) (E) and n-butanol partition fraction of FE-E (FE-E-Bu) (F). Data are mean ± S.E. from triplicate of three independent experiments.
TABLE 1.
Summary of solvent partition of fenugreek seed
| Fraction | Weight | Weight yield | EC50a (mg/ml) × 10−3 | Specific activityb (units/mg) × 104 | Total activity (units) × 109 | Activity yield |
|---|---|---|---|---|---|---|
| g | % | % | ||||
| FE seed | 4000 | 100 | ||||
| Ethanol extract (FE-E) | 512 | 25.6 | 3.5 | 1.14 | 5.851 | 100 |
| n-Hexane fraction (FE-Hx) | 262 | 13.1 | 2.55 | 1.6 | 4.1 | 70.0 |
| Ethyl acetate fraction (FE-EA) | 28.7 | 1.435 | 0.94 | 4.25 | 1.22 | 20.03 |
| n-Butanol fraction (FE-Bu) | 46 | 2.3 | 24.4 | 0.164 | 0.08 | 1.29 |
| H2O fraction (FE-W) | 173 | 8.65 | NDc | ND |
a EC50 is the concentration of extract required to achieve half-maximal receptor endocytosis response to the titration of extracts from 0.03 to 100 μg/ml in the presence of 1 nm GLP-1(7–36)-amide in an assay volume of 0.025 ml. 1 unit of activity is arbitrarily defined as the activity to the elicited 50% of response in an assay containing 1 nm GLP-1(7–35)-amide. Data are mean ± S.E. from triplicate of at least two independent experiments.
b Specific activity (units/mg) is arbitrarily defined as the amount of units per mg of extract fraction and is calculated by (1/0.025) × 1/EC50.
c ND means not done.
FIGURE 3.
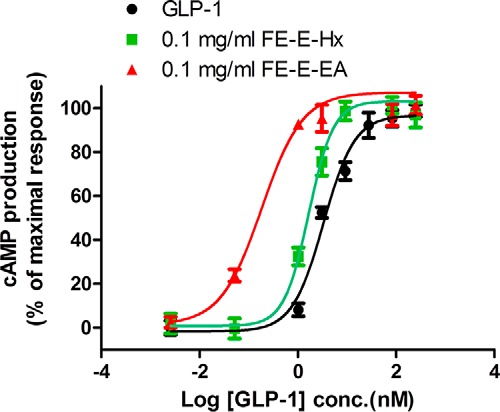
Extracts from fenugreek seed-enhanced GLP-1(7–36)-amide stimulated cAMP production in RINm5F cells. cAMP production response to GLP-1(7–36)-amide titration in RINm5F cells expressing RG-cAMP sensor fusion protein in the presence of 0.1 mg/ml hexane partition fraction (FE-E-Hx) (green squares) or ethyl acetate fraction (FE-E-EA) (red triangles) or vehicle (black circles). Activity was expressed as cAMP production % of the maximal response and was calculated as 100·(A − B)/(A − M), where A = BRET ratio by 10 pm GLP-1(7–36)-amide; B = BRET ratio by indicated concentration of GLP-1(7–36)-amide in the presence of indicated concentration of extract, and M = BRET ratio by 0.25 μm of GLP-1(7–36)-amide. Data are mean ± S.E. of triplicates of three independent experiments.
Isolation and Structural Elucidation of the Active Compound
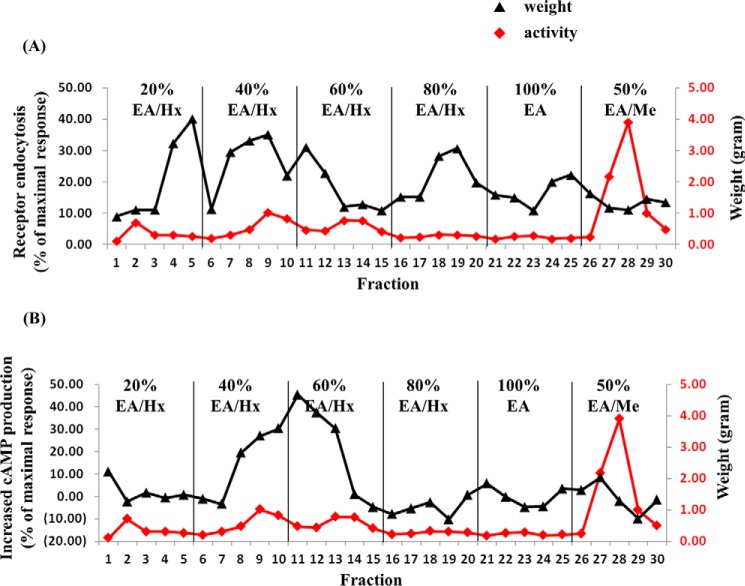
Because the FE-E-EA fraction potently enhanced GLP-1R signaling, this fraction (24 g) was chromatographed on normal phase silica gel. The column was eluted with mixtures of proportional hexane, ethyl acetate, and methanol of increasing polarity. As shown in Fig. 4, the FE-E-EA fraction was separated into 30 fractions, which can be divided into four major groups according to their ability to potentiate GLP-1-induced GLP-1R endocytosis (Fig. 4A). The first group (F1) includes fractions 4 and 5; the second group (F2) includes fractions 7–12; the third group (F3) includes fractions 18–22; and the fourth group (F4) includes fractions 24–27. In addition to facilitation of GLP-1R endocytosis, we also examined the effect of these fractions (10 μg/ml) on cAMP production induced by 1 nm GLP-1. Only fractions 8–13 significantly potentiated cAMP response(Fig. 4B).
FIGURE 4.
Normal phase silica gel chromatogram of FE ethyl acetate partition fraction. 24 g of FE-E-EA was subjected to normal phase silica gel chromatography and eluted stepwise with solvent of increasing polarity; 20% ethyl acetate in n-hexane (20% EA/Hx), 40% ethyl acetate in n-hexane (40% EA/Hx), 60% ethyl acetate in n-hexane (60% EA/Hx), 80% ethyl acetate in n-hexane (80% EA/Hx), 100% ethyl acetate (100% EA), and 50% methanol in ethyl acetate (50% EA/Me) as described under “Experimental Procedures.” A, activity was assayed for each fraction (0.01 mg/ml each fraction was tested for its ability to potentiate receptor endocytosis elicited by 1 nm GLP-1) and was expressed as % of the response by 0.75 μm of GLP-1(7–36)-amide. B, increased cAMP production in RINm5F cells stably expresses RG-cAMP sensor. Activity was expressed as increased cAMP production (% of the maximal response) and was calculated as 100×(A − B)/(C − M), where A = BRET ratio by 1 nm GLP-1(7–36)-amide; B = BRET ratio by 1 nm GLP-1(7–36)-amide in the presence of 0.01 mg/ml indicated fraction; C = BRET ratio by 10 pm GLP-1(7–36)-amide, and M = BRET ratio by 0.25 μm GLP-1(7–36)-amide. Black triangles and red diamonds represent activity and weight of each fraction, respectively.
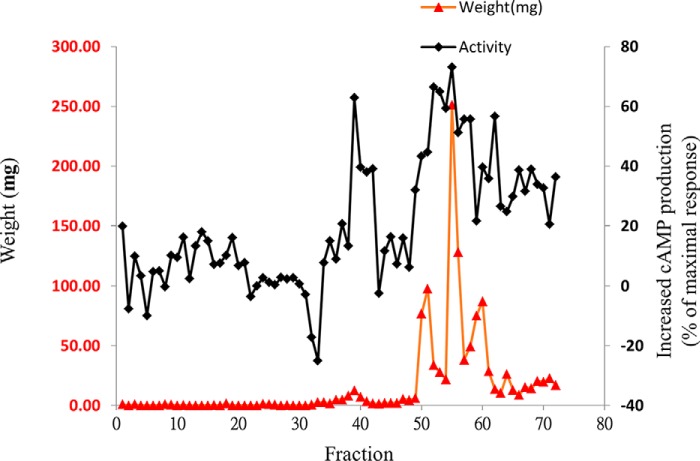
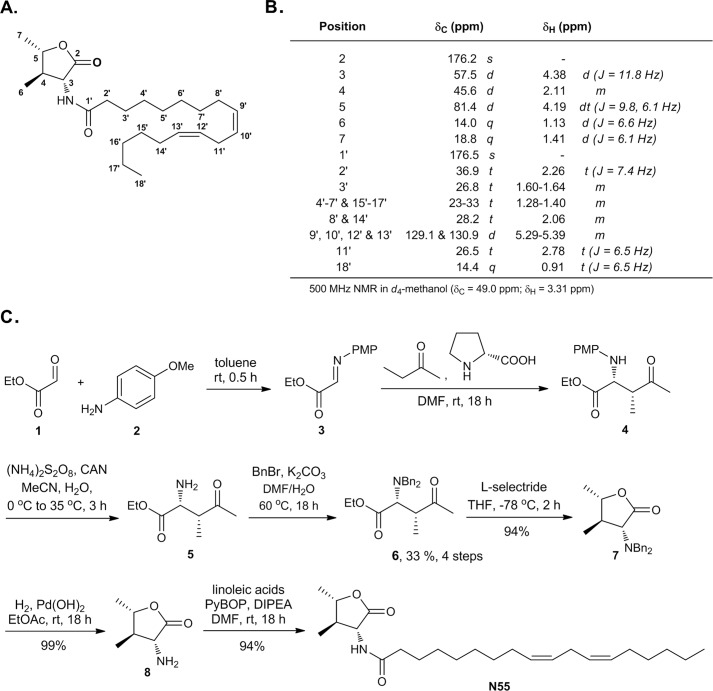
Fractions 8–13 were combined (FE-E-EA-F2) and subjected to further purification by reverse phase chromatography to yield 72 fractions (Fig. 5). To track activity, each fraction (10 μg/ml) was used tested for its ability to enhance the cAMP response elicited by 1 nm GLP-1. Fractions 39, 42, 52, 55, 58, 60, and 62 exhibited potent activity in this respect (Fig. 5). Because fraction 55 had the highest yield and purity, this fraction (N55) was further analyzed using high resolution MS, MS/MS, IR, and NMR (1H,13C NMR, HH-COSY, HSQC, and HMBC, supplemental Figs. S1–S3 and Table S1). The NMR assignment of N55 is depicted in Fig. 6, A and B, and the absolute configuration was determined by total synthesis as shown in Fig. 6C through amino ester 4, of which the enantiomer was first reported in 2002 (26). The synthetic N55 is identical in all respects to the authentic sample isolated from fenugreek. Accordingly, the structure of (−)-N55 was assigned as (9Z,12Z)-N-((3R,4R,5S)-4,5-dimethyl-2-oxotetrahydrofuran-3-yl)octadeca-9,12-dienamide.
FIGURE 5.
Reverse phase chromatography profile of FE-EA-F2 versus activity to enhance cAMP production by GLP-1 in RINm5F cells stably expressing RG-cAMP sensor. 3 g of FE-EA-F2 were fractionated by preparative RP-HPLC (LiChrospher® select B column 250 × 25 mm, 10 μm) and resolved into 72 fractions. Each fraction (0.01 mg/ml) was tested for its ability to enhance cAMP production by 1 nm GLP-1(7–36)-amide in RINm5F cells stably expressing RG-cAMP. Activity was expressed as increased cAMP production (% of the maximal response) and was calculated as 100×(A − B)/(C − M), where A = BRET ratio by 1 nm GLP-1(7–36)-amide; B = BRET ratio by 1 nm GLP-1(7–36)-amide in the presence of 0.01 mg/ml indicated fraction; C = BRET ratio by 10 pm GLP-1(7–36)-amide; and M = BRET ratio by 0.25 μm GLP-1(7–36)-amide. Black diamonds represent activity and red triangles indicate weight (mg) for each fraction.
FIGURE 6.
Structure elucidation of N55. A, structure of N55. B, NMR assignment of N55. C, total synthesis of N55 for the absolute structure confirmation. PMP, para-methoxyphenyl; CAN, ceric ammonium nitrate; Bn, benzyl; PyBOP, benzotriazol-1-yl-oxytripyrrolidinophosphonium hexafluorophosphate; DIPEA, diisopropylethylamine.
N55 Enhances GLP-1R Signaling
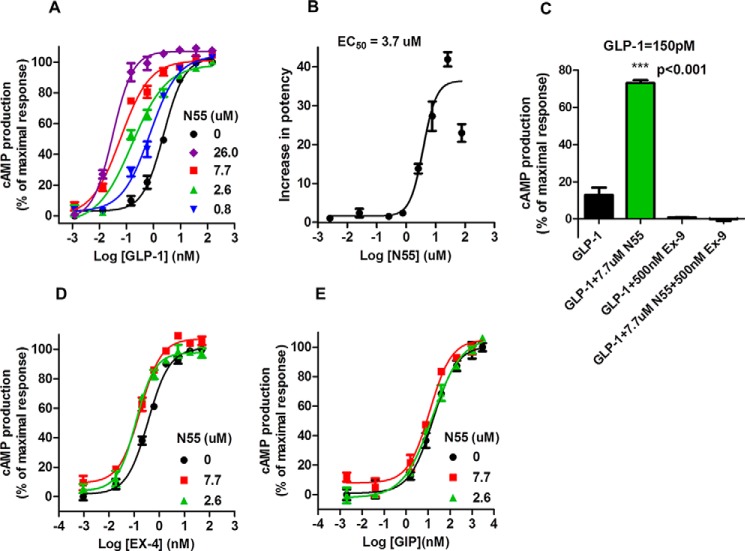
We analyzed the effect of N55 on GLP-1-induced cAMP production in RINm5F cells stably expressing RG-cAMP (19). GLP-1 induced cAMP production in a dose-dependent and saturable manner (Fig. 7A), with an EC50 of 2.4 nm. N55 enhanced the cAMP response to GLP-1 and shifted the dose-response curve to the left >10-fold. N55 potently reduced the EC50 of GLP-1 by a factor of 40 as its concentration increased from 0.8 to 26 μm (Fig. 7A). The augmentation diminished as GLP-1 concentration fell to 1 pm, indicating a lack of intrinsic agonistic activity of N55 (Fig. 7A). N55 increased the potency of GLP-1 in a dose-dependent and saturable manner (Fig. 7B), with an EC50 of 3.7 μm. The EC50 of GLP-1 decreased from 2.2 to 1.52, 0.96, 0.17, 0.07, and 0.05 nm in the presence of 0.3, 0.8, 2.6, 7.7, and 26 μm N55, respectively (Table 2). These results correspond to 1.45-, 2.3-, 13-, 31-, and 40-fold increases in potency of GLP-1 as the concentration of N55 increased from 0.3 to 26 μm. cAMP response to 150 pm GLP-1 was enhanced >5-fold by 7.7 μm N55 (Fig. 7C, Student's t test, p < 0.001), and both cAMP response and enhancement were eliminated by 2 μm of the GLP-1R antagonist Ex-9. This analysis indicates that the enhancing effect of N55 on GLP-1-induced cAMP response was solely mediated by GLP-1R in RINm5F cells. To examine the specificity of N55 on GLP-1R signaling, we further analyzed the effect of N55 on cAMP production in RINm5F cells stimulated by the gastric inhibitor polypeptide (GIP). GIP is another incretin, and its receptor is also expressed in RINm5F cells (27). Activation of the GIP receptor leads to production of cAMP in RINm5F cells (19, 27). The cAMP response to either GIP or exendin 4 (Ex-4, a GLP-1 analog) is not affected by N55 (Fig. 7, E and D, respectively). This analysis indicates that the enhancing effect of N55 on cAMP production is specific to the GLP-1(7–36)-amide.
FIGURE 7.
N55 specifically enhances GLP-1(7–36)-amide-stimulated cAMP production in RINm5F cells. A, effect of increasing concentrations of N55 on cAMP production in response to GLP-1(7–36)-amide titration in RINm5F cells expressing RG-cAMP biosensor. B, N55 dose-dependently and saturably increases the potency of GLP-1 to stimulate cAMP production. C, effect of exendin 9 on cAMP production in response to 150 pm GLP-1(7–36)-amide alone or together with the presence of 7.7 μm N55. Effect of N55 on cAMP production responses to the titrations of Ex-4 (D) or GIP (E). Activity was expressed as cAMP production % of the maximal response and was calculated as 100×(A − B)/(A − M), where A = BRET ratio by 10 pm GLP-1(7–36)-amide; B = BRET ratio by indicated concentration of GLP-1(7–36)-amide in the presence of indicated concentration of N55, and M = BRET ratio by 0.25 μm GLP-1(7–36)-amide. Increase in potency of GLP-1 to stimulate cAMP response is calculated by (EC50 of GLP-1)/(EC50 of GLP-1 in the presence of indicated concentration of N55). Data are mean ± S.E. of triplicates of three independent experiments. Student's t test (p < 0.001) for cAMP response elicited by 150 pm GLP-1(7–36) in the absence versus the presence of N55.
TABLE 2.
Effect of increasing concentrations of N55 on EC50 of GLP-1(7–36)-amide to induce cAMP production
| N55 concentration (μm) | 0 | 26 | 7.7 | 2.6 | 0.77 | 0.26 |
| EC50 (nm)a | 2.20 ± 0.64 | 0.05 ± 0.01 | 0.07 ± 0.02 | 0.17 ± 0.04 | 0.96 ± 0.16 | 1.52 ± 0.25 |
a Data are mean ± S.D. from triplicate of at least three independent experiments.
N55 Facilitates GLP-1-induced GLP-1R Endocytosis
The above analyses suggest that through the GLP-1(7–36)-amide, N55 enhances coupling of GLP-1R to Gαs. We further characterized the effect of N55 on GLP-1R endocytosis elicited by GLP-1(7–36)-amide. EC50 of GLP-1(7–36)-amide-induced GLP-1R endocytosis was 3.6 nm (Fig. 8A). N55 at a concentration of 7.7 μm significantly shifted the dose-response curve of GLP-1 titration to the left and reduced EC50 to 0.27 nm. The effects of titration of N55 on GLP-1R endocytosis elicited by 1 nm GLP-1 indicate that N55 facilitated GLP-1(7–36)-amide stimulation of receptor endocytosis in a dose-dependent and saturable manner (Fig. 8B). EC50 of N55 required to enhance receptor endocytosis by 1 nm GLP-1 was 0.87 μm.
FIGURE 8.
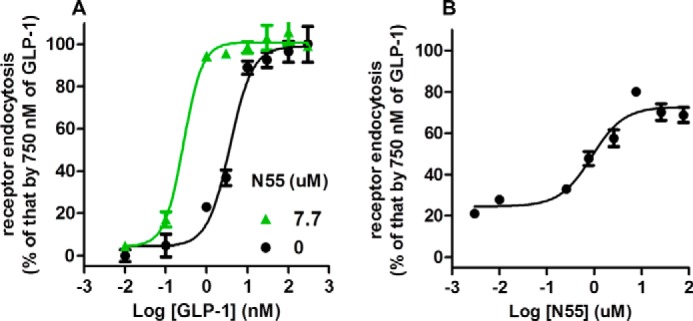
N55 enhances GLP-1(7–36)-amide- dependent GLP-1R endocytosis. Receptor endocytosis assays were performed in U2OS cells co-expression β-arrestin2-GFP and GLP-1R-V2R in the presence of indicated concentrations of GLP-1(7–36)-amide and N55. A, response of GLP-1R endocytosis to the titration of GLP-1 in the absence (black circles) or presence (green triangles) of 7.7 μm N55. B, N55 dose-dependently and saturably enhances GLP-1R endocytosis elicited by 1 nm GLP-1(7–36)-amide. All data are mean ± S.E. of triplicates from three independent experiments.
N55 Facilitates GLP-1-elicited Insulin Release from RINm5F Cells
One major physiological response to the activation of the GLP-1 receptor in pancreatic β-cell lines is insulin release (1). As N55 enhanced the potency of GLP-1(7–36)-amide, we further examined whether N55 could enhance GLP-1-elicited insulin release from RINm5F cell, a rat insulinoma cell line that has been show to release insulin in response to GLP-1 stimulation (28). As shown in Fig. 9, 2 nm GLP-1(7–36)-amide consistently stimulated a low level of insulin release from RINm5F cells, and this response is significantly enhanced by 7.7 μm N55, although N55 alone does not trigger insulin release. Intracellular cAMP level is primarily responsible for enhanced glucose-dependent insulin secretion from pancreatic β-cells (29). Increasing intracellular cAMP level by forskolin will lead to insulin release from RINm5F cells (Fig. 9). This is consistent with the enhancement effect of N55 on cAMP production results from GLP-1 stimulating RINm5F cells.
FIGURE 9.

N55 enhances GLP-1-elicited insulin release from RINm5F cells. Effects of various compounds on insulin release from RINm5F cells are shown. Stimulation of RINm5F cells and assays for insulin release were described under “Experimental Procedures.” Data are means ± S.E. (error bars) of duplicate assays from three independent experiments. Student's t test (★, p < 0.005; ★★★, p < 0.001) for insulin release by vehicle versus the presence of indicated compounds.
N55 Does Not Affect Cell Viability
N55 alone does not affect receptor endocytosis, cAMP production, and insulin secretion. To examine whether these negative effects could result from the cytotoxicity of N55, we compared the effect of N55 on cell viability to those of endocannabinoid-like lipids (2-oleoylglycerol and oleoylethanolamide) and cisplatin (an anti-apoptosis compound). Within the test concentration from 0.78 to 100 μm, N55, 2-oleoylglycerol, and oleoylethanolamide do not show detectable cytotoxicity; however, cisplatin potently killed the cell at a concentration of 50 μm and displayed an IC50 of 6.7 μm (Fig. 10). This analysis revealed that N55 displayed comparable effects on cell viability as those of endocannabinoid-like lipids.
FIGURE 10.
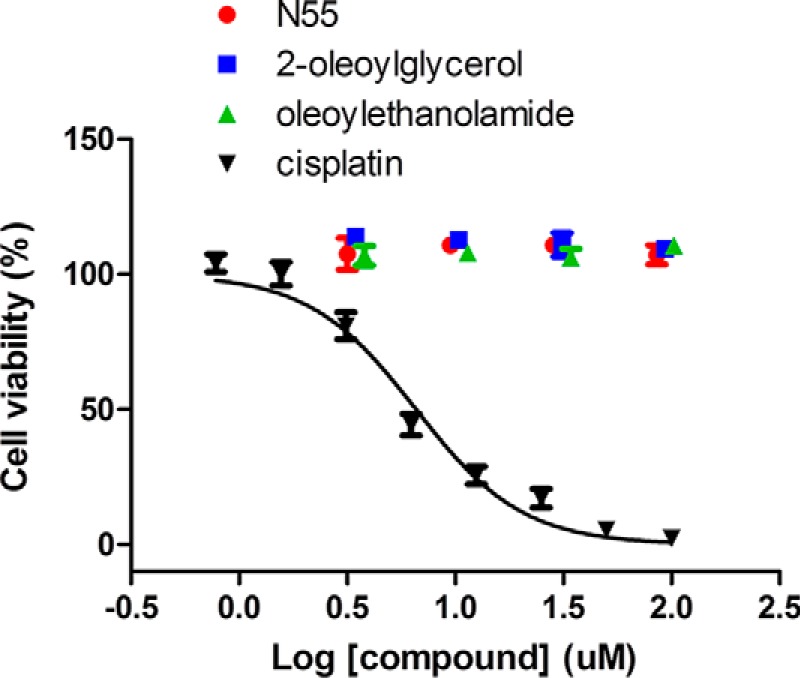
Cytotoxicity test of N55. Dose-dependent N55 (red circles), oleoylethanolamide (green triangles), 2-oleoylglycerol (blue squares), and cisplatin (black inverted triangles) on the viability of H460 cells. Cell viability assays are described under “Experimental Procedures.” Data are means ± S.E. (error bars) of the triplicate assays from three independent experiments.
Effect of N55 on Saturation Binding of GLP-1 to GLP-1R
Because N55 enhanced the potency of GLP-1(7–36)-amide, we further investigated whether this effect may have been due to enhanced binding affinity of GLP-1(7–36)-amide to GLP-1R. We performed saturation binding assays to examine the effects of N55 on GLP-1R binding affinity. Binding of 125I-labeled GLP-1(7–36)-amide to GLP-1R is dose-dependent and saturable, the dissociation constant (Kd) and maximal binding (Bmax) being 1.5 ± 0.25 nm and 51 ± 2.9 pmol/mg membrane, respectively (Fig. 11A). N55 at a concentration of 7.7 μm enhanced cAMP response 30-fold, although this concentration of N55 barely affected the saturation binding curve (Fig. 11B). Kd and Bmax values in the presence of 7.7 μm N55 was 1.4 ± 0.5 nm and 51 ± 6.5 pmol/mg of membrane, respectively. Specific binding of 125I-labeled GLP-1(7–36)-amide to GLP-1R in the presence or absence of 7.7 μm N55 is almost superimposed (Fig. 11C). This analysis suggests that N55 minimally affected GLP-1's affinity for and capacity to bind GLP-1R. Though enhancing the potency of GLP-1(7–36)-amide in stimulating the cAMP response, 7.7 μm N55 did not affect the physical affinity between GLP-1 and its cognate receptor.
FIGURE 11.
N55 does not affect the binding of GLP-1(7–36)-amide to GLP-1R. Total (black circles) and nonspecific (black squares) binding of 125I-labeled GLP-1(7–36) to GLP-1R-V2R membrane in the absence (A) or presence (B) of 7.7 μm N55., specific binding of 125I-labeled GLP-1(7–36) to GLP-1R-V2R membrane in the absence (black circles) or presence (black squares) of 7.7 μm N55. Specific bindings are obtained by subtracting nonspecific bindings from total bindings. All data are mean ± S.E. of duplicates from three independent experiments.
N55 Binds to GLP-1(7–36)-Amide and Facilitates Trypsin Inactivation of GLP-1(7–36)-Amide
N55 selectively enhanced the potency of GLP-1(7–36)-amide, but not that of Ex-4, possibly because N55 might interact with the GLP-1(7–36)-amide peptide. It has been shown that GLP-1 binds to signal-enhancing OEA or 2-oleoylglycerol but not to SEA (19). Competition binding experiments were performed to examine the effect of increasing N55 concentrations on the binding of [3H]OEA to GLP-1. As shown in Fig. 12A, binding of OEA gradually decreased as the concentration of N55 increased from 0.025 to 1.5 μm, and the inhibition constant (Ki) was estimated to be 0.03 ± 0.01 μm. In contrast, SEA did not affect the binding of OEA to GLP-1. A potential consequence of the binding of N55 to GLP-1 is induction of a conformational change in the peptide. It has previously been demonstrated that there are significant concentration-dependent conformational changes in GLP-1 within the range of 3–50 μm (30). Therefore, we utilized susceptibility to trypsin digestion to explore potential conformational changes in GLP-1(7–36)-amide at low micromolar concentrations upon binding N55. The two trypsin cleavage products of GLP-1(7–36)-amide correspond to an inactive GLP-1 (7–26) and a partially active GLP-1 (7–34) (31). Residual activity simulating cAMP production after trypsin treatment was used to determine susceptibility of the peptide to trypsin digestion. Increasing the concentration of trypsin from 2.47 × 10⁻⁵ to 2 × 10⁻³% reduced residual GLP-1 activity by a factor of 27 (Fig. 12B). When the trypsin cleavage reactions were carried out in the presence of 77 μm N55 (Fig. 12C), the residual GLP-1 activity was dramatically reduced by a factor of >300 (Fig. 12C). We also compared the effect of SEA, which was shown to have no effect on the potency of GLP-1 in stimulating cAMP production. Fig. 12D shows that residual GLP-1 activity was reduced only by a factor of 8 in the presence of 92 μm SEA. These results illustrate that trypsin digestion of GLP-1(7–36)-amide was facilitated by N55, but N55 did not affect innate enzymatic activity of trypsin (Fig. 13). To determine whether this effect of N55 is dose-dependent, inactivation of GLP-1(7–36)-amide by 6.7 × 10⁻⁴% trypsin was carried out with increasing concentrations of N55 from 0.8 to 77 μm. Residual activity of GLP-1(7–36)-amide decreased by a factor of >30 (Fig. 6E) as the concentration of N55 increased from 0.8 to 77 μm. The effect of N55 became saturated as it reached a concentration of 7.7 μm (Fig. 12E). These analyses indicate that N55 dose-dependently and saturably increased susceptibility of GLP-1(7–36)-amide to trypsin inactivation (Fig. 12F), with an EC50 of 2 μm. These findings suggest that a conformational transition in the GLP-1(7–36)-amide peptide occurred upon binding N55.
FIGURE 12.
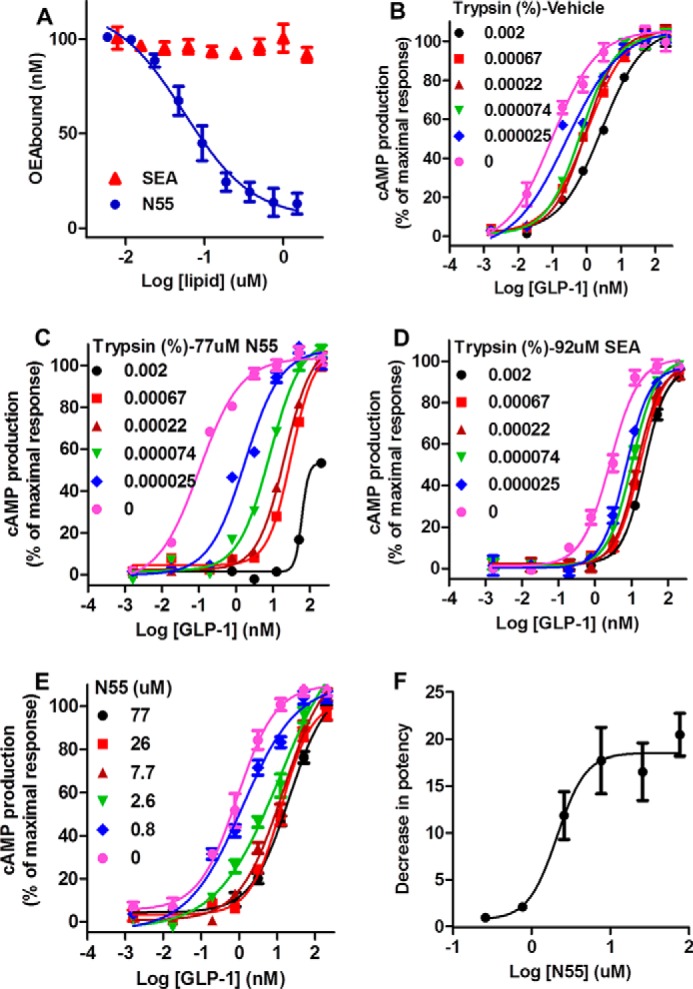
N55 binds and facilitates inactivation of GLP-1(7–36)-amide by trypsin. A, competition of increasing concentrations of SEA or N55 for the binding of 0.2 μm [3H]OEA to 0.2 μm His-tagged GLP-1. Binding reactions, separation of His-tagged GLP-1(7–36)-bound [3H]OEA, and free [3H]OEA quantitation of specific bound [3H]OEA were described under “Experimental Procedures.” B–D, cAMP production responses to titrations of residual activities of GLP-1(7–36) after treatment with the indicated concentrations of trypsin in the presence of vehicle (B), 77 μm N55 (C), or 92 μm SEA (D). E, responses of cAMP production to titrations of GLP-1(7–36)-amide after treated with 0.00067% trypsin in the presence of indicated concentrations of N55. F, N55 dose-dependently and saturably facilitates inactivation of GLP-1(7–36)-amide by 0.00067% trypsin. Decrease in potency was defined by (EC50 of GLP-1 trypsinized in the presence of the indicated concentration of N55)/(EC50 of GLP-1 trypsinized in the absence of N55). Except for D, cAMP responses were assayed in the presence of 9.2 μm SEA; all other cAMP production assays were carried in the presence of 7.7 μm N55, and all data are mean ± S.E. of triplicates from three independent assays.
FIGURE 13.
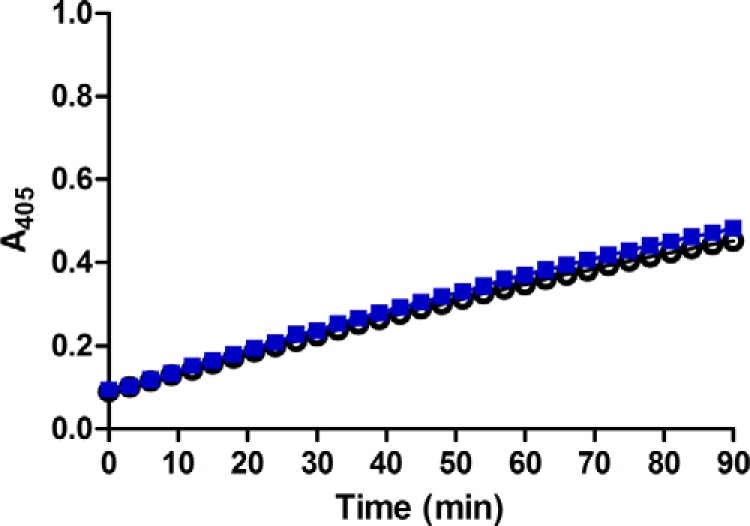
Trypsin cleavage activity is not affected by N55. To examine whether the presence of N55 affects trypsin cleavage activity, we used trypsin activity colorimetric test (BioVision). Briefly, trypsin activity was assayed with and without 77 μm N55; 2 μl of trypsin substrate was added to a well in a 96-well plate containing 48 μl of 0.000125% trypsin in the presence (blue squares) or absence (open circles) of 77 μm of N55. Reactions were conducted at room temperature, and the extent of cleavage was monitored by real time reading at A405.
Discussion
Fenugreek seeds have been used as a treatment for diabetes and have been found to lower blood glucose levels in human trials (20, 32–34). We report the isolation and characterization of a new structure from fenugreek seeds. N55 binds to GLP-1 and enhances the potency of GLP-1 in stimulating GLP-1R signaling. This finding is consistent with research targeting GLP-1R signaling in the treatment of diabetes. Using agonist-induced receptor endocytosis and real time measurement of intracellular cAMP production, we purified and isolated N55 from fenugreek seeds. It is noted that although some fractions from silica gel chromatography did not potentiate cAMP production, they were still able to enhance receptor endocytosis (Fig. 4, A and B). Because cAMP is essential and sufficient for pancreatic β-cell secretion of insulin (29), we combined fractions with enhancing effects on cAMP production for further purification. As shown in Fig. 5, most of the fractions at this step of isolation enhanced GLP-1-induced cAMP production, although fraction N55 is of high recovery and significantly pure.
The effect of N55 on GLP-1R signaling is specific to the GLP-1(7–36)-amide. It does not enhance signaling by the GLP-1 analog Ex-4 (Fig. 7D) or the other incretin GIP (Fig. 7E). N55 does not activate GLP-1R by itself, as its effect is highly dependent upon the presence of GLP-1(7–36)-amide (Fig. 7A). N55 enhanced the potency of GLP-1 stimulation of the cAMP response mediated by GLP-1R signaling, and this augmentation is eliminated when GLP-1R signaling in RINm5F cells is antagonized by Ex-9 (Fig. 7C).
There are two possible mechanisms that may explain the effect of N55 on GLP-1R signaling. N55 can either act upon GLP-1R or on GLP-1(7–36)-amide. At least three lines of evidence favor the interpretation that N55 interacts with GLP-1(7–36)-amide. First, N55 selectively enhanced the potency of GLP-1(7–36)-amide but not that of Ex-4 (Fig. 7, A and D). GLP-1 and exendin 4 share 50% sequence identity but have distinct secondary structure, order, and stability characteristics (30, 35). Second, N55, but not SEA (19), binds GLP-1 in a dose-dependent manner (Fig. 12A). Finally, N55 specifically enhanced susceptibility of the peptide to cleavage by trypsin (Fig. 12, C and E), although SEA (19) did not (Fig. 12D). These are consistent with previous findings that only specific signaling enhancing lipids bind GLP-1, while also enhancing its susceptibility to trypsin digestion (19). These observations are consistent to the model that GLP-1 can bind to specific lipids to form a complex with enhanced potency in stimulating GLP-1R signaling. Covalent linking of a lipid molecule to peptide hormones (lipidation) is commonly used as a chemical tool to optimize the pharmacokinetic properties of peptide drugs (36). Moreover, lipidation may stabilize a structure of the peptide hormone, leading to broadening its spectrum of activity (37). Most of the lipidations of GLP-1 have no discernible effects on GLP-1R signaling, with a few exceptions, which enhanced the potency of GLP-1 by 6–7-fold (38). In contrast to covalent linking, our studies show that non-covalent binding of N55 to GLP-1 also stabilized a peptide structure displaying a 40-fold enhancement in potency to stimulate cAMP production.
The postulated mechanism by which N55 enhances GLP-1R signaling is different from that of allosteric modulators isolated in the past (39–42). All previously isolated GLP-1R modulators exert their effects by binding to allosteric sites on the receptor and display ago-allosteric modulation. These allosteric modulators display both allosteric agonism and an ability to allosterically modulate the binding, specificity, and/or function of the GLP-1 ligand. This effect may be due to the allosteric modulator causing a redistribution of conformationally linked receptor states, which can include signaling species. In contrast, N55 had a pharmacological profile distinct from that of GLP-1 modulators identified in the past; N55 does not display agonism or altered receptor specificity in the absence of GLP-1 ligand.
Fenugreek has been used for the treatment of diabetes in many parts of the world, particularly in China, Egypt, India, and Middle Eastern countries (43, 44). In humans, fenugreek seeds acutely reduce post-prandial glucose and insulin levels (32). Several longer term clinical trials have also shown that administration of fenugreek seeds reduces fasting and post-prandial glucose levels and decreases glycated hemoglobin (33). Soluble fiber (45, 46), saponins (47), trigonelline (48), diosgenin (49), and 4-hydroxyisoleucine (50) from fenugreek seeds have been suggested to mediate its hypoglycemic effect (33). The exact molecular targets and mechanisms remain unknown; however, N55 from fenugreek may potentially play a role in ameliorating glucose excursion in diabetes. In addition to hypoglycemic effect, extract of fenugreek seed also displays neuroprotective properties (21) and anti-inflammatory effects (22, 23) in disease animal models. These mechanisms of effects are consistent with the current trials of GLP-1 analogs in treatment of psoriasis (5) and Parkinson disease (2).
Current GLP-1 analog therapies maintain constant high levels of GLP-1 activity, leading to constitutive activation of GLP-1R and loss of spatiotemporal regulation of GLP-1R activity. Positive modulation of GLP-1R signaling may offer the opportunity to augment and/or fine-tune endogenous GLP-1 action. Enhancers of GLP-1 potency modulate GLP-1R signaling according to endogenous levels of GLP-1. They do not themselves activate the receptor, but serve only to augment the potency of circulating GLP-1. This property may be of particular importance for brain GLP-1R-expressing neurons, where activation of the receptor is regulated by local GLP-1-secreting fibers.
Deterioration in GLP-1 signaling has been associated with type 2 diabetes (13). Such patients have impaired incretin function, despite having normal or only mildly reduced GLP-1 secretion, as measured by oral glucose or meal tests (13, 14). Clinically, administration of a GLP-1 analog has been successful in ameliorating the effects of reduced GLP-1 signaling in type 2 diabetes (6, 7). Although the GLP-1 analog therapies may lead to loss of spatiotemporal regulation of most of GLP-1Rs, similar therapeutic benefits can be achieved with modulators of GLP-1 potency. Furthermore, because of its clean modulation without intrinsic agonist activity, the potential adverse effects are minimized. This mode of action permits control over the intensity of activation based on endogenous levels of GLP-1 and could potentially restore GLP-1 signaling function in a manner more consistent with physiological demands. As cAMP is sufficient for glucose-dependent insulin release (29), future studies may investigate whether compounds that enhance GLP-1-induced cAMP production represent a new class of therapeutic agents for the treatment of type 2 diabetes or other GLP-1 signaling-related disorders. To this end, examination of in vivo effects of N55 is necessary. Other studies may also investigate the viability of nutrient derivatives from edible plants in treating or preventing type 2 diabetes or other GLP-1 signaling-related conditions.
In summary, we identified a new compound from fenugreek seeds with potential clinical application in the treatment of type 2 diabetes and other GLP-1 signaling-related disorders. N55 binds to GLP-1(7–36)-amide, enhances the potency in stimulating the cAMP pathway. This mechanism is distinct from that of classical GLP-1R-signaling agents, which directly act on the target receptor orthosterically or allosterically. N55 thus represents a new class of compounds that enhance GLP-1R signaling. Our results also suggest that GLP-1 might be a novel target for drug discovery in type 2 diabetes and other conditions. The postulated mechanism of N55 action also points to the possibility of modulating GPCR activity through modification of the potency of its cognate ligands. The approach described here is applicable to many other plant compound discovery efforts related to other GPCRs and their respective ligands.
Author Contributions
R.-J. C. designed the synthetic plan and synthesized and assigned the structure of N55. K. K. set up the signaling assay platforms, isolated N55, and designed biological and pharmacological characterization of N55. Y.-H. C. performed the cAMP BRET assays, and ligand binding assays. N.-P. L. implemented synthetic experiments and spectrometry analysis. Receptor endocytosis assays were done by G.-H. C. Y.-H. C. and K. K. set up the cAMP assay platform. R.-J. C. and K. K. wrote the paper.
Supplementary Material
Acknowledgments
We thank Dr. Mei-Shang Ho, Dr. Lee-Young Chau, and Dr. Chi-Huy Wong for constructive discussions.
This work was supported by Academia Sinica, Taiwan. R.-J. C. and K. K. have filed a patent application covering chemical compositions and applications for developing N55 analogs.

This article contains supplemental Figs. S1–S3 and Table S1.
- GLP-1R
- glucagon-like peptide-1 receptor
- GPCR
- G protein-coupled receptor
- BRET
- bioluminescence resonance energy transfer
- GIP
- gastric inhibitory polypeptide
- OEA
- oleoyl ethanolamide
- SEA
- stearoyl ethanolamide
- Ex-9
- exendin 9
- Ex-4
- exendin 4
- EA
- ethyl acetate
- Hx
- hexane
- FE
- fenugreek.
References
- 1.Campbell J. E., and Drucker D. J. (2013) Pharmacology, physiology, and mechanisms of incretin hormone action. Cell Metab. 17, 819–837 [DOI] [PubMed] [Google Scholar]
- 2.Aviles-Olmos I., Dickson J., Kefalopoulou Z., Djamshidian A., Kahan J., Ell P., Whitton P., Wyse R., Isaacs T., Lees A., Limousin P., and Foltynie T. (2014) Motor and cognitive advantages persist 12 months after exenatide exposure in Parkinson's disease. J. Parkinsons Dis. 4, 337–344 [DOI] [PubMed] [Google Scholar]
- 3.Hölscher C. (2014) Central effects of GLP-1: new opportunities for treatments of neurodegenerative diseases. J. Endocrinol. 221, T31–T41 [DOI] [PubMed] [Google Scholar]
- 4.Lønborg J., Kelbæk H., Vejlstrup N., Bøtker H. E., Kim W. Y., Holmvang L., Jørgensen E., Helqvist S., Saunamäki K., Terkelsen C. J., Schoos M. M., Køber L., Clemmensen P., Treiman M., and Engstrøm T. (2012) Exenatide reduces final infarct size in patients with ST-segment-elevation myocardial infarction and short-duration of ischemia. Circ. Cardiovasc. Interv. 5, 288–295 [DOI] [PubMed] [Google Scholar]
- 5.Muscogiuri G., Cignarelli A., Giorgino F., Prodram F., Santi D., Tirabassi G., Balercia G., Modica R., Faggiano A., and Colao A. (2014) GLP-1: benefits beyond pancreas. J. Endocrinol. Invest. 37, 1143–1153 [DOI] [PubMed] [Google Scholar]
- 6.Drucker D. J., Buse J. B., Taylor K., Kendall D. M., Trautmann M., Zhuang D., Porter L., and DURATION-1 Study Group. (2008) Exenatide once weekly versus twice daily for the treatment of type 2 diabetes: a randomised, open-label, non-inferiority study. Lancet 372, 1240–1250 [DOI] [PubMed] [Google Scholar]
- 7.Nauck M. A. (2011) Incretin-based therapies for type 2 diabetes mellitus: properties, functions, and clinical implications. Am. J. Med. 124, S3–S18 [DOI] [PubMed] [Google Scholar]
- 8.Drucker D. J. (2006) The biology of incretin hormones. Cell Metab. 3, 153–165 [DOI] [PubMed] [Google Scholar]
- 9.Meier J. J. (2012) GLP-1 receptor agonists for individualized treatment of type 2 diabetes mellitus. Nat. Rev. Endocrinol. 8, 728–742 [DOI] [PubMed] [Google Scholar]
- 10.Meier J. J., Nauck M. A., Kranz D., Holst J. J., Deacon C. F., Gaeckler D., Schmidt W. E., and Gallwitz B. (2004) Secretion, degradation, and elimination of glucagon-like peptide 1 and gastric inhibitory polypeptide in patients with chronic renal insufficiency and healthy control subjects. Diabetes 53, 654–662 [DOI] [PubMed] [Google Scholar]
- 11.Gu G., Roland B., Tomaselli K., Dolman C. S., Lowe C., and Heilig J. S. (2013) Glucagon-like peptide-1 in the rat brain: distribution of expression and functional implication. J. Comp. Neurol. 521, 2235–2261 [DOI] [PubMed] [Google Scholar]
- 12.Nauck M. A., Vardarli I., Deacon C. F., Holst J. J., and Meier J. J. (2011) Secretion of glucagon-like peptide-1 (GLP-1) in type 2 diabetes: what is up, what is down? Diabetologia 54, 10–18 [DOI] [PubMed] [Google Scholar]
- 13.Calanna S., Christensen M., Holst J. J., Laferrère B., Gluud L. L., Vilsbøll T., and Knop F. K. (2013) Secretion of glucagon-like peptide-1 in patients with type 2 diabetes mellitus: systematic review and meta-analyses of clinical studies. Diabetologia 56, 965–972 [DOI] [PMC free article] [PubMed] [Google Scholar]
- 14.Færch K., Torekov S. S., Vistisen D., Johansen N. B., Witte D. R., Jonsson A., Pedersen O., Hansen T., Lauritzen T., Sandbæk A., Holst J. J., and Jørgensen M. E. (2015) GLP-1 response to oral glucose is reduced in prediabetes, screen-detected type 2 diabetes, and obesity and influenced by sex: The ADDITION-PRO Study. Diabetes 64, 2513–2525 [DOI] [PubMed] [Google Scholar]
- 15.Lovshin J. A., and Drucker D. J. (2009) Incretin-based therapies for type 2 diabetes mellitus. Nat. Rev. Endocrinol. 5, 262–269 [DOI] [PubMed] [Google Scholar]
- 16.Butler P. C., Elashoff M., Elashoff R., and Gale E. A. (2013) A critical analysis of the clinical use of incretin-based therapies: Are the GLP-1 therapies safe? Diabetes Care 36, 2118–2125 [DOI] [PMC free article] [PubMed] [Google Scholar]
- 17.Pierce K. L., and Lefkowitz R. J. (2001) Classical and new roles of β-arrestins in the regulation of G-protein-coupled receptors. Nat. Rev. Neurosci. 2, 727–733 [DOI] [PubMed] [Google Scholar]
- 18.Widmann C., Bürki E., Dolci W., and Thorens B. (1994) Signal transduction by the cloned glucagon-like peptide-1 receptor: comparison with signaling by the endogenous receptors of beta cell lines. Mol. Pharmacol. 45, 1029–1035 [PubMed] [Google Scholar]
- 19.Cheng Y. H., Ho M. S., Huang W. T., Chou Y. T., and King K. (2015) Modulation of glucagon-like peptide-1 (GLP-1) potency by endocannabinoid-like lipids represents a novel mode of regulating GLP-1 receptor signaling. J. Biol. Chem. 290, 14302–14313 [DOI] [PMC free article] [PubMed] [Google Scholar]
- 20.Haber S. L., and Keonavong J. (2013) Fenugreek use in patients with diabetes mellitus. Am. J. Health Syst. Pharm. 70, 1196. [DOI] [PubMed] [Google Scholar]
- 21.Belaïd-Nouira Y., Bakhta H., Samoud S., Trimech M., Haouas Z., and Ben Cheikh H. (2013) A novel insight on chronic AlCl3 neurotoxicity through IL-6 and GFAP expressions: modulating effect of functional food fenugreek seeds. Nutr. Neurosci. 16, 218–224 [DOI] [PubMed] [Google Scholar]
- 22.Al-Okbi S. Y. (2014) Nutraceuticals of anti-inflammatory activity as complementary therapy for rheumatoid arthritis. Toxicol. Ind. Health 30, 738–749 [DOI] [PubMed] [Google Scholar]
- 23.Bae M. J., Shin H. S., Choi D. W., and Shon D. H. (2012) Antiallergic effect of Trigonella foenum-graecum L. extracts on allergic skin inflammation induced by trimellitic anhydride in BALB/c mice. J. Ethnopharmacol. 144, 514–522 [DOI] [PubMed] [Google Scholar]
- 24.Oakley R. H., Laporte S. A., Holt J. A., Barak L. S., and Caron M. G. (1999) Association of β-arrestin with G protein-coupled receptors during clathrin-mediated endocytosis dictates the profile of receptor resensitization. J. Biol. Chem. 274, 32248–32257 [DOI] [PubMed] [Google Scholar]
- 25.Hudson C. C., Oakley R. H., Sjaastad M. D., and Loomis C. R. (2006) High-content screening of known G protein-coupled receptors by arrestin translocation. Methods Enzymol. 414, 63–78 [DOI] [PubMed] [Google Scholar]
- 26.Córdova A., Notz W., Zhong G., Betancort J. M., and Barbas C. F. 3rd (2002) A highly enantioselective amino acid-catalyzed route to functionalized α-amino acids. J. Am. Chem. Soc. 124, 1842–1843 [DOI] [PubMed] [Google Scholar]
- 27.Gallwitz B., Witt M., Fölsch U. R., Creutzfeldt W., and Schmidt W. E. (1993) Binding specificity and signal transduction of receptors for glucagon-like peptide-1(7–36)amide and gastric inhibitory polypeptide on RINm5F insulinoma cells. J. Mol. Endocrinol. 10, 259–268 [DOI] [PubMed] [Google Scholar]
- 28.Göke R., Göke B., Richter G., and Arnold R. (1988) The entero-insular axis: the new incretin candidate glucagon-like peptide-1(7–36)amide (GLP-1(7–36))amide. Z. Gastroenterol. 26, 715–719 [PubMed] [Google Scholar]
- 29.Fu Z., Gilbert E. R., and Liu D. (2013) Regulation of insulin synthesis and secretion and pancreatic beta-cell dysfunction in diabetes. Curr. Diabetes Rev. 9, 25–53 [PMC free article] [PubMed] [Google Scholar]
- 30.Andersen N. H., Brodsky Y., Neidigh J. W., and Prickett K. S. (2002) Medium-dependence of the secondary structure of exendin-4 and glucagon-like-peptide-1. Bioorg. Med. Chem. 10, 79–85 [DOI] [PubMed] [Google Scholar]
- 31.Gefel D., Hendrick G. K., Mojsov S., Habener J., and Weir G. C. (1990) Glucagon-like peptide-I analogs: effects on insulin secretion and adenosine 3′,5′-monophosphate formation. Endocrinology 126, 2164–2168 [DOI] [PubMed] [Google Scholar]
- 32.Sharma R. D. (1986) Effect of fenugreek seeds and leaves on blood glucose and serum insulin responses in human subjects. Nutr. Res. 6, 1353–1364 [Google Scholar]
- 33.Neelakantan N., Narayanan M., de Souza R. J., and van Dam R. M. (2014) Effect of fenugreek (Trigonella foenum-graecum L.) intake on glycemia: a meta-analysis of clinical trials. Nutr. J. 13, 7. [DOI] [PMC free article] [PubMed] [Google Scholar]
- 34.Madar Z., Abel R., Samish S., and Arad J. (1988) Glucose-lowering effect of fenugreek in non-insulin dependent diabetics. Eur. J. Clin. Nutr. 42, 51–54 [PubMed] [Google Scholar]
- 35.Runge S., Schimmer S., Oschmann J., Schiødt C. B., Knudsen S. M., Jeppesen C. B., Madsen K., Lau J., Thøgersen H., and Rudolph R. (2007) Differential structural properties of GLP-1 and exendin-4 determine their relative affinity for the GLP-1 receptor N-terminal extracellular domain. Biochemistry 46, 5830–5840 [DOI] [PubMed] [Google Scholar]
- 36.Zhang L., and Bulaj G. (2012) Converting peptides into drug leads by lipidation. Curr. Med. Chem. 19, 1602–1618 [DOI] [PubMed] [Google Scholar]
- 37.Ward B. P., Ottaway N. L., Perez-Tilve D., Ma D., Gelfanov V. M., Tschöp M. H., and Dimarchi R. D. (2013) Peptide lipidation stabilizes structure to enhance biological function. Mol. Metab. 2, 468–479 [DOI] [PMC free article] [PubMed] [Google Scholar]
- 38.Madsen K., Knudsen L. B., Agersoe H., Nielsen P. F., Thøgersen H., Wilken M., and Johansen N. L. (2007) Structure-activity and protraction relationship of long-acting glucagon-like peptide-1 derivatives: importance of fatty acid length, polarity, and bulkiness. J. Med. Chem. 50, 6126–6132 [DOI] [PubMed] [Google Scholar]
- 39.Koole C., Wootten D., Simms J., Valant C., Sridhar R., Woodman O. L., Miller L. J., Summers R. J., Christopoulos A., and Sexton P. M. (2010) Allosteric ligands of the glucagon-like peptide 1 receptor (GLP-1R) differentially modulate endogenous and exogenous peptide responses in a pathway-selective manner: implications for drug screening. Mol. Pharmacol. 78, 456–465 [DOI] [PMC free article] [PubMed] [Google Scholar]
- 40.Sloop K. W., Willard F. S., Brenner M. B., Ficorilli J., Valasek K., Showalter A. D., Farb T. B., Cao J. X., Cox A. L., Michael M. D., Gutierrez Sanfeliciano S. M., Tebbe M. J., and Coghlan M. J. (2010) Novel small molecule glucagon-like peptide-1 receptor agonist stimulates insulin secretion in rodents and from human islets. Diabetes 59, 3099–3107 [DOI] [PMC free article] [PubMed] [Google Scholar]
- 41.Nolte W. M., Fortin J. P., Stevens B. D., Aspnes G. E., Griffith D. A., Hoth L. R., Ruggeri R. B., Mathiowetz A. M., Limberakis C., Hepworth D., and Carpino P. A. (2014) A potentiator of orthosteric ligand activity at GLP-1R acts via covalent modification. Nat. Chem. Biol. 10, 629–631 [DOI] [PubMed] [Google Scholar]
- 42.Knudsen L. B., Kiel D., Teng M., Behrens C., Bhumralkar D., Kodra J. T., Holst J. J., Jeppesen C. B., Johnson M. D., de Jong J. C., Jorgensen A. S., Kercher T., Kostrowicki J., Madsen P., Olesen P. H., et al. (2007) Small-molecule agonists for the glucagon-like peptide 1 receptor. Proc. Natl. Acad. Sci. U.S.A. 104, 937–942 [DOI] [PMC free article] [PubMed] [Google Scholar]
- 43.Wang E., and Wylie-Rosett J. (2008) Review of selected Chinese herbal medicines in the treatment of type 2 diabetes. Diabetes Educ. 34, 645–654 [DOI] [PubMed] [Google Scholar]
- 44.Roberts K. T. (2011) The potential of fenugreek (Trigonella foenum-graecum) as a functional food and nutraceutical and its effects on glycemia and lipidemia. J. Med. Food 14, 1485–1489 [DOI] [PubMed] [Google Scholar]
- 45.Mathern J. R., Raatz S. K., Thomas W., and Slavin J. L. (2009) Effect of fenugreek fiber on satiety, blood glucose and insulin response and energy intake in obese subjects. Phytother. Res. 23, 1543–1548 [DOI] [PubMed] [Google Scholar]
- 46.Hannan J. M., Ali L., Rokeya B., Khaleque J., Akhter M., Flatt P. R., and Abdel-Wahab Y. H. (2007) Soluble dietary fibre fraction of Trigonella foenum-graecum (fenugreek) seed improves glucose homeostasis in animal models of type 1 and type 2 diabetes by delaying carbohydrate digestion and absorption, and enhancing insulin action. Br. J. Nutr. 97, 514–521 [DOI] [PubMed] [Google Scholar]
- 47.Lu F. R., Shen L., Qin Y., Gao L., Li H., and Dai Y. (2008) Clinical observation on trigonella foenum-graecum L. total saponins in combination with sulfonylureas in the treatment of type 2 diabetes mellitus. Chin. J. Integr. Med. 14, 56–60 [DOI] [PubMed] [Google Scholar]
- 48.Zhou J., Chan L., and Zhou S. (2012) Trigonelline: a plant alkaloid with therapeutic potential for diabetes and central nervous system disease. Curr. Med. Chem. 19, 3523–3531 [DOI] [PubMed] [Google Scholar]
- 49.Uemura T., Hirai S., Mizoguchi N., Goto T., Lee J. Y., Taketani K., Nakano Y., Shono J., Hoshino S., Tsuge N., Narukami T., Takahashi N., and Kawada T. (2010) Diosgenin present in fenugreek improves glucose metabolism by promoting adipocyte differentiation and inhibiting inflammation in adipose tissues. Mol. Nutr. Food Res. 54, 1596–1608 [DOI] [PubMed] [Google Scholar]
- 50.Sauvaire Y., Petit P., Broca C., Manteghetti M., Baissac Y., Fernandez-Alvarez J., Gross R., Roye M., Leconte A., Gomis R., and Ribes G. (1998) 4-Hydroxyisoleucine: a novel amino acid potentiator of insulin secretion. Diabetes 47, 206–210 [DOI] [PubMed] [Google Scholar]
Associated Data
This section collects any data citations, data availability statements, or supplementary materials included in this article.


