

Background: DNA photoproduct deamination contributes to mutations.
Results: Cyclobutane pyrimidine dimers (CPDs) deaminate fastest at TCG sites, and the rate depends on the position of the CPD in a nucleosome determined from hydroxyl radical footprinting.
Conclusion: Deamination could explain the high C to T mutation rate at TCG sites, which can be further modulated by nucleosomes.
Significance: Sequence context and chromatin structure can modulate UV mutagenesis.
Keywords: 5-methylcytosine, chromatin structure, DNA damage, histone, mutagenesis mechanism, nucleosome, photobiology
Abstract
Sunlight-induced C to T mutation hot spots in skin cancers occur primarily at methylated CpG sites that coincide with sites of UV-induced cyclobutane pyrimidine dimer (CPD) formation. The C and 5-methyl-C in CPDs are not stable and deaminate to U and T, respectively, which leads to the insertion of A by the DNA damage bypass polymerase η, thereby defining a probable mechanism for the origin of UV-induced C to T mutations. Deamination rates for TmCG CPDs have been found to vary 12-fold with rotational position in a nucleosome in vitro. To determine the influence of nucleosome structure on deamination rates in vivo, we determined the deamination rates of CPDs at TCG sites in a stably positioned nucleosome within the FOS promoter in HeLa cells. A procedure for in vivo hydroxyl radical footprinting with Fe-EDTA was developed, and, together with results from a cytosine methylation protection assay, we determined the translational and rotational positions of the TCG sites. Consistent with the in vitro observations, deamination was slower for one CPD located at an intermediate rotational position compared with two other sites located at outside positions, and all were much faster than for CPDs at non-TCG sites. Photoproduct formation was also highly suppressed at one site, possibly due to its interaction with a histone tail. Thus, it was shown that CPDs of TCG sites deaminate the fastest in vivo and that nucleosomes can modulate both their formation and deamination, which could contribute to the UV mutation hot spots and cold spots.
Introduction
The major pathway for UV-induced T to C and CC to TT signature mutations at dipyrimidine sites involves error-free synthesis by polymerase η opposite cyclobutane pyrimidine dimers (CPDs)2 where the cytosines or 5-methylcytosines have deaminated to uracil or thymidine (Fig. 1A) (1–5). Because C-containing CPDs must deaminate to become mutagenic by the polymerase η pathway, factors that accelerate deamination are also expected to enhance C to T mutation frequency. Although much is known about the deamination of CPDs in vitro and in vivo (2, 5–13), nothing is known about the effect of chromatin structure on their deamination in vivo and how this may relate to UV mutation hot spots and cold spots. Nucleosomes are the main structural component of chromatin and are composed of about 147 base pairs of DNA wrapped 1.65 times around a histone core (14–16). Nucleosomes have been shown to enhance CPD formation at rotational sites furthest away from the histone surface, which was suggested to be due to the greater mobility of the bases at these sites (17, 18).
FIGURE 1.

Photobiology of TC CPDs and their detection in FOS DNA. A, formation and deamination of methylated and unmethylated TC CPDs that result in C to T mutations. B, the bottom strand of the FOS promoter with the five TCG sites underlined in boldface type and their position given relative to the transcription start site. Various known and unknown protein binding sites are also underlined. C, enzymatic steps used in the LMPCR assay to determine the deamination rates of TC CPDs.
In a recent study, we determined the deamination rates for TmCG CPDs at 10 consecutive rotational positions in a nucleosome at the dyad and found a 12-fold difference in rates (19). The maximum rate was with the phosphodiester backbone of the C at the outermost position, and the slowest was with the C at the innermost position. Because the rates of photoproduct deamination correlated with the rates of photoproduct formation, we proposed that deamination was also modulated by DNA mobility. Whereas the rates of photoproduct formation and deamination paralleled each other, the range of deamination rates was about 4-fold greater than for photoproduct formation, suggesting that deamination may play a greater role in mutagenesis. Previously, we had shown that a 3′-flanking G in a TC CPD greatly increases the deamination rate in free DNA compared with a 3′-flanking A and that the carbonyl group of the G was involved in enhancing the rate (13). A 3′-flanking G was also found to accelerate deamination in a nucleosome and was more effective at the outside position, presumably due to the greater mobility of the DNA at this position. Indeed, in vivo, UVB signature mutations in a lacZ transgene in a mouse have been found to greatly prefer TCG sites over CCG sites and to depend on polymerase η (20).
The present study represents the first attempt to correlate deamination rates of C-containing CPDs with specific rotational and translational positions in nucleosomes in vivo. Our previous in vitro studies were limited to a full turn at the dyad, but protein-DNA interactions at other positions in the nucleosome might also affect both photoproduct formation and deamination. The histone surfaces and tails make numerous contacts with the DNA that could either enhance or diminish an intrinsic rotational effect. In addition, chromatin may also contain histone H1 that might affect photoproduct formation and deamination at the dyad and the linkers. H1 has been found to suppress hydroxyl radical cleavage of a 10-bp region at the dyad of a nucleosome in vitro as well as extend the characteristic 10-base repeat in the cleavage pattern up to 30 bp beyond the edge of the nucleosome core into the linker DNA (21).
Studying the effect of chromatin structure on deamination in vivo is made difficult because only 0.3% of nucleosomes are thought to be very strongly positioned, whereas only 8.4% have moderately strong positioning, and 81% are weakly positioned (22). One of the better characterized of the strongly positioned nucleosomes is located on the FOS promoter and has been shown to exist largely in one rotational and translational position (23, 24). The nucleosome has been determined to reside between 250 and 90 bases upstream from the transcription start site by MNase digestion (23). The rotational setting of the nucleosome was established by ligation-mediated PCR (LMPCR) analysis of x-ray-induced hydroxyl radical footprints, as well as by DNase I, in the human diploid fibroblast-like cell line, TIG-3 (24). The lower strand of the nucleosome-bound DNA has five TCG sites at different translational and rotational positions, making it useful for our studies (Fig. 1B).
To determine the rotational positioning of the DNA within the FOS promoter nucleosome in HeLa cells, we developed a procedure for in situ hydroxyl radical footprinting in human cells with standard Fe-EDTA footprinting reagents coupled with LMPCR. In addition to confirming that the rotational positioning was the same as in the TIG-3 cells, we were also able to identify a 12-base region of suppressed cleavage centered 173 bases upstream from the transcription start site. We attribute this suppression to H1 interactions at the dyad based on similar observations made with an in vitro system (21). With the central dyad position identified, we were able to assign both translational and rotational positions to the five TCG sites. Deamination rates were determined by an enzymatic LMPCR assay system that quantifies T or U/G mismatches caused by the deamination reaction (Fig. 1C) (10, 11). Deamination was slower at one site located 73 bases upstream from the dyad center at an intermediate rotational position than at sites located 13 and 24 bases upstream from the dyad at the outermost rotational positions. These results are consistent with what would be predicted based on our previous in vitro study of the effect of rotational position on deamination rate (19). Photoproduct formation was also found to be highly suppressed at an intermediate rotational position 47 bases upstream from the dyad that would be in close proximity to two histone tails, which have been shown to interact with the nucleosome DNA in a crystal structure (25).
Experimental Procedures
Enzymes
Photolyase from Vibrio cholerae (VcPhr) was expressed from plasmid punc2001 as a maltose fusion protein from unc-525 cells as described (26). Fractions containing photolyase from the amylose column were further purified to remove DNA nuclease activity by diluting 10-fold in 1 mm dithiothreitol (DTT), 10 mm Tris-HCl, pH 7.3, and chromatographed on a Q-Sepharose column. The column was washed with 20 ml of 50 mm NaCl, 5 mm DTT, and 10 mm Tris-HCl, pH 7.5, and photolyase was eluted with 300 mm NaCl, 5 mm DTT, and 10 mm Tris-HCl, pH 7.5 (10 ml) and then dialyzed against the same high salt elution buffer containing 50% glycerin. The enzyme (1.4 mg/ml) was stored in aliquots at −80 °C. T4 endonuclease V was expressed as a His6-tagged fusion protein from pET-22b vector in Escherichia coli strain BL21(DE3)plysS as described (27). The enzyme was dialyzed against 0.3 m NaCl, 50% glycerin, 20 mm Tris-HCl, pH 7.5, and 5 mm EDTA and was stored in 0.2 mg/ml aliquots at −80 °C. Human thymine DNA glycosylase was expressed as a His6-tagged fusion protein from a pET-28 vector in E. coli BL21(DE3) as described (28). The protein was then diluted and purified by Q Sepharose as described for photolyase to remove DNase activity. The first 15 ml of eluate were collected and concentrated by dialysis against 0.3 m NaCl, 20 mm Tris-HCl, pH 7.5, 5 mm EDTA, and 2 mm DTT in 50% glycerin. The final concentration of enzyme was 0.6 mg/ml. Uracil glycosylase, Vent polymerase, HpaII, MspI, and M.CviPI were from New England Biolabs; T4 polynucleotide kinase was from Fermentas; and T4 ligase was from Promega.
Cell Culture and Genomic DNA Isolation
HeLa cells were grown on 10-cm tissue culture plates to 80% confluence in Dulbecco's modified Eagle's medium (DMEM) with 10% fetal calf serum. Cells were collected by scraping before centrifugation. Cell pellets were taken up in 0.9 ml of buffer (0.3 m NaCl, 10 mm EDTA, and 10 mm Tris-HCl, pH 8.3) before lysis with the addition of SDS to 1%. Proteinase K (50 μg) was added to the cell lysates and incubated for 30 min at 37 °C before 25:24:1 phenol/chloroform/isoamyl alcohol (PCI) extraction and ethanol precipitation. Each pellet corresponding to one cell culture plate was resuspended in 400 μl of 50 mm NaCl, and the DNA was further purified with the Qiagen PCR cleanup kit and then ethanol-precipitated with 0.3 m sodium acetate and 100 μg of glycogen. The pellet was then resuspended in 50 mm NaCl before storage at −80 °C.
Hydroxyl Radical Footprinting
Cells were grown to 80% confluence and then washed three times with 10 ml of PBS before adding 10 ml of 0.05% lysolecithin in 150 mm sucrose, 80 mm KCl, 5 mm K2HPO4, 5 mm MgCl2, 0.5 mm CaCl2, and 35 mm NaHepes buffer, pH 7.4, to render cell membranes permeable for subsequent reagents. After a 60-s incubation at room temperature, the lysolecithin solution was decanted before adding the hydroxyl radical footprinting solution. The footprinting solution was prepared immediately before use by adding 1 ml of freshly made 50× stock solution (2.5 m sodium ascorbate and 500 mm EDTA plus 250 mm Fe(NH4)2(SO4)2·6H2O) to 50 ml of DMEM followed by 1 ml of 30% H2O2 and rapidly mixing for about 5 s before adding ∼10 ml onto the plate followed by gentle swirling before letting it stand for 15 min at room temperature. The reagents were then decanted, and the cells were washed twice with 10 ml of PBS containing thiourea (0.76 g/100 ml) before scraping and centrifugation. The pellet was resuspended in 300 μl of 100 mm NaCl, 20 mm EDTA, and 20 mm Tris-HCl, pH 8, and then 33 μl of 10% SDS was added for cell lysis. Proteinase K (100 μg, 10 mg/ml) was then added, and the reaction mix was incubated at 37 °C for 30 min. This was followed by three PCI extractions and three ethanol precipitations with sodium acetate and 100 μg of glycogen. The pellet was taken up in 100 μl of 0.3 m NaOH and incubated for 30 min at 37 °C. This reaction was neutralized by the addition of 20 μl of 0.5 m Mes buffer, pH 6, and 2.5 μl of 12 n HCl (final pH ∼6). This was followed by two PCI extractions and three ethanol precipitations. The pellet was resuspended in 100 μl of water and quantified by its absorbance at 260 nm.
LMPCR
LMPCR was carried out according to general procedures (29) using the following primers and linkers for amplification starting at −195: P1, CACGGCCTTTCCCTGTAGC (−281 to −262, blunt-end synthesis); P2, GGCCCACGAGACCTCTGAGACAG (−224 to −202, PCR); P3, GGCCCACGAGACCTCTGAGACAGGAACTG (−224 to −196, labeling); P4, GCGGTGACCCGGGAGATCTGAATTC (reverse primer); C, GAATTCAGATCTCC (complementary to reverse primer for blunt end ligation).
Blunt-end synthesis was carried out in 30 μl containing 2 μg of DNA, 1× Vent polymerase mix (New England Biolabs) with an additional 3 mm MgSO4, 50 mm NaCl, 0.01% gelatin, 1 pmol of the gene-specific primer P1, 1 mm dNTPs, and 2 units of Vent polymerase. The mixture was annealed for 40 min at 58 °C preceding a final synthesis at 76 °C for 10 min. The samples were then diluted with 300 μl of 0.2 m NaCl, and PCI extracted before ethanol precipitation with 0.3 m sodium acetate and 100 μg of glycogen. The pellet was taken up in 45 μl of 50 mm NaCl, 5.6 μl of T4 DNA ligase mix (Promega), and 100 pmol of the P4/C duplex for blunt end ligation. T4 DNA ligase (6 units) was added to each sample, and the reaction was incubated at 14 °C overnight. The samples were then heated at 100 °C (10 min) and ethanol-precipitated, and the pellet was taken up in 100 μl of PCR reaction mix (1× Vent polymerase mix, 50 mm NaCl, 0.01% gelatin, 3 mm MgSO4, 500 μm NTPs, and 10 pmol each of the P2 and P4 primers). After the addition of 2 units of Vent polymerase, the samples were amplified by 25 PCR cycles (95 °C for 2 min, 65 °C for 2 min, 76 °C for 5 min) followed by a single 76 °C cycle at 10 min. Five pmol of 5′-32P-labeled P3 primer along with 500 μm NTPs and 2 units of Vent polymerase were added to the mix for labeling. Two linear PCR cycles were performed (96 °C for 4 min, 71 °C for 2 min, and 76 °C for 10 min) followed by one cycle at 76 °C for 5 min. The samples were then PCI-extracted and ethanol-precipitated, and the pellet was taken up in 20 μl of formamide containing xylene-cyanol dye. The LMPCR products were separated by denaturing 10% PAGE with Tris borate-EDTA and 7 m urea. A second set of primers was used to start at −257: P5, GCGTCAGCAGGTTTCCAC (−296 to −278, blunt end synthesis); P6, CCACGGCCTTTCCCTGTAGCC (−282 to −261, PCR); P7, CCACGGCCTTTCCCTGTAGCCCTGG (−282 to −258, end labeling).
Methyltransferase Accessibility Protocol-Individual Template (MAPit)
A previously described general procedure (30) was followed and is briefly described herein. HeLa cells were grown to near confluence in DMEM containing 10% fetal bovine serum in 10-cm dishes. Cells were detached by trypsinization and washed three times with ice-cold PBS by centrifuging at 1000 × g for 5 min at 4 °C between washes. Each MAPit reaction was performed on 1 million nuclei. Cells were resuspended in resuspension buffer (20 mm HEPES, pH 7.5, 70 mm NaCl, 0.25 mm EDTA, 0.5 mm EGTA, 0.5% (v/v) glycerol, 10 mm DTT, 0.25 mm phenylmethylsulfonyl fluoride, and protease inhibitor mixture (Roche Applied Science)). The cells were then centrifuged and pelleted at 1,000 × g for 5 min before resuspending in lysis buffer (resuspension buffer with 0.2% Nonidet P-40), incubated for 10 min on ice, and terminated by adding an excess of resuspension buffer containing 160 μm S-adenosylmethionine. After prewarming the nuclei to 37 °C for 5 min, 0, 30, and 100 units of M.CviPI were added and the mixtures were further incubated for 15 min at 37 °C. The methylation reactions were terminated by adding an equal volume of stop buffer (100 mm NaCl, 10 mm EDTA, pH 8.0, 1% SDS), and following Proteinase K treatment, the genomic DNA was phenol/chloroform-extracted and ethanol-precipitated. The efficiency of the methylation was confirmed by quantitative methyl-sensitive restriction endonuclease digest assay using HaeIII digestion and quantitative real-time PCR (PerfeCTa® SYBR® Green FastMix® reaction mixes with low ROX reference dye, Quanta Biosciences) as described previously (30). DNA was quantitated using the Qubit Fluorescent DS DNA BR assay kit (32850, Life Technologies), and 2 μg of DNA was then treated with bisulfite using a method described previously (30). The bisulfite-treated DNA was amplified with the following primers designed to specifically amplify the deaminated bottom strand of the FOS promoter from −221 to +43 (capital letters) and to contain the restriction sites XhoI and HindIII, respectively (underlined): P8, tgtacgaagcttCCACRAAACCTCTAAAACAAAAACT (−221 to −197); P9, tatcttctcgagGYTTAGTTTTGGCTTTTTAGTTGYT (43 to 19).
Degenerate bases (Y or R) were used to reduce the PCR amplification biases at potential CG or GC sites, and these sites were not included in the sequencing analysis. PCR was performed using 1–3 μl of the total 20 μl of DNA eluted from a Zymo kit column and the appropriate primers using TaKaRa EpiTaq HS polymerase (R110Q Clontech). The PCR products were ligated into pBluescript SK- vector (Agilent) using the restriction sites, and multiple clones in glycerol stocks were sequenced using rolling circle amplification at Genewiz Inc., and the methylation patterns on the DNA sequences were analyzed using MethylViewer (31).
Deamination of UVB-irradiated Genomic DNA in Vitro
Purified genomic DNA (350 μg) in a total volume of 3.5 ml (50 mm KCl and 10 mm Tris-HCl, pH 8) was divided into 10 clear 1.5-ml centrifuge tubes. The tubes were placed lying down on a transilluminator and irradiated with 1500 J/m2 of 302-nm light (UVB light). After recombining the samples, the solution was made up to 2 mm EDTA, 100 mm KCl and to pH 7.2 with 1 m MES buffer, pH 6. This sample was then divided into 17 tubes (each containing 20 μg of DNA) and incubated at 37 °C. Individual samples were removed at time intervals and then quick frozen before storage at −80 °C. One sample was allowed to completely deaminate by overnight incubation at 67 °C.
Deamination of UVB-irradiated Genomic DNA in Vivo
After a PBS wash, individual plates containing HeLa cells (about 1 million cells) were irradiated with 4000 J/m2 of 302-nm light at room temperature under an inverted Spectroline TR-302 transilluminator before returning to the 37 °C incubator with fresh growth media. The plates were removed from the incubator at various time intervals, and the cells were harvested by scraping and then lysed immediately with 1% SDS and stored at −80 °C before DNA purification. After DNA purification as described above for hydroxyl radical footprinting, the DNA from one plate was incubated at pH 6 overnight at 67 °C to obtain a sample in which the CPDs were completely deaminated.
Preparation of Deaminated DNA for LMPCR
E. coli photolyase (2.8 μg) was added to 20 μg of deaminated irradiated DNA sample in 200 μl of 50 mm NaCl, 5 mm EDTA, 5 mm DTT, and 10 mm Tris-HCl, pH 7.5, in a clear 1.5-ml polyethylene microcentrifuge tube. The samples were placed in the dark for 7 min before further incubation at 23 °C at 1.3 cm from a 360-nm wavelength lamp for 1 h. After photoreversion, SDS was added to give a 1% solution, and the samples were incubated 5 min at 23 °C. The NaCl concentration was increased to 0.2 m prior to two PCI extractions and two ethanol precipitations with 0.3 m sodium acetate and 100 μg of glycogen. Pellets were then air-dried and taken up in 90 μl of 50 mm NaCl before interim storage at −80 °C. The T and U of T·G and U·G mismatches were then converted to abasic sites by incubation with 10 μg of thymidine DNA glycosylase in a 100-μl reaction mix containing 50 mm NaCl, 5 mm EDTA, 2 mm DTT, and 10 mm Tris-HCl, pH 7.5. After incubation for 1 h at 23 °C, 0.12 μg of uracil DNA glycosylase was then added, and the reaction was allowed to proceed for an additional 30 min. SDS was then added to a final concentration of 1%, and the samples were incubated for 20 min before adding 200 μl of 0.3 m NaCl. Samples were then PCI-extracted and ethanol-precipitated with sodium acetate and glycogen. Samples were resuspended in 100 μl of T4 endonuclease buffer containing 50 mm NaCl, 5 mm EDTA, and 10 mm Tris-HCl, pH 7.5, before interim storage at −80 °C. T4 endonuclease V (0.1 μg) was added to the samples to convert the abasic sites to phosphate-terminated single nucleotide gaps and incubated at 37 °C for 40 min before adding SDS to a 1% final concentration. After a 5-min incubation, 200 μl of 0.3 m NaCl was added before two PCI extractions followed by two ethanol precipitations with sodium acetate and glycogen. After air-drying the pellet, the samples were resuspended in 50 μl of water and heated at 100 °C for 10 min before interim storage at −80 °C. Samples were quantified by their absorbance at 260 nm and then subjected to LMPCR as described above for hydroxyl radical footprinting.
Rate Constant Calculations
The bands in the LMPCR gels corresponding to deamination sites were integrated following phosphorimaging by the Bio-Rad Quantity 1 program. The data were fit by a non-linear least squares method with the Kalaidagraph program to V(t) = A(1 − exp(−kt)) + B, where V(t) is the raw integrated band volume measured at time t in hours, A is the amplitude, k is the rate constant, and B is the background.
Results
Determining Nucleosome Positioning by Hydroxyl Radical Footprinting in Vivo
To determine the rotational positioning of the FOS promoter in HeLa cells, we modified a standard in vitro procedure for hydroxyl radical footprinting that uses EDTA and Fe2+. We found that a 50-fold higher concentration of ascorbate and 30-fold higher concentration of H2O2 were needed for the in vivo experiment than are typically used in vitro (32). The cleavage products were detected by LMPCR, and the bands were aligned to the sequence by comparison with a dimethyl sulfate-generated G ladder (Fig. 2). The in vivo footprinting experiment clearly shows an ∼10-bp helical repeat cleavage pattern indicative of a nucleosome that is not present with the free DNA in vitro. The chemically induced hydroxyl radical footprint of the FOS promoter in HeLa cells was essentially the same as the one previously obtained by x-ray irradiation from −240 to +1 in TIG-3 cells (24). The chemically induced footprint that we obtained was for the same section of DNA but used a different set of nested PCR primers (beginning at −256) and Vent polymerase, instead of the Expand Long Template PCR System used for the x-ray footprinting. The footprinting pattern was the same whether the reaction was carried out in DMEM or PBS, or with a 5- or 15-min incubation time at either room temperature or 37 °C, although cells began to detach from the plate after 15 min at 37 °C.
FIGURE 2.
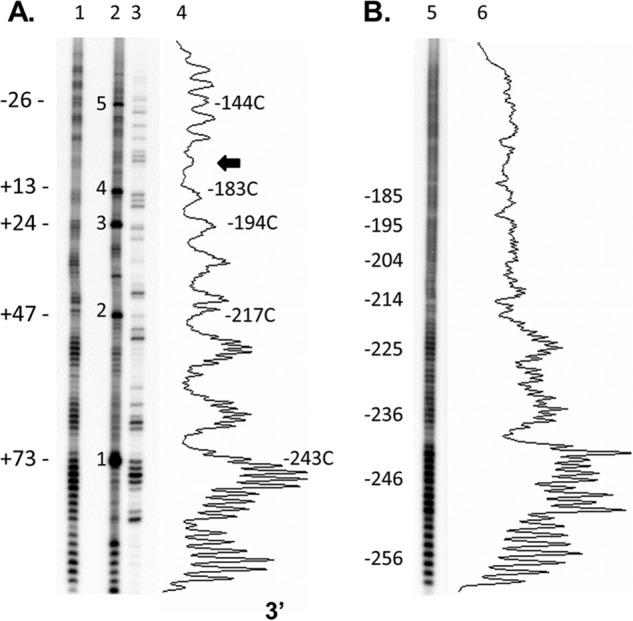
In vivo and in vitro hydroxyl radical footprints downstream of −253 in the FOS promoter. A, in vivo. Lane 1, hydroxyl radical footprint with the numbers to the left referring to proposed positions of the TCG CPDs relative to the nucleosome dyad; lane 2, 48-h deamination reaction with the numbers to the left referring to the TCG CPD sites numbered according to Fig. 1; lane 3, Maxam-Gilbert G reaction; lane 4, densitometry trace of lane 1, with numbers to the right indicating the position of a peak relative to the transcription start site. The arrow indicates the proposed location of the dyad axis. B, in vitro. Lane 5, hydroxyl radical footprint; lane 6, densitometry trace of lane 5.
Noticeably, the group of cleavage bands near the expected position of the dyad was suppressed in the same way that had been observed in the in vitro hydroxyl radical footprinting of nucleosomes associated with H1 (21). LMPCR of the in vivo hydroxyl radical footprinting reaction utilizing a second set of primers located closer to the dyad site (beginning at −194) also showed the same suppression of the cleavage bands around −173 (Fig. 3). The chemically induced hydroxyl radical footprint, combined with the midpoint of the hydroxyl radical cleavage bands from both strands observed in the x-ray footprint, indicates that the central dyad is centered at −170. This would be consistent with the previously established borders of MNase resistance from −250 to −90, the average of which corresponds to a dyad at −170.
FIGURE 3.
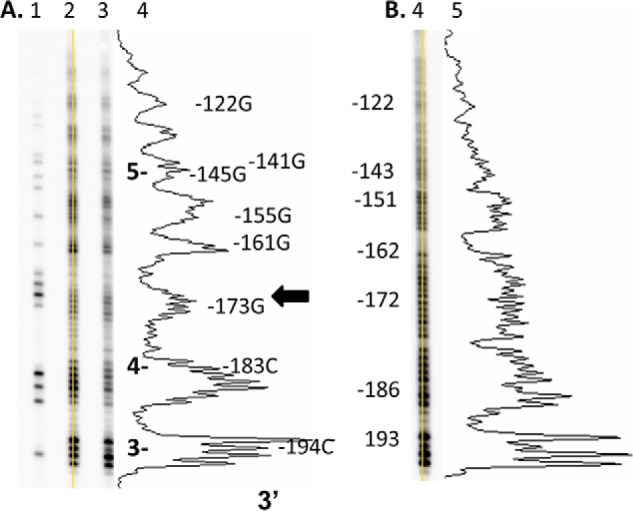
In vivo and in vitro hydroxyl radical footprints upstream of −190 of the FOS promoter. A, lane 1, Maxam-Gilbert G reaction conducted on genomic DNA in vitro; lanes 2 and 3, hydroxyl radical footprinting reactions carried out at two different reagent concentrations in vivo; lane 4, densitometry trace of lane 2, with numbers to the right indicating the position of a peak relative to the transcription start site and the arrow indicating the proposed location of the dyad axis. B, lane 5, hydroxyl radical footprint carried out on genomic DNA in vitro; lane 6, densitometry trace of lane 5.
Determining CpG Methylation Status and Nucleosome Positioning Using MAPit
We also probed the upstream region of the FOS promoter using the MAPit technique, which maps the accessibility of cytosines at GpC sites to an exogenous DNA methylase transferase through bisulfite sequencing (33, 34). Because bisulfite sequencing is used, it also reports on the methylation status of CpG sites. Unlike hydroxyl radical footprinting, which produces an ensemble average of footprints, the MAPit methylation protection procedure can produce methylation footprints for individual protein and nucleosome arrangements and has been extensively used to study promoters and chromatin structure (35–37). In this procedure, nuclei are treated with M.CviPI methyltransferase, which methylates the cytosines of all accessible NGCN sites except for those that are blocked by nucleosomes and/or DNA-binding proteins. The unmethylated cytosines in the DNA are then deaminated to uracil upon treatment with bisulfite, whereas 5-methylated cytosines remain unchanged. The DNA is then subjected to PCR with primers designed to amplify one of the deaminated strands, converting all uracils to thymines, after which the DNA is cloned and sequenced or is directly sequenced by NextGen methods. In this way, each sequence gives the methylation protection pattern for an individual DNA molecule, the sum of which would give the ensemble average of methylation protection.
The MAPit technique was used to analyze the bottom strand of the FOS promoter from 196 bp upstream of the transcription start site (TSS) to 18 bp downstream of the TSS. Methylation was carried out with 0, 30, and 100 units of M.CViPI methylase, and the PCR products of the bisulfite-treated DNA were cloned into pBluescript SK− and sequenced. The non-methylation controls (15 sequences) did not show methylation at any of the CpG sites, including the four CpG sites 2–5 from −217 to −144. Because of limitations in designing the primers for bisulfite sequencing, we were unable to determine the methylation status of the more upstream TCG site 1 at −243. Analysis of the methylated sequences revealed large patches of inhibition (>100 bp), which have been interpreted as nucleosome binding sites, along with smaller patches, which represent transcription factor binding sites (Fig. 4A). The methylation state of each site in the clones was averaged to assess the overall chromatin structure of the promoter (Fig. 4B). Methylation with both 30 and 100 units of methylase was greatly suppressed upstream of −110 in the region of the nucleosome. The related SsspI CpG methylase has been found to access about 30 bp of the DNA at the entry-exit sites of the nucleosome through a passive site exposure mechanism (38). If this is also the case for the M.CviPI methylase, the methylation protection data would be consistent with a downstream nucleosome border of −90 determined by MNase (23)
FIGURE 4.

Methylation protection mapping of the FOS promoter. A, sequences of cloned DNA using the indicated amount of methyl transferase. Open oval, unmethylated CpG; filled oval, methylated CpG. Open triangle, unmethylated GpC; red triangle, methylated GpC. Orange, inability to properly align the local sequence. Percentages on the left, percentages of the sequences with at least one GpC methylation event. Percentages on the right, percentage deamination of the non-CpG or GpC sites. DR, direct repeat; CRE, cAMP-response element-binding site; TATA, TATA site. Numbers below are relative to the TSS. B, histogram of the percentage methylation at GpC sites of the FOS promoter for different amounts of methylase plotted relative to the TSS.
Analysis of the 34 individual sequences obtained with the highest concentration of methylase (100 units) revealed the presence of three major methylation patterns (Fig. 4A). One pattern (11 of 34) was completely devoid of methylated cytosines, indicative of a highly condensed chromatin structure such as might be found in mitotic cells (data not shown). The second pattern (11 of 34) was one in which there were methylated cytosines from −66 to −110 corresponding to the expected downstream border of the nucleosome. The third pattern (11 of 34) showed significant numbers of methylated cytosines in the region surrounding the transcription start site. Of all of the sequences with methylated cytosines, 21 of 23 showed complete protection from methylation upstream of −110. For 10 of these sequences, the most upstream methylated site was at either −108 or −110. For another six sequences, the most upstream methylated site was between −80 and −102. Only two sequences showed methylation within the putative nucleosome binding site.
Deamination Rates in Vitro
Deamination rates of CPDs were first determined for purified genomic DNA in vitro by LMPCR according to the scheme in Fig. 1C in order to provide a baseline of comparison with the in vivo deamination experiments. Purified genomic DNA was irradiated with UVB light and then incubated at 37 °C for different time intervals to allow for deamination. The DNA was then photoreverted with photolyase and UVA light to create either U/G or T/G mismatches, resulting from deamination of cytosine or 5-methylcytosine, respectively. This was followed by treatment with thymidine DNA glycosylase and uracil DNA glycosylase to excise both thymine and uracil in the mismatches. Thymidine DNA glycosylase (39, 40) was added in case the cytosine of CPD 1 at the −243 site was methylated. The DNA was then cleaved at the resulting abasic sites by the lyase activity of T4 endonuclease V to create a 5′-phosphate end for ligation to a linker. The ligation products were then PCR-amplified using a gene-specific forward primer and a linker-specific reverse primer.
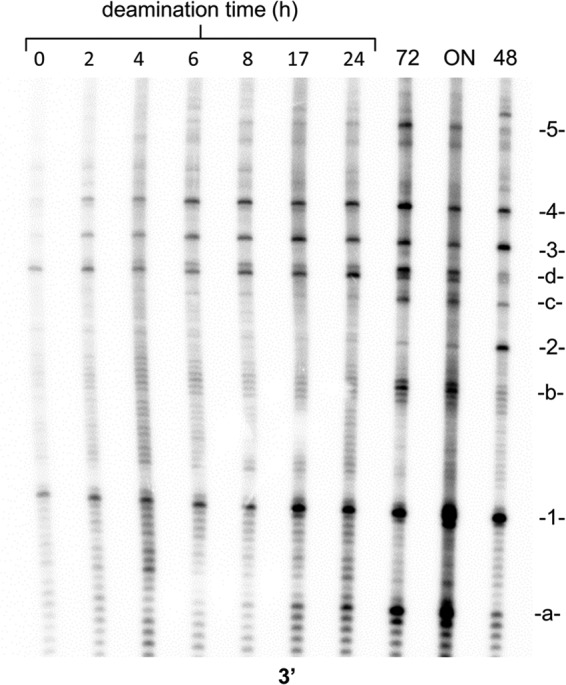
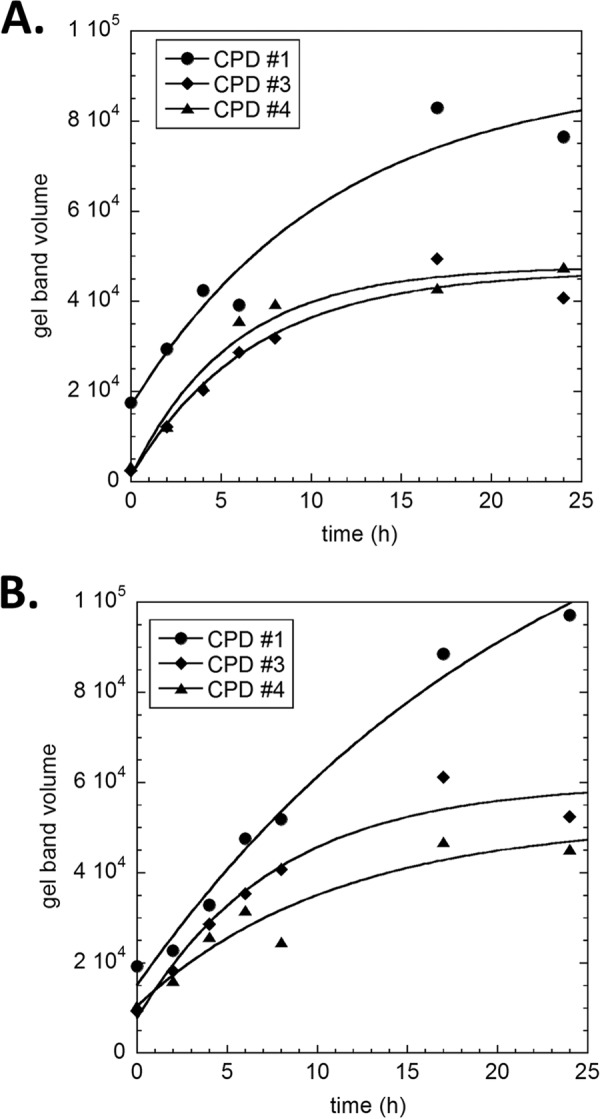
Fig. 5 shows the phosphor image of the LMPCR products as a function of in vitro deamination time for CPDs 1–4 using a −256 primer. The data were then fit by a non-linear least squares method to a simple first order process (Fig. 6A) to yield deamination half-lives between 3.2 and 6.7 h (Table 1). One-way analysis of variance indicated that the deamination half-lives were not the same at the p = 0.5 level and that CPD 2 was significantly different from CPD 3, which would be consistent with the fact that they are in different sequence contexts. Deamination half-lives of 2.0 ± 0.8 and 4.4 ± 1.4 h were also obtained for CPDs 3 and 4 using a −194 gene-specific primer (Fig. 6B) and were within experimental error of the values of 3.2 ± 0.9 and 4.0 ± 1.0 obtained from the first primer set. The relative yields of the photoproducts, as determined from the relative intensity of the deamination bands following a 48-h incubation at 37 °C and pH 7.1 to completely deaminate the CPDs, were quite similar to those calculated from the curve fits to the deamination data.
FIGURE 5.
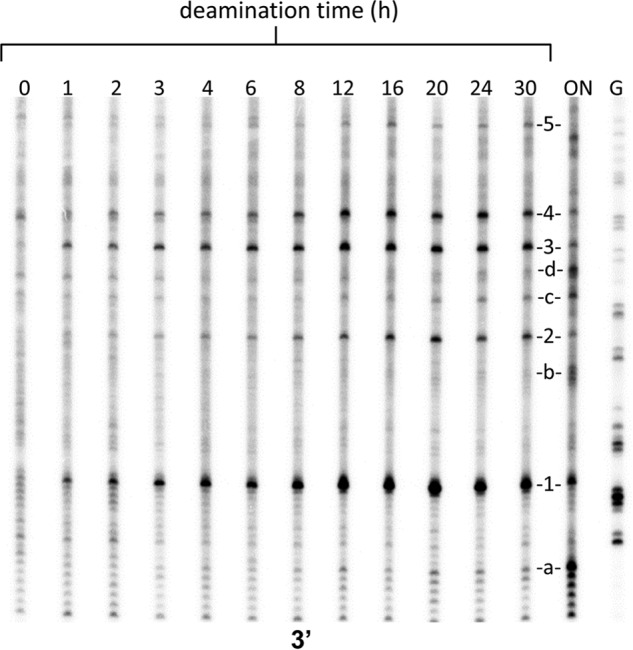
Time course of the in vitro deamination of CPDs from in vitro irradiated DNA. LMPCR assay for deaminated C-containing CPDs for the indicated deamination times in hours. ON, overnight in vitro deamination of in vitro irradiated DNA at 60 °C, pH 6.2. G, Maxam Gilbert G reaction lane.
FIGURE 6.
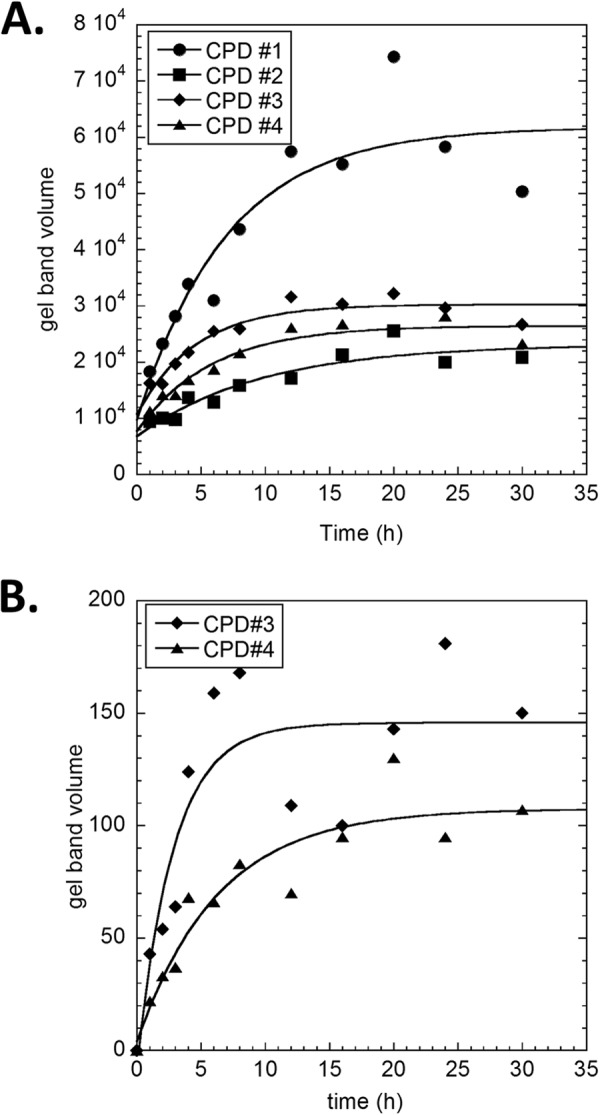
Curve fit plots of the in vitro deamination of TCG CPDs from in vitro irradiated DNA as a function of deamination time. A, raw band volumes from the phosphor image shown in Fig. 5 are plotted against deamination time and fit to a first order process as described under “Experimental Procedures.” B, repeat of the experiment using primers beginning at −194.
TABLE 1.
Deamination t½ and yields for CPD formation in the FOS promoter in vitro and in vivo
| CPD 1 | CPD 2 | CPD 3 | CPD 4 | |
|---|---|---|---|---|
| In vitro | ||||
| t½ (h) | 4.8 ± 2.2 | 6.7 ± 3.2 | 3.2 ± 0.9 | 4.0 ± 1.0 |
| Relative rates | 1 | 0.72 ± 0.47 | 1.5 ± 0.8 | 1.2 ± 0.6 |
| Relative yield (curve fit) | 1 | 0.31 ± 0.06 | 0.38 ± 0.07 | 0.36 ± 0.06 |
| Relative yield (gel, 48 h) | 1 | 0.39 | 0.47 | 0.34 |
| In vivo 1 | ||||
| t½ | 7.8 ± 4.6 | 4.7 ± 1.3 | 3.9 ± 0.9 | |
| Relative rates | 1 | 1.7 ± 1.1 | 2.0 ± 1.3 | |
| Relative yield (curve fit) | 1 | 0.62 ± 0.15 | 0.63 ± 0.15 | |
| Relative yield (gel 70 h) | 1 | 0.15 | 0.48 | 0.70 |
| In vivo 2 | ||||
| t½ | 15.8 ± 6.8 | 5.3 ± 1.5 | 7.6 ± 4.2 | |
| Relative rates | 1 | 3.0 ± 1.5 | 2.1 ± 1.5 | |
| Relative yield (curve fit) | 1 | 0.40 ± 0.11 | 0.32 ± 0.10 | |
| Relative yield (gel 70 h) | 1 | 0.14 | 0.47 | 0.67 |
| Average of 1 and 2 | ||||
| t½ | 11.8 ± 8.2 | 5.0 ± 2 | 5.7 ± 4.3 | |
| Relative rates | 1 | 2.1 ± 1,0 | 2.0 ± 1.0 | |
| Relative yield (curve fit) | 1 | 0.48 ± 0.09 | 0.43 ± 0.09 | |
| Relative yield (gel 70 h) | 1 | 0.14 | 0.47 | 0.67 |
| Rate change | ||||
| In vivo/in vitro | 0.46 ± 0.2 | 0.63 ± 0.30 | 0.78 ± 0.23 | |
| Relative to CPD1 | 1 | 1.4 ± 0.9 | 1.70 ± 0.9 | |
| Predicted | ||||
| Position 2: −1 | 1 | 4.3 ± 0.7 | 4.3 ± 0.7 | |
| Position 3: 0 | 1 | 2.5 ± 0.3 | 2.5 ± 0.3 | |
| Position 4: 1 | 1 | 0.5 ± 0.1 | 0.5 ± 0.1 | |
Because both CPD 2 and CPD 4 share the same sequence context, TCT=CGTG, they were expected to have very similar deamination half-lives and yields, which they do within the experimental error (half-lives of 6.7 ± 3.2 and 4 .0 ± 1.0 h and relative yields of 0.39 and 0.34 with respect to CPD 1). Whereas CPD 1 shares the same 5′-flanking sequence as CPD 3 (TTT=CGGG versus TTT=CGCA), the 3′-flanking sequence is different, which could explain its 2.1-fold higher yield than CPD 3. The difference in the 3′-flanking sequence did not, however, appear to greatly influence the deamination half lives, which are the same within experimental error (4.8 ± 2.1 and 3.2 ± 0.9 h). It is also possible, however, that the apparent differences in CPD yields are due to differences in the ligation or PCR amplification efficiencies for the different sites.
Cytosine-containing CPDs were also detected at sites a–d after overnight deamination at 60 °C at pH 6.2 (Fig. 5). The major deamination product at site a (−254) corresponds to GCTCCCCCCA, whereas the major band at site b (−225) corresponds to GCCCCCCA. Site c (−208) corresponds to GTCTCA, and site d (−200) corresponds to GTTCCTG. On the basis of a prior study using 5-methylcytosine in place of cytosine, CPDs at all of these sites were expected to have deamination half-lives on the order of hundreds of hours compared with about 5 h for the TCG CPDs (13). This would explain why bands corresponding to these sites did not appear during the 1–24 h time points and required longer deamination times and higher temperatures and/or lower pH levels than the TCG CPDs to become fully deaminated.
Deamination Rates in Vivo
For the in vivo deamination studies, HeLa cells were irradiated in individual culture plates and worked up with special care to minimize deamination of the CPDs during DNA purification. Low pH, high temperature, and low salt all increase the rate of deamination (13), and these conditions were avoided as much as possible. Samples were also quick frozen on dry ice between purification steps as an additional precaution. DNA quantitation by UV absorbance at 260 nm was complicated by contaminating RNA, so the DNA was quantified instead by a double strand-specific PicoGreen assay method (41). A high dose of UVB light (4000 J/m2) was needed to obtain sufficient signal over background, and under these conditions, the CPD frequency was about one per 500–1000 bases. Time points were limited to 24 h to minimize effects of DNA repair and other processes, although it has been shown that DNA repair is virtually non-existent at this dose (10). Fig. 7 shows the in vivo deamination time course, and a repeat experiment gave similar results. Analysis of the data for CPDs 1, 3, and 4 yielded average deamination half-lives that were similar to those in vitro (Fig. 8 and Table 1), although one-way analysis of variance at the p = 0.5 level indicated that they were not the same and that the average deamination half-life for CPD 1 was significantly longer than that of CPD 3. This is in contrast to what was observed in vitro, where they were determined not to be significantly different. The yield of CPD 2 was too low to analyze. When deamination was driven to completion by incubation at pH 6.2 for 72 h or overnight at 60 °C, the same set of photoproducts at non-TCG sites a–d were observed (Fig. 7).
FIGURE 7.
Time course of in vivo deamination of CPDs from in vivo irradiated DNA. LMPCR assay for deamination of cytosines in CPDs for the indicated deamination times in hours. Lane 72, 72-h in vitro deamination of in vivo irradiated DNA at 37 °C, pH 6.2. ON, overnight in vitro deamination of in vivo irradiated DNA at 60 °C, pH 6.2. 48, 48-h deamination of in vitro irradiated DNA at 37 °C, pH 7.1.
FIGURE 8.
Curve fit plots of the in vivo deamination of the TCG CPDs from in vivo irradiated DNA as a function of deamination time. A, raw band volumes from the phosphor image shown in Fig. 7 are plotted against deamination time and fit to a first order process as described under “Experimental Procedures.” B, repeat of the experiment.
Correlating CPD Yields and Deamination Rates to Chromatin Structure
Given the position of the nucleosome dyad at −170, the positions of the five TCG CPD sites could be assigned to specific translational and rotational positions by comparison with a known nucleosome crystal structure. In this way, the variations in photoproduct formation and deamination could be directly related to nucleosome topography. We chose the high resolution 1kx5.pdb nucleosome structure formed between human α-satellite repeat sequence and Xenopus laevis histones (25) and mutated its sequence to that of the FOS promoter DNA. In doing so, the translational positions for the cytosines of the T=CG CPDs 1–5 were assigned to base positions 73, 47, 24, 13, and −26, respectively, in chain I relative to a central dyad at position 0 (Fig. 9A). To assign the rotational positions, we first assigned the orientation of the C·G base pair of each CPD in the FOS nucleosome by examining its orientation in the mutated 1kx5.pdb structure (25) (Fig. 9B). In this way, the cytosine of the CPD 1 was in an intermediate orientation with the major groove facing in, as is the case for the base pair at the dyad (position 0). Likewise, CPDs 3 and 4 at −194 and −183 could be assigned to outside orientations, which have approximately the same orientation as position +3 from the dyad.
FIGURE 9.
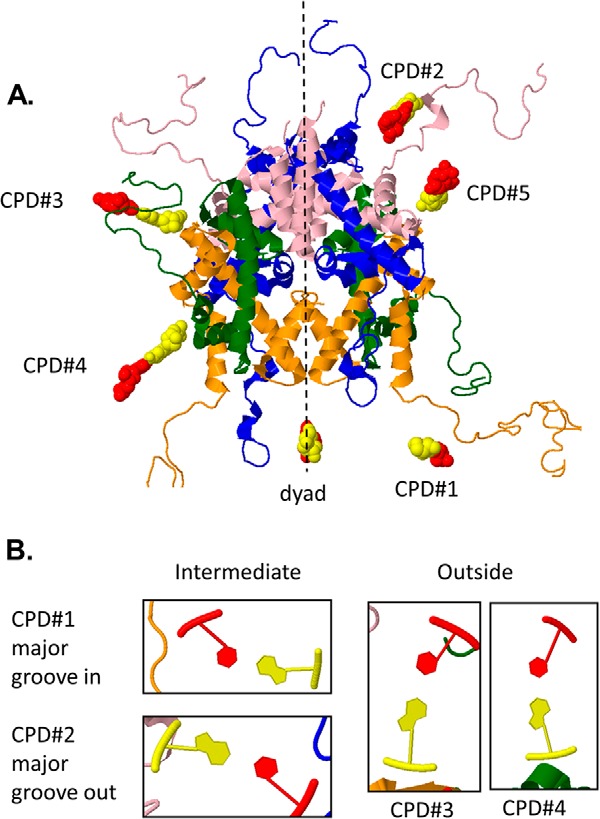
Translational and rotational positions of the cytosines of CPDs 1–5. The DNA sequence of the 1kx5.pdb structure was mutated to that of FOS, assuming that the dyad is at −170, to assign the translational positions of the cytosines of the TCG CPDs (shown in red) (A) and the rotational orientation of the C relative to the nucleosome surface (bottom of each panel) (B). The rotational orientation of CPD 5 is similar to that of CPD 2.
One major observation was that CPD formation at site 2 (C at −217), which is part of the sequence TCTCG, was greatly inhibited in vivo relative to the other sites in comparison with what was observed in vitro. In addition, hydroxyl radical cleavage was also inhibited at the nearby position −215. Relative to a dyad at −170, the −217C site corresponds to +47T in the 1kx5.pdb nucleosome structure that is part of a TTTTG sequence (positions 44–48 in 1kx5.pdb). Lysine 13 of the H2A histone sits in the minor groove of thymidines at +45 and +46 in chain I of the crystal structure, although it is not seen at the symmetrical site on the J chain. Lys-13 is also conserved in the human H2A protein (42). If the lysine was situated in the same way in the FOS nucleosome, it might be able to alter the conformation or excited state properties of −217C and explain why photodimerization of −218T with −217C was greatly inhibited. The crystal structure also shows that C4′ and C5′, which are the principal sites of hydroxyl radical attack on DNA (43), are sterically blocked at the +45 nucleotide by Lys-13, Ala-12, and Arg-11 of the H2A histone, which could explain the large inhibition of hydroxyl radical cleavage seen at −215. The amino acids Arg-11 and Ala-12 are also conserved in the human H2A protein (42).
Because we could not directly compare the deamination rates of the CPDs in vitro and in vivo due to uncertainties regarding the buffer composition and pH in the nucleus, we instead compared how their relative deamination rates changed. Because formation of CPD 2 was greatly inhibited in vivo, it was not possible to determine its rate of deamination; nor could we determine the rate of deamination of CPD 5 due to the low intensity of the bands in the gels. We could, however, determine the deamination rates for the remaining three sites in vitro and in vivo and compare how they changed relative to what we observed previously for the change in deamination rates of TmCG CPDs in a reconstituted nucleosome (19) (Table 1). Based on their assigned rotational positions, CPDs 3 and 4 would be predicted to deaminate 2.5 times faster relative to CPD 1 when in the nucleosome than when in free DNA (19). The predicted change in deamination rate is within experimental error to the observed change of 1.4 ± 0.9 and 1.7 ± 0.9 for CPDs 3 and 4, respectively (Table 1). The observed change in deamination rates for CPDs 3 and 4 relative to CPD 1 does not fit as well to that of 0.5 ± 0.1 predicted if the dyad were at −169, which would place the CPDs 1, 3, and 4 at rotational positions 1, 4, and 4, respectively. The observed changes also do not fit well to a change of 4.3 ± 0.7 expected if the dyad were at −171.
Discussion
Our ultimate goal is to explain the origin of UV-induced C to T mutation hot spots related to skin cancer. Because CPDs are replicated in a highly error-free manner by polymerase η, the C-containing CPDs must deaminate first to cause C to T mutations (2, 5). When the 5,6 double bond of C becomes saturated by CPD formation, its deamination half-life drops from tens of thousands of years (44) to tens to hundreds of hours (13), making it competitive with replication and repair processes. In one study of human skin biopsies using a postlabeling assay, 24% of TT=C CPDs remained after 48 h (45), whereas in another study using mass spectrometry, 28% of T=C CPDs remained after 48 h (46). A 5′-flanking G further accelerates the deamination of TC and TmC in duplex DNA over 10-fold compared with other sequence contexts, dropping the half-life to the order of hours (13). Nucleosomes modulate the deamination rate of TmCG CPDs in vitro by up to 50-fold faster for one facing outside compared with one facing inside (5, 19). In vivo, a rapidly deaminating CPD would be expected to be more mutagenic because there would be a higher probability that polymerase η would encounter a deaminated CPD prior to repair. The current study represents the first attempt to measure CPD photoproduct deamination rates at TCG sites in vivo as a function of both rotational and translational position in a nucleosome. As a test system, we chose a well characterized nucleosome that is located in the FOS promoter that was found to be in a single rotational orientation and largely in a single translational position based on MNase cleavage and psoralen binding inhibition, together with DNase I and x-ray-induced hydroxyl radical footprinting in TIG-3 cells (23, 24).
Hydroxyl Radical Footprinting in Vivo
To confirm that the nucleosome was positioned the same way in HeLa cells as in TIG-3 cells, we modified a standard in vitro iron-EDTA hydroxyl radical footprinting procedure to work in vivo by using a 50-fold higher concentration of the reducing reagent ascorbate and a 30-fold higher amount of the oxidizing agent H2O2. Surprisingly, we could not find any prior reports using the iron-EDTA system in mammalian cells, possibly because researchers did not realize that a much higher concentration of hydroxyl radical was needed in vivo than is normally used in vitro. Instead, groups have been using γ-rays (47) and x-rays (24, 48) to generate hydroxyl radicals in vivo. The group utilizing x-rays noted that a 10-fold higher dose was required to obtain the same level of strand cleavage as obtained in vitro, in support of previous studies showing that chromatin greatly protects DNA from hydroxyl radical damage (49, 50). We found that the Fe-EDTA system gave the same cleavage pattern for the FOS promoter nucleosome in HeLa cells as produced by x-rays in TIG-3 cells (24). As such, our modified chemical procedure should be a convenient alternative to ionizing radiation for mapping protein DNA interactions in mammalian cells because it does not require access to an ionizing radiation source and can be completed in <5 min to ensure chromatin integrity.
It is important to note, however, that the ligation-mediated LMPCR method for detecting strand breaks resulting from ionizing radiation can only detect breaks that result in a 5′-phosphate. Although abstraction of the C4′-hydrogen does lead to a 5′-phosphate end, attack at C5′ results in formation of a C5′-aldehyde, which would not be detectable by the LMPCR method unless conditions are such as to lead to β-elimination of the 3′-phosphate (51). This fact may lead to differences between hydroxyl radical footprints produced from end-labeled DNA substrates and LMPCR procedures because the C5′-H is the major site of attack by hydroxyl radicals, followed by C4′-H (43).
Dyad Position
Simple inspection of the hydroxyl radical footprint in vivo revealed that the cleavage bands centered at −173 that was in the expected vicinity of the nucleosome dyad was inhibited and consistent with what has been observed in vitro with 601 DNA reconstituted with chicken erythrocyte histone core particle and histone H1 (21). Also similar was that the protected region in vivo appeared to extend beyond the central 10 bases because the flanking cleavage bands were centered at −161 and −185 instead of −163 and −184 as would have been expected for 10.7 bp/turn of the DNA helix at the dyad (52). These results, together with our MAPit results and previous results from MNase cleavage inhibition (23), are consistent with a nucleosome dyad at about −170. In vitro, H1 also induces a 10-base hydroxyl radical cleavage repeat pattern on the 601 nucleosome that extends at least 30 bases beyond the edge of the nucleosome core with both incoming and exiting DNA (21). This would explain the ∼10-bp helical repeat pattern in the hydroxyl radical footprinting that we observed to extend in vivo through our limit of −256 and through −268 in a previous study (24), which is almost 100 bp from the dyad center at −170/171. The helical repeat pattern did not persist past −110 at the downstream edge of the nucleosome core, which might be explained by protein binding to a direct repeat sequence that exists at this site. A set of guanines from −255 to −258 (−85 to −88 relative to a dyad at −170) in the top strand and at −78 to −81 (−80 to −83 relative to a dyad at −170) in the lower strand have been shown to be protected from dimethyl sulfate that had been attributed to a non-histone protein (24). The major groove site of both sets of guanines, however, would map to the inside position of the DNA, which is where H1 would be expected to interact, and thus seems more consistent with H1.
A second possibility is that the suppressed cleavage at the dyad could be due to the binding of NF1, which has a consensus sequence of TGG(A/C)NNNNNGCCAA (53). This sequence matches that of AGGACACGCGCCAA, which extends from −177 to −164 in the FOS sequence, which places it at what we propose to be the dyad axis at −170, with the major groove of the two recognition sites facing out. NF1 has been shown, however, not to bind to its consensus sequence when assembled into a nucleosome irrespective of its rotational position for sites that are 10, 20, 30, or 40 bp from the nucleosome dyad (54), but its ability to bind at the dyad was not investigated. NF1 has been shown to bind to the FOS NF1 site following histone acetylation triggered by the MAPK-signaling pathway that is required for promoter activation (55). Because the promoter would not be activated under the conditions used in our footprinting experiments, it is unlikely that NF1 explains the suppressed hydroxyl radical cleavage bands at the dyad. Furthermore, NF1 interactions at the dyad would not explain the extended 10-base repeat pattern in the hydroxyl radical footprint extending beyond the edge of a nucleosome core, which would be best explained by binding of H1. It is also interesting to note that dimethyl sulfate-, psoralen-, and x-ray-mediated hydroxyl radical footprints of the FOS promoter are not significantly different between uninduced, induced, and superinduced states, suggesting that the nucleosome structure is maintained throughout (24). In support of this observation, our MAPit results indicated that the nucleosome was present whether or not the RNA polymerase II site was occupied (region between the TSS and TATA site; Fig. 4A). It is also interesting to note that although the FOS promoter DNA maintains the same rotational positioning when reconstituted in vitro, it adopts multiple translational positions centered at about −110, suggesting that transcription factors determine its positioning in vivo (56).
Effect of Chromatin Structure on CPD Yield and Deamination Rate
Because the in vitro and in vivo deamination rates and photoproduct yields are not directly comparable due to uncertainty in the pH and buffer composition in vivo, we looked for relative changes between the CPD deamination rates and yields in vitro and in vivo that might be ascribed to chromatin structure. In doing so, two major differences were observed. The first was that the relative yield of CPD 2 was greatly diminished (about 3-fold) to the point where its deamination rate could not be determined with any degree of accuracy. We attributed this decrease to a possible interaction between amino acids in the H2A tail and minor groove of the DNA based on analysis of a high resolution nucleosome crystal structure. Although it has been well established that nucleosomes enhance and inhibit the yield of DNA photoproducts according to rotational position (17, 19), additional variations with translational position have been observed in a phased nucleosome with defined sequences (57), but the origin of these variations was not determined.
The second major observation was that CPD 1 appeared to deaminate about 2-fold more slowly relative to CPDs 3 and 4 in vivo and was the slowest among the three sites that could be measured. The relative change in deamination rate between in vivo and in vitro was greater for CPD 1 than for CPD 3 or 4 and was in accord with predictions based on the assignment of the dyad to −170 and previous studies of the effect of rotational position on deamination rate at the dyad with a reconstituted nucleosome in vitro (19). Unfortunately, there were no TCG sites in the nucleosome section of the FOS promoter that were at inside rotational positions, for which we would have expected much larger changes in deamination rates compared with outside positions. Additional studies will be required, therefore, to know more precisely how chromatin structure affects CPD formation and deamination as a function of both rotational and translational position.
Effect of Sequence Context on Deamination Rate
Although this study did not discover any dramatic effect of nucleosome structure on CPD deamination rates, our study did convincingly demonstrate that TCG sites are major sites of CPD photoproduct formation and that CPDs at these sites deaminate more rapidly than other sites, in accord with a previous in vitro study (13). In the particular 100-bp stretch of DNA that we investigated, there were 40 different C-containing dipyrimidine sites, in 21 of 48 possible sequence contexts of the type NPyPyN in the lower strand. Of these 40 sites, significant CPD photoproduct formation was only detected at eight sites, and rapid deamination was only observed at the TCG sites. In the only previous study of deamination rates in eukaryotic cells, deamination of C-containing CPDs was followed by LMPCR in exon 8 of the p53 gene (10), which is known not to have any well positioned nucleosomes (58). All of the 16 sites that gave measurable deamination were of the type PyCPy, 12 of which had deamination half-lives longer than 100 h, the remaining 4 of which had half-lives of about 15, 40, 50, and 60 h. The deamination rates of CPDs at TCG sites could not be determined, because the cytosines at these sites were fully methylated and not detectable with the method used. In a later study, deamination of CPDs at both unmethylated and methylated sites, including TCG sites, was detected, but the deamination rates were not determined (11).
Rapid deamination of a cytosine or 5-methylcytosine in a CPD should enhance its mutagenicity, as it will increase the probability that DNA polymerase η will encounter a deaminated CPD and insert an A opposite the U or T, resulting in a C to T mutation. CPDs that do not deaminate rapidly will have a higher probability of being repaired before deamination by the nucleotide excision repair system, thereby reducing their mutagenicity. In support of this model, a recent study has shown that UVB preferentially induces C to T mutations at TCG sites in a transgenic lacZ mouse with functional polymerase η and that the double knock-out mice show a greatly diminished preference for this mutation (20). Because all CG sites in the lacZ gene are methylated, the preference for this mutation is due, in part, to the enhanced yield of CPDs at the methylated CPD sites (59), together with its faster deamination than at any other sites, as shown in the present study.
Conclusion
CPDs at TCG sites are hot spots for C to T mutations, and we have shown that these sites are also hot spots for CPD formation and rapid deamination within a nucleosome in vivo, although at one site CPD formation was suppressed, which could explain mutation cold spots. We also showed that the relative deamination rates of three CPDs at the TCG sites were consistent with their rotational positions assigned by analysis of hydroxyl radical footprints obtained by a new in situ Fe-EDTA protocol, along with previous MNase and x-ray footprinting data. Because genomic studies indicate that fixed nucleosome translational settings are rare and may be confined to promoters or chromatin matrix elements, one might not expect to find enhanced CPD formation and deamination in exons caused by nucleosomes in bulk cell populations. It is possible, however, that DNA in some cells may bind to a nucleosome and exist in a rotational setting that would enhance the formation and deamination of a CPD that leads to a cancer-inducing mutation. Because it is also known that CPDs favor outside positions (60, 61), it is also possible that a newly formed CPD may induce nucleosome phasing and position itself at an outside position, which would enhance deamination and lead to a mutation. Clearly, more studies are needed to determine the effect of both translational and rotational positions on the formation and deamination of CPDs and to determine the influence of histone tails and histone H1 as well as nucleosome dynamics on these processes.
Author Contributions
S. P, Q. S., and V. J. C. performed the experiments, and S. P., Q. S., V. J. C., and J.-S. T. designed and analyzed the experiments. V. J. C., S. P., and J.-S. T. wrote and edited the manuscript.
Acknowledgments
We thank Alex Drohat for the plasmid containing the His-tagged human thymidine DNA glycosylase, Stephen Lloyd for the plasmid containing the His-tagged T4 endonuclease V, and Aziz Sancar for the plasmid containing the photolyase-maltose fusion protein.
This work was supported, in whole or in part, by the National Cancer Institute, National Institutes of Health Grant R01 CA40463 (to J.-S. T.). The authors declare that they have no conflicts of interest with the contents of this article.
- CPD
- cylcobutane pyridimidine dimer
- DNase I
- deoxyribonuclease I
- LMPCR
- ligation-mediated polymerase chain reaction
- MAPit
- methyltransferase accessibility protocol-individual template
- MNase
- microccocal nuclease
- PCI
- phenol/chloroform/isopropyl alcohol
- TSS
- transcription start site.
References
- 1.Pfeifer G. P., You Y. H., and Besaratinia A. (2005) Mutations induced by ultraviolet light. Mutat. Res. 571, 19–31 [DOI] [PubMed] [Google Scholar]
- 2.Vu B., Cannistraro V. J., Sun L., and Taylor J. S. (2006) DNA synthesis past a 5-methylC-containing cis-syn-cyclobutane pyrimidine dimer by yeast pol η is highly nonmutagenic. Biochemistry 45, 9327–9335 [DOI] [PubMed] [Google Scholar]
- 3.Yoon J. H., Prakash L., and Prakash S. (2009) Highly error-free role of DNA polymerase η in the replicative bypass of UV-induced pyrimidine dimers in mouse and human cells. Proc. Natl. Acad. Sci. U.S.A. 106, 18219–18224 [DOI] [PMC free article] [PubMed] [Google Scholar]
- 4.Ikehata H., and Ono T. (2011) The mechanisms of UV mutagenesis. J. Radiat. Res. 52, 115–125 [DOI] [PubMed] [Google Scholar]
- 5.Song Q., Sherrer S. M., Suo Z., and Taylor J. S. (2012) Preparation of site-specific T=mCG cis-syn cyclobutane dimer-containing template and its error-free bypass by yeast and human polymerase η. J. Biol. Chem. 287, 8021–8028 [DOI] [PMC free article] [PubMed] [Google Scholar]
- 6.Setlow R. B. (1966) Cyclobutane-type pyrimidine dimers in polynucleotides. Science 153, 379–386 [DOI] [PubMed] [Google Scholar]
- 7.Fix D., and Bockrath R. (1981) Thermal resistance to photoreactivation of specific mutations potentiated in E. coli B/r ung by ultraviolet light. Mol. Gen. Genet. 182, 7–11 [DOI] [PubMed] [Google Scholar]
- 8.Lemaire D. G., and Ruzsicska B. P. (1993) Kinetic analysis of the deamination reactions of cyclobutane dimers of thymidylyl-3′,5′-2′-deoxycytidine and 2′-deoxycytidylyl-3′,5′-thymidine. Biochemistry 32, 2525–2533 [DOI] [PubMed] [Google Scholar]
- 9.Peng W., and Shaw B. R. (1996) Accelerated deamination of cytosine residues in UV-induced cyclobutane pyrimidine dimers leads to CC→TT transitions. Biochemistry 35, 10172–10181 [DOI] [PubMed] [Google Scholar]
- 10.Tu Y., Dammann R., and Pfeifer G. P. (1998) Sequence and time-dependent deamination of cytosine bases in UVB-induced cyclobutane pyrimidine dimers in vivo. J. Mol. Biol. 284, 297–311 [DOI] [PubMed] [Google Scholar]
- 11.Lee D. H., and Pfeifer G. P. (2003) Deamination of 5-methylcytosines within cyclobutane pyrimidine dimers is an important component of UVB mutagenesis. J. Biol. Chem. 278, 10314–10321 [DOI] [PubMed] [Google Scholar]
- 12.Burger A., Fix D., Liu H., Hays J., and Bockrath R. (2003) In vivo deamination of cytosine-containing cyclobutane pyrimidine dimers in E. coli: a feasible part of UV-mutagenesis. Mutat. Res. 522, 145–156 [DOI] [PubMed] [Google Scholar]
- 13.Cannistraro V. J., and Taylor J. S. (2009) Acceleration of 5-methylcytosine deamination in cyclobutane dimers by G and its implications for UV-induced C-to-T mutation hotspots. J. Mol. Biol. 392, 1145–1157 [DOI] [PMC free article] [PubMed] [Google Scholar]
- 14.Luger K., Mäder A. W., Richmond R. K., Sargent D. F., and Richmond T. J. (1997) Crystal structure of the nucleosome core particle at 2.8 Å resolution. Nature 389, 251–260 [DOI] [PubMed] [Google Scholar]
- 15.Luger K. (2006) Dynamic nucleosomes. Chromosome Res. 14, 5–16 [DOI] [PubMed] [Google Scholar]
- 16.Andrews A. J., and Luger K. (2011) Nucleosome structure(s) and stability: variations on a theme. Annu. Rev. Biophys. 40, 99–117 [DOI] [PubMed] [Google Scholar]
- 17.Gale J. M., Nissen K. A., and Smerdon M. J. (1987) UV-induced formation of pyrimidine dimers in nucleosome core DNA is strongly modulated with a period of 10.3 bases. Proc. Natl. Acad. Sci. U.S.A. 84, 6644–6648 [DOI] [PMC free article] [PubMed] [Google Scholar]
- 18.Pehrson J. R. (1989) Thymine dimer formation as a probe of the path of DNA in and between nucleosomes in intact chromatin. Proc. Natl. Acad. Sci. U.S.A. 86, 9149–9153 [DOI] [PMC free article] [PubMed] [Google Scholar]
- 19.Song Q., Cannistraro V. J., and Taylor J. S. (2014) Synergistic modulation of cyclobutane pyrimidine dimer photoproduct formation and deamination at a TmCG site over a full helical DNA turn in a nucleosome core particle. Nucleic Acids Res. 42, 13122–13133 [DOI] [PMC free article] [PubMed] [Google Scholar]
- 20.Ikehata H., Chang Y., Yokoi M., Yamamoto M., and Hanaoka F. (2014) Remarkable induction of UV-signature mutations at the 3′-cytosine of dipyrimidine sites except at 5′-TCG-3′ in the UVB-exposed skin epidermis of xeroderma pigmentosum variant model mice. DNA Repair 22, 112–122 [DOI] [PubMed] [Google Scholar]
- 21.Syed S. H., Goutte-Gattat D., Becker N., Meyer S., Shukla M. S., Hayes J. J., Everaers R., Angelov D., Bednar J., and Dimitrov S. (2010) Single-base resolution mapping of H1-nucleosome interactions and 3D organization of the nucleosome. Proc. Natl. Acad. Sci. U.S.A. 107, 9620–9625 [DOI] [PMC free article] [PubMed] [Google Scholar]
- 22.Gaffney D. J., McVicker G., Pai A. A., Fondufe-Mittendorf Y. N., Lewellen N., Michelini K., Widom J., Gilad Y., and Pritchard J. K. (2012) Controls of nucleosome positioning in the human genome. PLoS Genet. 8, e1003036. [DOI] [PMC free article] [PubMed] [Google Scholar]
- 23.Herrera R. E., Nordheim A., and Stewart A. F. (1997) Chromatin structure analysis of the human c-fos promoter reveals a centrally positioned nucleosome. Chromosoma 106, 284–292 [DOI] [PubMed] [Google Scholar]
- 24.Komura J., and Ono T. (2003) Nucleosome positioning in the human c-Fos promoter analyzed by in vivo footprinting with psoralen and ionizing radiation. Biochemistry 42, 15084–15091 [DOI] [PubMed] [Google Scholar]
- 25.Davey C. A., Sargent D. F., Luger K., Maeder A. W., and Richmond T. J. (2002) Solvent mediated interactions in the structure of the nucleosome core particle at 1.9 Å resolution. J. Mol. Biol. 319, 1097–1113 [DOI] [PubMed] [Google Scholar]
- 26.Worthington E. N., Kavakli I. H., Berrocal-Tito G., Bondo B. E., and Sancar A. (2003) Purification and characterization of three members of the photolyase/cryptochrome family blue-light photoreceptors from Vibrio cholerae. J. Biol. Chem. 278, 39143–39154 [DOI] [PubMed] [Google Scholar]
- 27.Ryabinina O. P., Minko I. G., Lasarev M. R., McCullough A. K., and Lloyd R. S. (2011) Modulation of the processive abasic site lyase activity of a pyrimidine dimer glycosylase. DNA Repair 10, 1014–1022 [DOI] [PMC free article] [PubMed] [Google Scholar]
- 28.Morgan M. T., Bennett M. T., and Drohat A. C. (2007) Excision of 5-halogenated uracils by human thymine DNA glycosylase: robust activity for DNA contexts other than CpG. J. Biol. Chem. 282, 27578–27586 [DOI] [PMC free article] [PubMed] [Google Scholar]
- 29.Mueller P. R., Wold B., and Garrity P. A. (2001) Ligation-mediated PCR for genomic sequencing and footprinting. Curr. Protoc. Mol. Biol. 10.1002/0471142727.mb1503s56 [DOI] [PubMed] [Google Scholar]
- 30.Darst R. P., Pardo C. E., Pondugula S., Gangaraju V. K., Nabilsi N. H., Bartholomew B., and Kladde M. P. (2012) Simultaneous single-molecule detection of endogenous C-5 DNA methylation and chromatin accessibility using MAPit. Methods Mol. Biol. 833, 125–141 [DOI] [PubMed] [Google Scholar]
- 31.Pardo C. E., Carr I. M., Hoffman C. J., Darst R. P., Markham A. F., Bonthron D. T., and Kladde M. P. (2011) MethylViewer: computational analysis and editing for bisulfite sequencing and methyltransferase accessibility protocol for individual templates (MAPit) projects. Nucleic Acids Res. 39, e5. [DOI] [PMC free article] [PubMed] [Google Scholar]
- 32.Dixon W. J., Hayes J. J., Levin J. R., Weidner M. F., Dombroski B. A., and Tullius T. D. (1991) Hydroxyl radical footprinting. Methods Enzymol. 208, 380–413 [DOI] [PubMed] [Google Scholar]
- 33.Pondugula S., and Kladde M. P. (2008) Single-molecule analysis of chromatin: changing the view of genomes one molecule at a time. J. Cell. Biochem. 105, 330–337 [DOI] [PMC free article] [PubMed] [Google Scholar]
- 34.Pardo C. E., Nabilsi N. H., Darst R. P., and Kladde M. P. (2015) Integrated DNA methylation and chromatin structural analysis at single-molecule resolution. Methods Mol. Biol. 1288, 123–141 [DOI] [PubMed] [Google Scholar]
- 35.Nabilsi N. H., Deleyrolle L. P., Darst R. P., Riva A., Reynolds B. A., and Kladde M. P. (2014) Multiplex mapping of chromatin accessibility and DNA methylation within targeted single molecules identifies epigenetic heterogeneity in neural stem cells and glioblastoma. Genome Res. 24, 329–339 [DOI] [PMC free article] [PubMed] [Google Scholar]
- 36.Darst R. P., Haecker I., Pardo C. E., Renne R., and Kladde M. P. (2013) Epigenetic diversity of Kaposi's sarcoma-associated herpesvirus. Nucleic Acids Res. 41, 2993–3009 [DOI] [PMC free article] [PubMed] [Google Scholar]
- 37.Delmas A. L., Riggs B. M., Pardo C. E., Dyer L. M., Darst R. P., Izumchenko E. G., Monroe M., Hakam A., Kladde M. P., Siegel E. M., and Brown K. D. (2011) WIF1 is a frequent target for epigenetic silencing in squamous cell carcinoma of the cervix. Carcinogenesis 32, 1625–1633 [DOI] [PMC free article] [PubMed] [Google Scholar]
- 38.Kladde M. P., Xu M., and Simpson R. T. (1999) DNA methyltransferases as probes of chromatin structure in vivo. Methods Enzymol. 304, 431–447 [DOI] [PubMed] [Google Scholar]
- 39.Barrett T. E., Savva R., Panayotou G., Barlow T., Brown T., Jiricny J., and Pearl L. H. (1998) Crystal structure of a G:T/U mismatch-specific DNA glycosylase: mismatch recognition by complementary-strand interactions. Cell 92, 117–129 [DOI] [PubMed] [Google Scholar]
- 40.Bennett M. T., Rodgers M. T., Hebert A. S., Ruslander L. E., Eisele L., and Drohat A. C. (2006) Specificity of human thymine DNA glycosylase depends on N-glycosidic bond stability. J. Am. Chem. Soc. 128, 12510–12519 [DOI] [PMC free article] [PubMed] [Google Scholar]
- 41.Singer V. L., Jones L. J., Yue S. T., and Haugland R. P. (1997) Characterization of PicoGreen reagent and development of a fluorescence-based solution assay for double-stranded DNA quantitation. Anal. Biochem. 249, 228–238 [DOI] [PubMed] [Google Scholar]
- 42.Wells D., and McBride C. (1989) A comprehensive compilation and alignment of histones and histone genes. Nucleic Acids Res. 17, r311–r346 [DOI] [PMC free article] [PubMed] [Google Scholar]
- 43.Balasubramanian B., Pogozelski W. K., and Tullius T. D. (1998) DNA strand breaking by the hydroxyl radical is governed by the accessible surface areas of the hydrogen atoms of the DNA backbone. Proc. Natl. Acad. Sci. U.S.A. 95, 9738–9743 [DOI] [PMC free article] [PubMed] [Google Scholar]
- 44.Frederico L. A., Kunkel T. A., and Shaw B. R. (1990) A sensitive genetic assay for the detection of cytosine deamination: determination of rate constants and the activation energy. Biochemistry 29, 2532–2537 [DOI] [PubMed] [Google Scholar]
- 45.Bykov V. J., Sheehan J. M., Hemminki K., and Young A. R. (1999) In situ repair of cyclobutane pyrimidine dimers and 6-4 photoproducts in human skin exposed to solar simulating radiation. J. Investig. Dermatol. 112, 326–331 [DOI] [PubMed] [Google Scholar]
- 46.Mouret S., Charveron M., Favier A., Cadet J., and Douki T. (2008) Differential repair of UVB-induced cyclobutane pyrimidine dimers in cultured human skin cells and whole human skin. DNA Repair 7, 704–712 [DOI] [PubMed] [Google Scholar]
- 47.Ottinger L. M., and Tullius T. D. (2000) High-resolution in vivo footprinting of a protein-DNA complex using γ-radiation. J. Am. Chem. Soc. 122, 5901–5902 [Google Scholar]
- 48.Adilakshmi T., Lease R. A., and Woodson S. A. (2006) Hydroxyl radical footprinting in vivo: mapping macromolecular structures with synchrotron radiation. Nucleic Acids Res. 34, e64. [DOI] [PMC free article] [PubMed] [Google Scholar]
- 49.Ljungman M., and Hanawalt P. C. (1992) Efficient protection against oxidative DNA damage in chromatin. Mol. Carcinog. 5, 264–269 [DOI] [PubMed] [Google Scholar]
- 50.Valota A., Ballarini F., Friedland W., Jacob P., Ottolenghi A., and Paretzke H. G. (2003) Modelling study on the protective role of OH radical scavengers and DNA higher-order structures in induction of single- and double-strand break by γ-radiation. Int. J. Radiat. Biol. 79, 643–653 [DOI] [PubMed] [Google Scholar]
- 51.Kappen L. S., and Goldberg I. H. (1983) Deoxyribonucleic acid damage by neocarzinostatin chromophore: strand breaks generated by selective oxidation of C-5′ of deoxyribose. Biochemistry 22, 4872–4878 [DOI] [PubMed] [Google Scholar]
- 52.Hayes J. J., Clark D. J., and Wolffe A. P. (1991) Histone contributions to the structure of DNA in the nucleosome. Proc. Natl. Acad. Sci. U.S.A. 88, 6829–6833 [DOI] [PMC free article] [PubMed] [Google Scholar]
- 53.de Vries E., van Driel W., van den Heuvel S. J., and van der Vliet P. C. (1987) Contactpoint analysis of the HeLa nuclear factor I recognition site reveals symmetrical binding at one side of the DNA helix. EMBO J. 6, 161–168 [DOI] [PMC free article] [PubMed] [Google Scholar]
- 54.Blomquist P., Li Q., and Wrange O. (1996) The affinity of nuclear factor 1 for its DNA site is drastically reduced by nucleosome organization irrespective of its rotational or translational position. J. Biol. Chem. 271, 153–159 [DOI] [PubMed] [Google Scholar]
- 55.O'Donnell A., Yang S. H., and Sharrocks A. D. (2008) MAP kinase-mediated c-fos regulation relies on a histone acetylation relay switch. Mol. Cell 29, 780–785 [DOI] [PMC free article] [PubMed] [Google Scholar]
- 56.Schild-Poulter C., Sassone-Corsi P., Granger-Schnarr M., and Schnarr M. (1996) Nucleosome assembly on the human c-fos promoter interferes with transcription factor binding. Nucleic Acids Res. 24, 4751–4758 [DOI] [PMC free article] [PubMed] [Google Scholar]
- 57.Schieferstein U., and Thoma F. (1996) Modulation of cyclobutane pyrimidine dimer formation in a positioned nucleosome containing poly(dA·dT) tracts. Biochemistry 35, 7705–7714 [DOI] [PubMed] [Google Scholar]
- 58.Tornaletti S., Bates S., and Pfeifer G. P. (1996) A high-resolution analysis of chromatin structure along p53 sequences. Mol. Carcinog. 17, 192–201 [DOI] [PubMed] [Google Scholar]
- 59.Tommasi S., Denissenko M. F., and Pfeifer G. P. (1997) Sunlight induces pyrimidine dimers preferentially at 5-methylcytosine bases. Cancer Res. 57, 4727–4730 [PubMed] [Google Scholar]
- 60.Suquet C., and Smerdon M. J. (1993) UV damage to DNA strongly influences its rotational setting on the histone surface of reconstituted nucleosomes. J. Biol. Chem. 268, 23755–23757 [PubMed] [Google Scholar]
- 61.Hara R., and Sancar A. (2003) Effect of damage type on stimulation of human excision nuclease by SWI/SNF chromatin remodeling factor. Mol. Cell. Biol. 23, 4121–4125 [DOI] [PMC free article] [PubMed] [Google Scholar]