Background: GHS-R1a activates multiple signaling pathways mediating feeding and addictive behaviors.
Results: Some GHS-R1a ligands activate Gq but not Gi/o and fail to recruit β-arrestin2; others act as selective inverse agonists at Gq compared with G13.
Conclusion: Synthetic ligands can selectively activate or reverse Gq-dependent signaling at GHS-R1a.
Significance: Ligand-biased signaling can be exploited for the development of selective drugs to treat GHS-R1a-mediated disorders.
Keywords: bioluminescence resonance energy transfer (BRET), cell signaling, G protein, G protein-coupled receptor (GPCR), hormone receptor, G protein subtypes, ghrelin, signaling bias
Abstract
The G protein-coupled receptor GHS-R1a mediates ghrelin-induced growth hormone secretion, food intake, and reward-seeking behaviors. GHS-R1a signals through Gq, Gi/o, G13, and arrestin. Biasing GHS-R1a signaling with specific ligands may lead to the development of more selective drugs to treat obesity or addiction with minimal side effects. To delineate ligand selectivity at GHS-R1a signaling, we analyzed in detail the efficacy of a panel of synthetic ligands activating the different pathways associated with GHS-R1a in HEK293T cells. Besides β-arrestin2 recruitment and ERK1/2 phosphorylation, we monitored activation of a large panel of G protein subtypes using a bioluminescence resonance energy transfer-based assay with G protein-activation biosensors. We first found that unlike full agonists, Gq partial agonists were unable to trigger β-arrestin2 recruitment and ERK1/2 phosphorylation. Using G protein-activation biosensors, we then demonstrated that ghrelin promoted activation of Gq, Gi1, Gi2, Gi3, Goa, Gob, and G13 but not Gs and G12. Besides, we identified some GHS-R1a ligands that preferentially activated Gq and antagonized ghrelin-mediated Gi/Go activation. Finally, we unambiguously demonstrated that in addition to Gq, GHS-R1a also promoted constitutive activation of G13. Importantly, we identified some ligands that were selective inverse agonists toward Gq but not of G13. This demonstrates that bias at GHS-R1a signaling can occur not only with regard to agonism but also to inverse agonism. Our data, combined with other in vivo studies, may facilitate the design of drugs selectively targeting individual signaling pathways to treat only the therapeutically relevant function.
Introduction
Ghrelin, a peptide hormone mainly produced by the stomach (1), has emerged as an important gut-brain signal to control growth hormone secretion, food intake, and reward-seeking behaviors (2, 3). Ghrelin mediates these actions through the growth hormone secretagogue type 1a (GHS-R1a)2 receptor, a family A G protein-coupled receptor (GPCR) (4, 5). Because of its possible implication in several physiological disorders such as obesity and drug and alcohol addiction, GHS-R1a represents a major target for the development of therapeutic molecules (6). So far, several academic laboratories and pharmaceutical companies have developed synthetic molecules that display agonist, antagonist, and inverse agonist properties toward GHS-R1a intracellular signaling pathways. Some of these molecules display interesting properties with regard to food intake stimulation or inhibition (7–9), addiction to drugs, including alcohol and cocaine (10, 11), or growth hormone secretion (12). Given the pleiotropic actions of ghrelin, GHS-R1a synthetic ligands can be useful to block or activate the targeted physiological effect but can also lead to undesirable side effects. For instance, synthetic GHS-R1a antagonists that decrease food intake and fat storage may be good candidates to treat obesity but could have side effects due to their inhibitory action on growth hormone secretion. In a different way, agonists developed with the goal to stimulate hormone secretion for treating postmenopausal osteoporosis may have adverse effects by increasing body weight (13). Therefore, development of biased ligands that will selectively inhibit or activate only one or a subset of the GHS-R1a-dependent physiological responses could have significant therapeutic advantages. This aim is certainly now attainable because during the last decade many independent studies on GPCRs have described biased agonists that are selective of a given downstream signaling pathway (14, 15). Unlike the endogenous ligand that usually activates all the G protein and β-arrestin-dependent pathways, the synthetic ligands could thus selectively activate only some of them, for instance activation of β-arrestin with no effect on G proteins (16). Although molecular mechanisms responsible for ligand-directed functional selectivity are not fully understood, there is increasing evidence that biased activity results from selective stabilization of different receptor conformations that differ in their ability to couple to different downstream effectors (17–21). Importantly, in vivo studies demonstrated that side effects of classical drugs might be diminished by the use of biased molecules, suggesting this kind of molecules could have potential clinical application (16, 22). As for many other GPCRs, the rational design of biased ligands of the ghrelin receptor first requires identification of lead pathway-selective compounds. To identify such lead compounds, careful dissection of the different intracellular downstream signaling pathways of GHS-R1a is required. GHS-R1a is coupled to the Gq signaling pathway to trigger inositol phosphate production and intracellular calcium release (23). In the context of Gq signaling, an interesting particularity of GHS-R1a is its exceptionally high constitutive activity. Indeed, high basal levels of inositol phosphate production were detected in GHS-R1a-transfected cell lines (24, 25). Significant ligand-independent Gq activation and AP2 recruitment were also clearly demonstrated to occur with the purified GHS-R1a inserted in a lipid disc (26). As with many other GPCRs, GHS-R1a activates other G protein-dependent and -independent pathways besides the Gq-associated one. Indeed, following ghrelin stimulation, GHS-R1a activates ERK1/2 through β-arrestin-dependent (27, 28) and β-arrestin-independent (29) pathways. It also activates PI3K, PKCϵ, and Src through a Gi/o protein-dependent pathway (28, 30).
In this context, we investigated here the selectivity of a panel of GHS-R1a synthetic ligands toward arrestin and G protein-dependent pathways. We paid particular attention to the selectivity of ligands toward activation of several G protein subtypes and isoforms thanks to the use of recently developed G protein BRET-based biosensors that were recently developed (31, 32). Our data suggest that some synthetic GHS-R1a ligands are selective Gq agonists. We also identified ligands that displayed potential inverse agonist selectivity toward Gq compared with G13. The occurrence of such pathway-selective ligands questions the connection that could exist between the biased behavior of some ligands toward intracellular pathways and their selectivity toward food intake and GH secretion already demonstrated in vivo.
Experimental Procedures
Materials and Methods
Ghrelin(1–28) was purchased from PolyPeptide Laboratories, and MK-0677 (33) was from Axon MedChem, and [d-Arg1-d-Phe5,d-Trp7,9,Leu11]substance P (SPA) was from Bachem. JMV compounds were synthesized in our laboratory (IBMM, France). The pseudopeptide JMV 1843 was described previously by Guerlavais et al. (34); JMV 2959 was described previously by Moulin et al. (35), and JMV 3002, JMV 3018, and JMV 3011 were described previously by Moulin et al. (36). In compound JMV 4484, a second chiral center was introduced at position 3 of the 1,2,4-triazole scaffold. This chiral center contains an amino function, which was elongated by the Leu-Leu dipeptide, and a lysine residue was then introduced in the N-terminal part to mimic the peptide core of the substance P analog. Peptides KwFwLL-NH2 and K-(D-1Nal)-FwLL-NH2 were synthesized at Institut des Biomolécules Max Mousseron as described previously (37, 38).
The thromboxane A2 receptor agonist U46619 was purchased from Cayman Chemical. Arginine vasopressin was provided by Dr. B. Mouillac (IGF, Montpellier, France). Lipofectamine 2000, fetal bovine serum, antibiotics (penicillin and streptomycin), and DMEM were purchased from Invitrogen. Coelenterazine 400a (DeepblueC) was purchased from Interchim. IP-One HTRF kit and benzyl guanine-Tb3+-cryptate were provided by CisBio. BODIPY® FL GTPγS was from Invitrogen.
For experiments in lipid disc, Gαq and Gβ1γ2 subunits were produced in Sf9 cells as described (18). Gα13 was from Kerafast.
Plasmid Constructions
RLuc-β-arrestin2 cloned in PRK6 vector was a generous gift of Dr. M. A Ayoub (IGF, Montpellier, France). Human vasopressin V2 receptor cloned in PRK5 vector was provided by Dr. T. Durroux (IGF, Montpellier, France). Human GHS-R1a cloned in pcDNA3.1+ vector (pcDNA-GHS-R1a) was purchased from the cDNA Resource Center (University of Missouri). HA-GHS-R1a was generated by PCR using the following: 1) a sense oligonucleotide primer containing HindIII and EcoRI sites followed by a Kozac sequence, an ATG codon, an HA sequence, and nucleotides 1–25 of GHS-R1a; 2) an antisense oligonucleotide primer containing a BamHI site followed by a stop codon and nucleotides 1098–1072 of GHS-R1a. The PCR product was digested with HindIII and BamHI and cloned in HindIII-BamHI sites of pcDNA3+ vector (pcDNA-HA-GHS-R1a). To generate GHS-R1a-YFP, GHS-R1a sequence was amplified by PCR with a sense oligonucleotide containing an EcoRI site and an antisense oligonucleotide containing a BamHI site. The PCR fragment was digested with EcoRI and BamHI and inserted into EcoRI and BamHI sites of PRK6-YFP vector provided by Dr. M. A Ayoub (IGF, Montpellier, France). The A204E mutation was introduced in GHS-R1a (GHS-R1a-A204E) by PCR using pcDNA-GHS-R1a as a template and 30-mer forward and reverse oligonucleotide primers in Accuprime Pfx SuperMix solution (Invitrogen). SNAP-GHS-R1a was already described (39).
Cell Culture
HEK293T cells were maintained in DMEM Glutamax (Invitrogen) supplemented with antibiotics (50 μg/ml penicillin and 50 μg/ml streptomycin), 2 mm HEPES, 1% non-essential amino acids, and 10% heat-inactivated fetal calf serum.
Transfection
For immunoprecipitation and binding assays, transfections were performed in 96-well plates using cell density of 50,000 cells per well. Prior to cell plating, wells were pre-coated with poly-l-ornithine (50 μl of 10 mg/ml) for 30 min at 37 °C. Transfection mixes were prepared using cDNA encoding GHS-R1a, GHS-R1a A204E, or SNAP-GHS-R1a (200–300 ng) and Lipofectamine 2000 (Invitrogen) with a ratio 0.4 for cDNA (μg)/Lipofectamine (μl) in a total volume of 50 μl of OptiMEM culture medium per well. Prior to its addition in plates, the transfection mixture was preincubated for 20 min at room temperature. Then 100 μl of HEK293T cells at a density of 500,000 cells/ml were plated in each well and incubated at 37 °C under 5% CO2 for 48 h. Transfection condition for HTRF ligand binding was performed as described previously (39).
Ligand Binding Assay
Ki values were determined from binding competition experiments performed on intact HEK293T cells expressing the GHS-R1a using a Homogenous Time Resolved Fluorescence (HTRF) assay previously described (39). HTRF signal was collected in a PHERAstar microplate reader (BMG LABTECH). Ki values were obtained from binding curves using GraphPad Prism software (GraphPad Software, Inc., San Diego). The expression level (Bmax) of GHS-R1a expressed in HEK293T cells was determined by radioactive assay using 125I-His9 ghrelin as described previously (39).
Inositol Phosphate Assay
Inositol phosphate accumulation assay was carried out 48 h after transfection on adherent cells on a 96-well plate at a density of 50,000 cells/well. IP1 production was measured using the IP-One HTRF kit (Cisbio Bioassays Ref. 621PAPEC) as described previously (39). Briefly, cells were stimulated for 30 min at 37 °C with the ligand to be tested in 70 μl of IP1 stimulation buffer. An anti-IP1 antibody labeled with Lumi4-Tb (15 μl) and an IP1-d2 derivative (15 μl) were added to the cells. The medium was incubated for 1 h at room temperature. Signals at 665 and 620 nm were detected using a PHERAstar (BMG LABTECH) fluorescence reader. Values are expressed as ΔF. ΔF corresponded to (ratio 665 nm/620 nm of the assay − ratio 665 nm/620 nm of the negative control)/ratio 665 nm/620 nm of the negative control.
The negative control corresponded to the Lumi4-Tb blank and was used as an internal assay control. Inositol phosphate accumulation was expressed as the percentage of the maximal ghrelin response using the formula (ΔF mock cells − ΔF receptor-transfected cells)/(ΔF mock cells − ΔF maximal ghrelin stimulation for receptor-transfected cells).
ERK1/2 Assay
ERK1/2 assay was carried out 48 h after transfection on adherent cells in 96-well white plates (Greiner Bio One) at a density of 50,000 cells/well. ERK1/2 phosphorylation was measured after 10 min of stimulation with ligands using an HTRF-based phospho-ERK (Thr-202/Tyr-204) cellular assay kit according to the manufacturer's instructions (Cisbio Bioassays). Briefly, the signal was detected between anti-phospho-ERK antibody labeled with Eu3+ cryptate donor and anti-ERK1/2 antibody labeled with d2 acceptor. Signals at 665 and 620 nm were measured using a PHERAstar (BMG Labtech) fluorescence reader. Values were expressed as ratio of 665 nm/620 nm × 1000.
Arrestin Recruitment Assay
The interaction between GHS-R1a-YFP and Rluc-β-arrestin2 was measured in HEK293T by BRET1 in 96-well white plates (Greiner Bio-One). Briefly, cells were transfected by Lipofectamine with 100 ng of GHS-R1a-YFP and 5 ng of Rluc-β-arrestin2. 48 h after transfection, cells were washed with PBS and then incubated for 45 min at 37 °C with 50 μl of ligand in DMEM, 0.1% BSA. After stimulation, cells were washed with 100 μl of PBS. 50 μl of a 0.5 mm coelenterazine H (Interchim) solution in PBS was then added to the cells and the signal measured with a Mithras LB 940 plate reader (Berthold Biotechnologies) that allows sequential integration of luminescence signal (five cycles of 0.05 s) with two filter settings (Rluc filter, 485 ± 20 nm, and YFP filter, 530 ± 25 nm). The BRET ratio was defined as the difference of the ratio 530 nm/485 nm of the co-transfected Rluc and YFP proteins, and the ratio of the Rluc protein alone. Results are expressed in mBRET corresponding to the ratio (530 nm/485 nm) × 1000.
G Protein Activation BRET Assay
G protein activation was measured with the BRET assay previously described (31, 32). Briefly, HEK293T cells grown in 10-cm culture dishes were co-transfected by Lipofectamine 2000 with GHS-R1a and G protein subunits (Rluc8-α, -β1, and γ2-GF10). 48 h after transfection, cells were washed with PBS, detached with PBS containing 5 mm EDTA, and resuspended in PBS supplemented with 5 mm EDTA and 0.1% (w/v) glucose (buffer A) at room temperature. Cells were then distributed in a 96-well white plate (300,000 cells per well). For kinetic analyses, 5 μm deep blue C (coelenterazine 400a, Interchim) were added, and the plate was immediately loaded in a Mithras LB 940 multimode microplate reader (Berthold) or a PHERAstar microplate reader (BMG Labtech). Then 10 μl of ligand solution (1 μm) was injected after 30 s of reading, and the signal was recorded for 90 s. The BRET signal was obtained by calculating the ratio of GFP10 emission (515 ± 10 nm) over Rluc8 light emission (400 ± 10 nm) at 1.6-s intervals. For end point measurements, cells (300,000) in 80 μl of buffer A were incubated in a 96-well plate with 10 μl of ligand solution in buffer A at room temperature for 3–15 min. Then, 10 μl of deep blue C solution (50 μm) was added, and the BRET2 signal was recorded in a PHERAstar microplate reader (BMG Labtech). The BRET signal was calculated as the ratio of emission GFP10 (510–530 nm) to RLuc8 (410–480 nm) recorded five times at 0.5-s intervals.
Quantification of Cell Surface Receptors by ELISA
24 h post-transfection with pcDNA3.1(+) (control) or vectors encoding N-terminally HA-tagged GHSR1a either in the presence of Gαq-Rluc8 or Gα13-Rluc8, untagged GFP10-Gγ2 and untagged Gβ1, cells were split into 24-well plates. Cells were fixed in 4% paraformaldehyde, saturated with PBS containing 1% bovine serum albumin, and incubated with the primary anti-HA antibody (clone 16B12, Covance) and then with HRP-labeled secondary antibody (Sigma). After washing, cells were incubated with HRP substrate, 3,39,5,59-tetramethylbenzidine. The reaction was stopped with 1 n HCl, and the plates were read at 450 nm in a microplate reader (Varioscan Flash, Thermo Electron). The 570-nm optic density (background) was subtracted.
G Protein Activation Assay in Lipid Discs
The human GHS-R1a receptor was expressed in Escherichia coli and assembled as a monomer into lipid discs as described (26). GTPγS binding assays were carried out by monitoring changes in the fluorescence emission of BODIPY® FL GTPγS (26). In these assays, ligand concentrations of 1 μm and 1:10 receptor/G protein molar ratios with receptor concentrations in the 20 nm range were used.
Quantification of Ligand Bias
EC50 and Emax values were estimated from dose-response curves using the nonlinear curve fitting equation (three parameters) in GraphPad Prism (Version 5.0).
Ligand bias was quantify by fitting ligand concentration-response curve using the method developed by Kenakin et al. (40), which is based on the operational model of agonism (41). The transduction coefficient log (τ/KA) was derived using the operational model equation in GraphPad Prism. This transduction coefficient represents the ability of an agonist to stimulate a given signaling pathway. τ represents an index of coupling efficiency of the agonist; KA is the functional equilibrium dissociation constant of the agonist. To eliminate the impact of the different sensitivities of the assays used, the log(τ/KA) value determined for one ligand at a given pathway was normalized to that determined for a reference ligand at the same pathway. In our study, the reference ligand was ghrelin. By subtracting log(τ/KA) of ghrelin from log(τ/KA) of each compound, a Δlog(τ/KA) value was obtained that gave a within-pathway comparison of transduction efficiency of ligands as shown in Equation 1,
 |
Finally, the bias of each ligand between different signaling pathways was obtained in the form ΔΔlog(τ/KA) as shown in Equation 2,
where P1 is pathway 1, and P2 is pathway 2.
No ligand bias at two different pathways compared with ghrelin will result in a value of ΔΔlog(τ/KA)P1–P2 not significantly different from 0. Statistical analysis was performed using a two-way unpaired Student's t test. Difference were considered significant when p was <0.05.
Bias factor (or fold change in bias) was calculated as shown in Equation 3,
When a ligand promoted a detectable stimulation of one pathway (P1) but did not promoted any detectable stimulation at the other pathway (i.e. P2), a bias factor of this ligand between these two pathways could not be calculated.
Results
Binding Properties of GHS-R1a Ligands
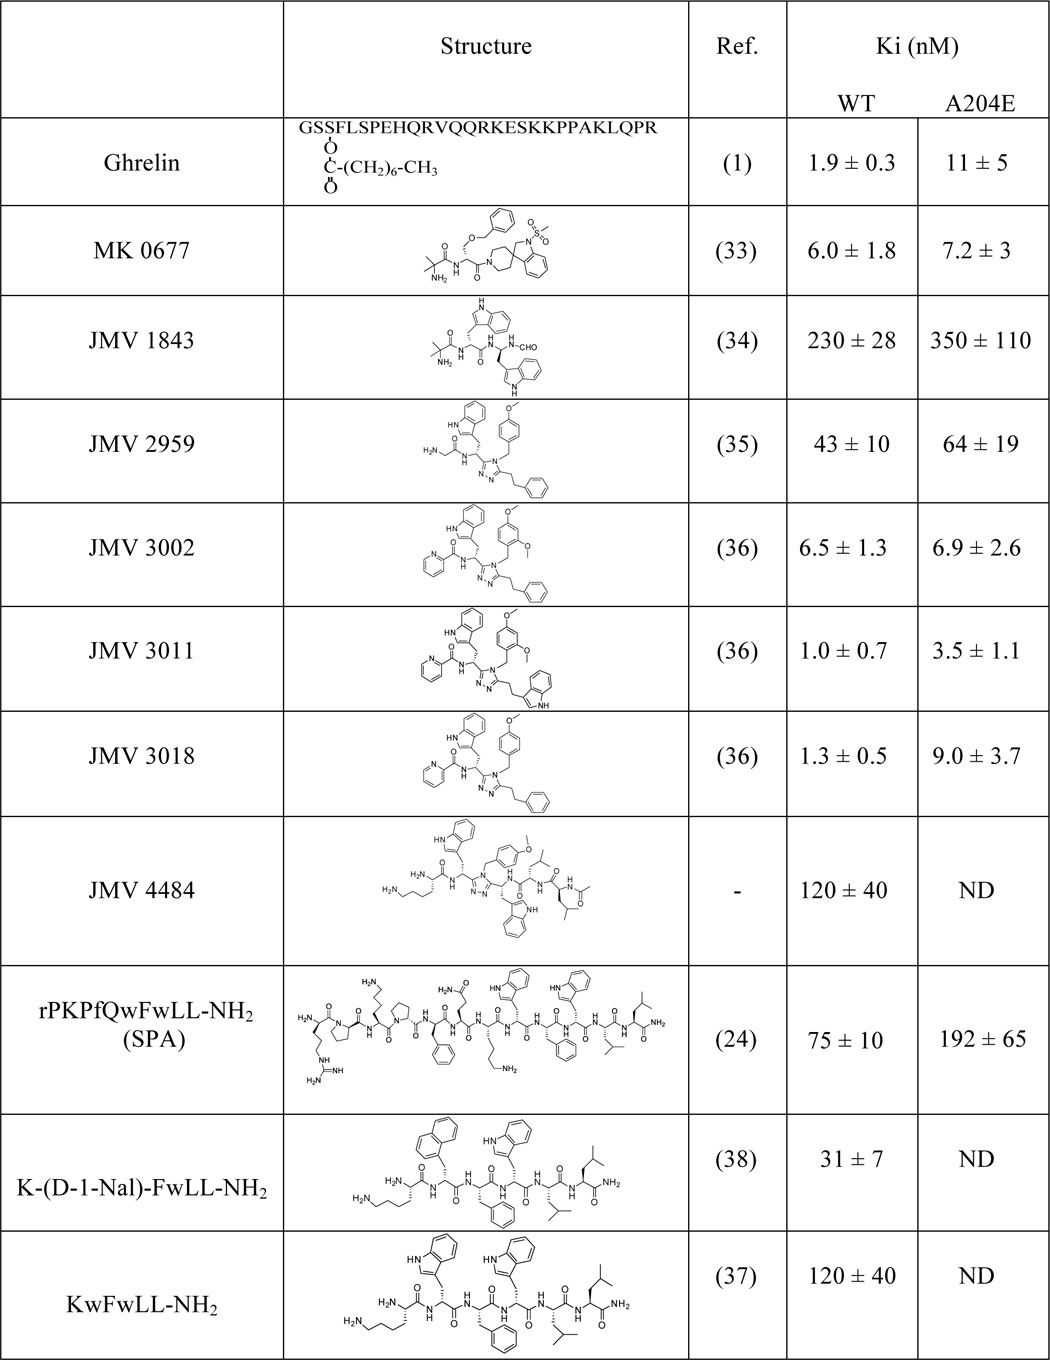
The binding affinities (Ki values) of the GHS-R1a ligands used all along this study are reported in Table 1.
TABLE 1.
Structures and binding properties of the GHS-R1a ligands
Structures of the GHS-R1a ligands are described in detail in Refs. 1, 24, 33–38. Ki values were determined in this study from competition binding experiments performed by HTRF-based ligand binding assay on HEK293T cells expressing WT GHS-R1a or its A204E mutant (see “Experimental Procedures”). Values are mean ±S.E. of at least three independent experiments performed in triplicate. ND, not determined.
Efficacy of GHS-R1a Ligands toward Inositol Phosphate Production
First, we tested a panel of GHS-R1a ligands for their efficacy to stimulate Gq/G11 signaling by measuring inositol phosphate production in HEK293T cells transiently expressing GHS-R1a.
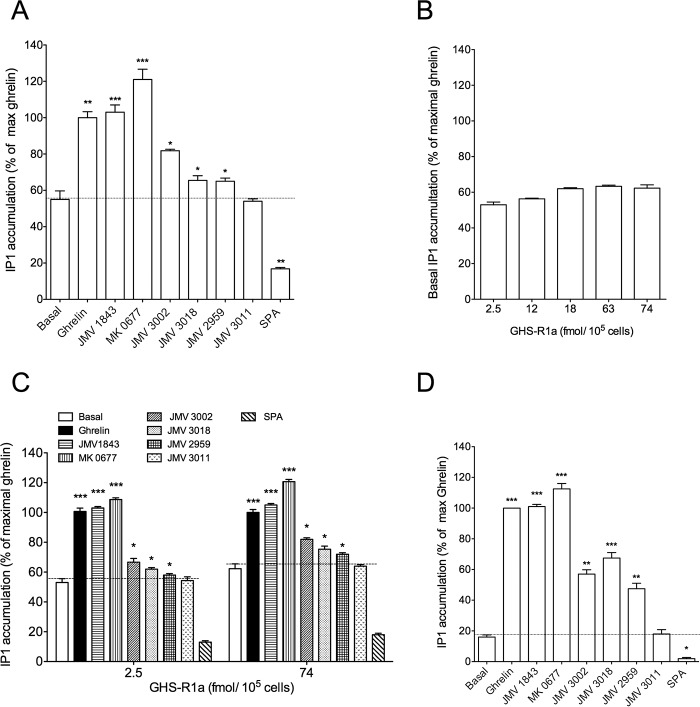
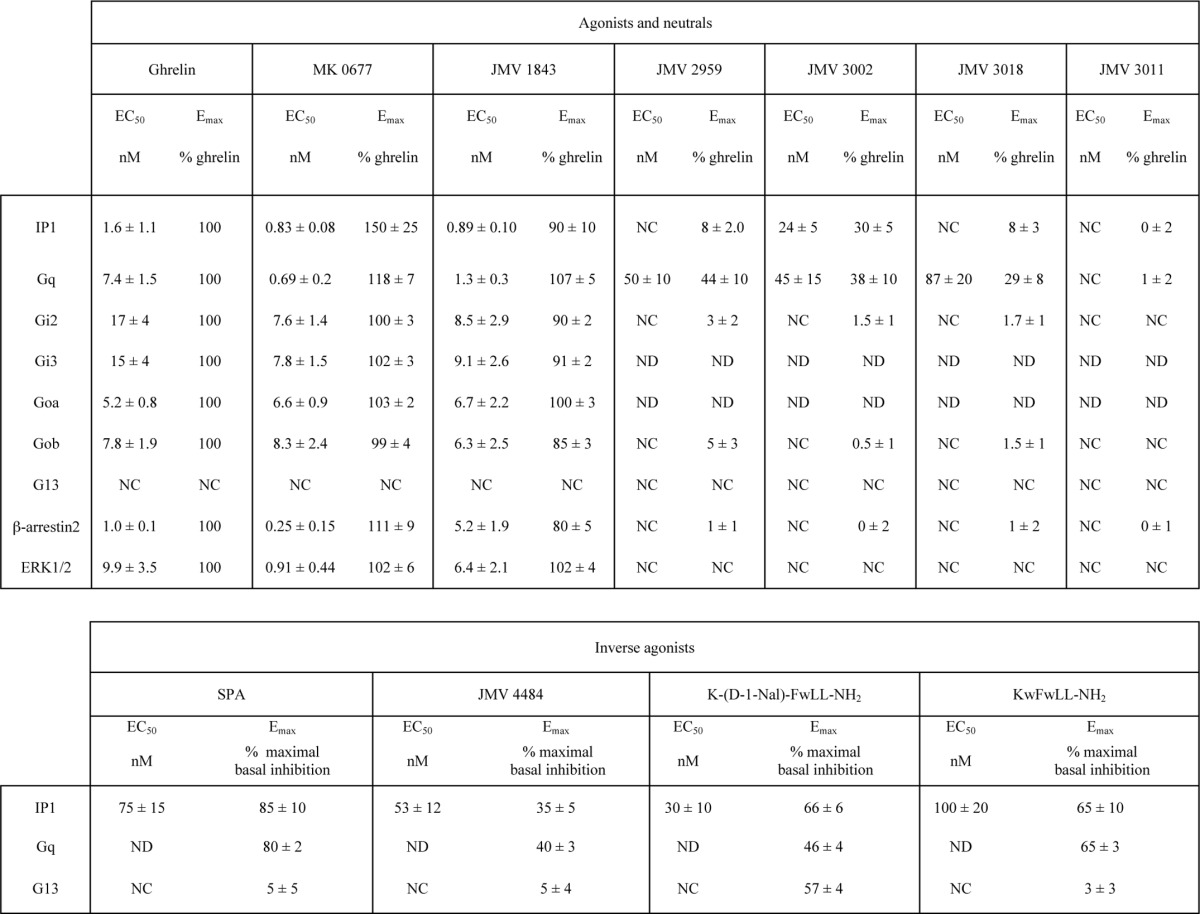
As already published, GHS-R1a-expressing cells displayed a high basal level of inositol phosphate production compared with untransfected cells and this basal activity was reversed in the presence of the inverse agonist SPA (Fig. 1A). Thus, in the HEK293T cells used all along this study, the GHS-R1a displayed high constitutive activity that amounts to 50–70% of the maximal response promoted by ghrelin (Fig. 1A). The pseudo-peptide JMV 1843 stimulated inositol phosphate production to the same extent as ghrelin, whereas the efficacy of the non-peptide MK-0677 was slightly higher than that of ghrelin (150 ± 25% compared with 100% ghrelin stimulation over basal) (Fig. 1A and Table 2). Compared with ghrelin, JMV 1843 and MK-0677 compounds thus behaved as full and super-agonist, respectively, compared with ghrelin on the inositol phosphate pathway. When tested at a 10−6 m maximal dose, JMV 3011 had no effect, whereas JMV 3002, JMV 3018, and JMV 2959 induced an increase of inositol phosphate production over basal with a partial agonist effect compared with ghrelin (Fig. 1A and Table 2). Thus, JMV 3002, JMV 3018, and JMV 2959 can thus be considered as partial agonists on the inositol phosphate (IP) pathway (Fig. 1A and Table 2). However, the partial agonist efficacy of these ligands was sometime undetectable when the basal IP1 production reached 60% of the maximal ghrelin response, a level often found in these experiments. We thus postulated that the high level of basal IP1 production might mask this partial agonist effect of ligands. Therefore, we checked whether we could decrease the constitutive activity of GHS-R1a by decreasing the expression level of GHS-R1a.
FIGURE 1.
Efficacy of GHS-R1a ligands to promote inositol phosphate production. Inositol phosphate (IP1) production was promoted by ligands at a maximal dose (10−6 m) in cells expressing the GHS-R1a (A) or the A204E GHS-R1a mutant (D). Basal level of IP1 production was measured in cells expressing different amounts of GHS-R1a (B). IP1 production was promoted by ligands at a maximal dose (10−6 m) in cells expressing low and high amount of GHS-R1a (C). IP1 production was measured with an HTRF assay in HEK293T cells treated with ligands for 30 min at 37 °C. Data are expressed as the percentage of ghrelin maximal response. Basal represents IP1 production measured in non-stimulated HEK293T cells expressing GHS-R1a receptors. 0% is defined as the basal IP1 production of mock-transfected HEK293T cells (cells transfected with an empty pcDNA3.1 (+) vector). Values are mean ± S.E. of three independent experiments performed in triplicate. Statistical significance between stimulated and non-stimulated cells was assessed using a one-way ANOVA followed by Dunnett's post hoc test (***, p < 0.001; **, p < 0.01; *, p < 0.1).
TABLE 2.
Potencies and maximal efficacies of GHS-R1a ligands
EC50 and Emax values were determined from dose-response curves performed in HEK293T cells expressing GHS-R1a as described under “Experimental Procedures.” For the agonist and neutral compounds, Emax is expressed as the percentage of maximal ghrelin. For the inverse agonists compounds, Emax is expressed as the maximal basal inhibition (100% inhibition corresponding to the basal of mock-transfected HEK293T cells). Values are mean ± S.E. of three independent experiments performed in triplicate. ND, not determined; NC, cannot be determined.
The basal level of IP1 production of HEK293T cells expressing the GHS-R1a represented 55 ± 3 and 62 ± 4% of the maximal ghrelin for a receptor expression level of 2.5 and 74 fmol/105 cells, respectively. Thus, decreasing the receptor expression level by a factor 29.6 did not change significantly the level of constitutive activity expressed as the % of maximal ghrelin (Fig. 1B). This is due to the fact that decreasing the receptor expression level induced a concomitant decrease of the basal level of IP1 production with a concomitant decrease of the maximal level promoted by ghrelin. Decreasing the receptor expression level did not allow us to better visualize the partial agonist character of the ligands (Fig. 1C). We therefore decided to evaluate the efficacy of these ligands to promote IP1 production on a GHS-R1a mutant (GHS-R1a A204E) with a decreased basal activity. The A204E mutation decreased the basal activity of the receptor without changing its ability to respond to ghrelin compared with the WT receptor (27, 42). As shown in Fig. 1D, the basal level of IP1 production of HEK293T cells expressing the GHS-R1a A204E was highly decreased compared with the WT receptor, whereas both the efficacy and potency of full agonists to induce IP1 production were unaffected. Interestingly, as shown in Fig. 1D, although JMV 3011 remained neutral, the partial agonist activity of JMV 3002, JMV 3018, and JMV 2959 was unambiguously detected with the GHS-R1a A204E mutant. Although the binding characteristics (Ki) of ligands are quite similar between the WT and the A204E mutant receptors (Table 1), we cannot totally exclude that the A204E mutation induces subtle changes in binding and signaling properties of ligands. Nevertheless, our observation suggested that an extremely high constitutive activity might hide the partial agonistic character of some ligands. The behavior of the different ligands with regard to GHS-R1a A204 was confirmed by testing them in competition with ghrelin. In this case, JMV 3011 fully antagonized the effect of ghrelin at promoting IP1 production, whereas ligands JMV 3002, JMV 3018, and JMV 2959 antagonized only partially the ghrelin effect (Fig. 3A).
FIGURE 3.
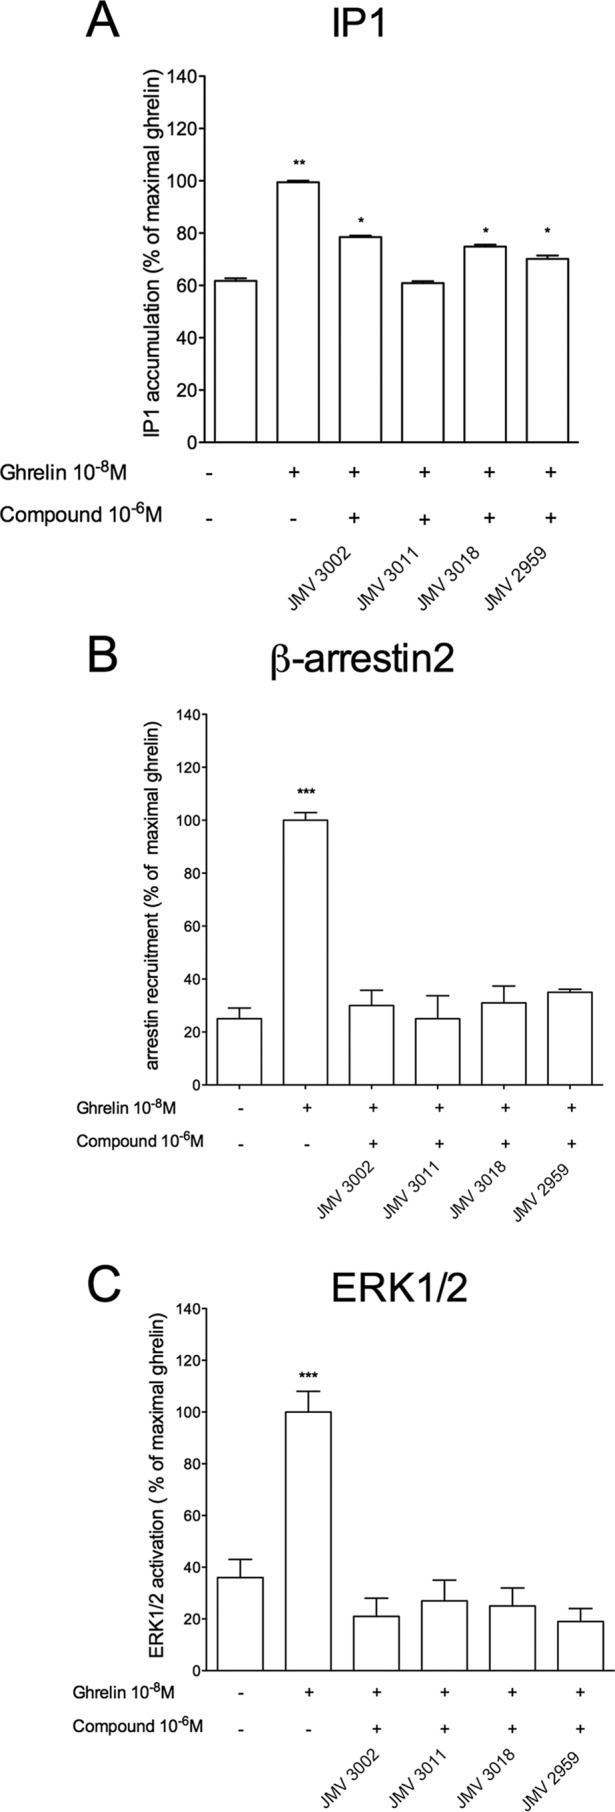
Antagonist efficacy of JMV compounds toward ghrelin-promoted IP1 production, β-arrestin2 recruitment, and ERK1/2 phosphorylation. IP1 production (A), β-arrestin2 recruitment (B), and ERK1/2 phosphorylation (C) were measured as described in Figs. 1 and 2 and under the “Experimental Procedures.” HEK293T cells expressing the GHS-R1a were stimulated with ghrelin at 10−8 m in the absence or in the presence of 10−6 m JMV compounds. Data are expressed as the percentage of maximal ghrelin-induced stimulation. Bars and error bars represent the mean ± S.E. of three independent experiments, each performed in triplicate. Statistical significance between stimulated and non-stimulated cells was assessed using a one way ANOVA followed by Dunnett's post hoc test (***, p < 0.001; **, p < 0.01; *, p < 0.1).
Efficacy of GHS-R1a Ligands toward β-Arrestin2 Recruitment and ERK1/2 Activation
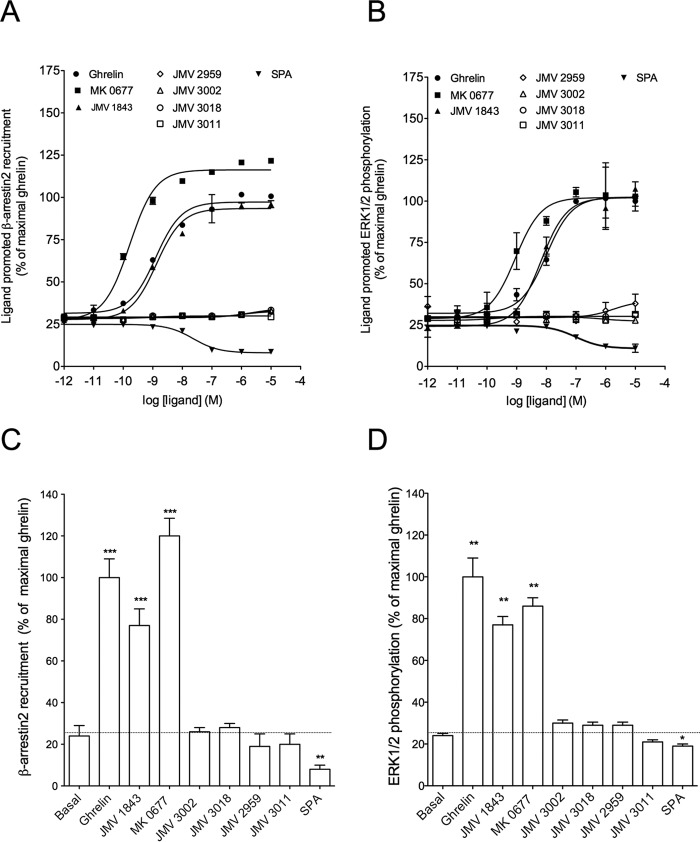
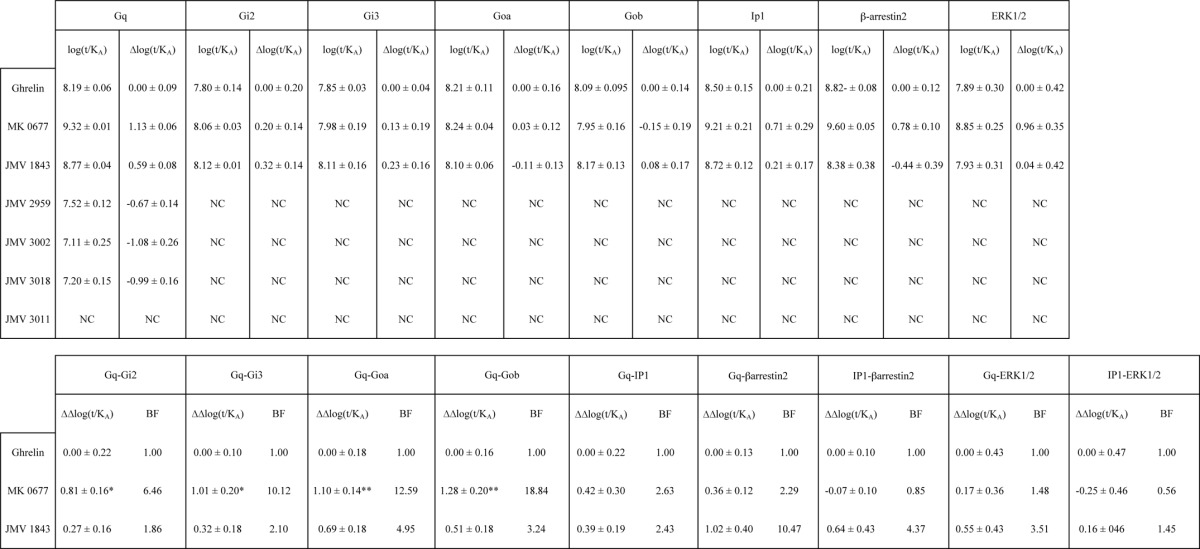
As reported previously, ghrelin stimulation promotes β-arrestin2 recruitment to GHS-R1a (26, 27). The level of constitutive β-arrestin2 recruitment was lower than that of IP1 production. SPA reduced almost to zero the basal level of β-arrestin2 recruitment, suggesting that this ligand displayed inverse agonist efficacy toward β-arrestin2 recruitment also (Fig. 2, A and C). As expected, ghrelin, JMV 1843, and MK-0677 promoted a large increase in β-arrestin2 recruitment to GHS-R1a (Fig. 2, A and C). As observed for IP1 production, MK-0677 behaved as a super-agonist toward β-arrestin-2 recruitment compared with ghrelin and JMV 1843. In contrast, no β-arrestin2 recruitment was observed upon stimulation with JMV 3011, JMV 3002, JMV 3018, and JMV 2959 (Fig. 2, A and C). Thus, JMV 3011 was neutral with regard to both IP1 production and β-arrestin2 recruitment, whereas JMV 3002, JMV 3018, and JMV 2959 were partial agonists on IP1 production but neutral toward β-arrestin2 recruitment (Figs. 1 and 2, A and B). Because it was reported that GHS-R1a activated ERK1/2 through Gq/11, Gi, and arrestin-dependent pathways (28, 43, 44), we tested the efficacy of our ligands toward ERK1/2 activation. All compounds displayed comparable efficacy to promote β-arrestin2 recruitment (Table 2 and Fig. 2, A and C) and ERK1/2 phosphorylation (Fig. 2, B and D). Although ghrelin, MK-0677, and JMV 1843 promoted ERK1/2 phosphorylation, ligands JMV 3002, JMV 3018, JMV 2959, and JMV 3011 were neutral toward ERK1/2 phosphorylation (Fig. 2, B and D). When tested in competition with ghrelin, JMV 3002, JMV 3018, JMV 2959, and JMV 3011 totally antagonized both β-arrestin2 recruitment (Fig. 3B) and ERK1/2 phosphorylation promoted by ghrelin (Fig. 3C). Taken together, these data indicate that GHS-R1a partial agonists of IP1 production are neutral/antagonists of β-arrestin2 recruitment and ERK1/2 phosphorylation. Although these results suggest that these ligands are de facto biased toward IP1 production over β-arrestin-2 recruitment and ERK1/2 phosphorylation, a bias factor could not be calculated because no dose-response curve could be obtained for β-arrestin2 and ERK1/2 (Table 3). Quantification of bias could be done for JMV 1843 and MK-0677 only and indicated that these ligands were not significantly biased toward Gq activation and IP1 production relative to β-arrestin2 recruitment and ERK1/2 phosphorylation (Table 3).
FIGURE 2.
Efficacy of GHS-R1a ligands to promote β-arrestin2 recruitment and ERK1/2 phosphorylation. β-Arrestin2 recruitment dose-response curves (A) and maximal responses with 10−6 m of ligand are shown (C). β-Arrestin2 recruitment to GHS-R1a was measured with a BRET1 assay upon ligand stimulation for 45 min at 37 °C in HEK293T cells expressing the GHS-R1a. ERK1/2 phosphorylation dose-response curves (B) and maximal responses with 10−6 m of ligand are shown (D). ERK1/2 phosphorylation was measured with an HTRF assay upon ligand stimulation for 10 min at 37 °C in HEK293T cells expressing the GHS-R1a. All data are expressed as the percentage of maximal ghrelin-induced stimulation. Dose-response curves (A and B) are representative of three experiments and graphs of maximal responses (C and D). Values are mean ± S.E. of three independent experiments performed in triplicate. 0% represents the basal of mock-transfected HEK293T cells. Statistical significance between stimulated and non-stimulated cells was assessed using a one-way ANOVA followed by Dunnett's post hoc test (***, p < 0.001; **, p < 0.01; *, p < 0.1).
TABLE 3.
Bias factors of GHS-R1a ligands
Data were analyzed using the operational model with ghrelin as the reference ligand as described under “Experimental Procedures.” Quantification of bias was only possible for ghrelin, MK-0677, and JMV 1843. Values are mean ± S.E. of three independent experiments performed in triplicate. Statistical analysis was performed using a two-way unpaired Student's t test. NC means cannot be determined. **, p < 0.01; *, p < 0.05. BF = 10ΔΔlog(τ/KA).
Activation of G Protein Subtypes and Isoforms by GHS-R1a, a Study with G Protein Activation BRET Biosensors
To test GHS-R1a ligands on the activation of different G protein subtypes besides Gq, we then used a BRET2-based assay that monitors conformational changes of G proteins upon activation (31, 32). This BRET assay measured a BRET signal between Rluc8 fused to the α subunit and GFP10 fused to the β2 subunit, in an Rluc8-α, -β1, and γ2-GFP10 complex (see under “Experimental Procedures”). When the three G protein subunits were transfected in HEK293T cells, a high BRET basal signal was detected due to the close proximity of RLuc8 and GFP10 in the inactive Gαβγ trimer. G protein activation then resulted in a large decrease of the BRET signal due to conformational changes within the G protein trimer with the α subunit moving away from the βγ complex (31).
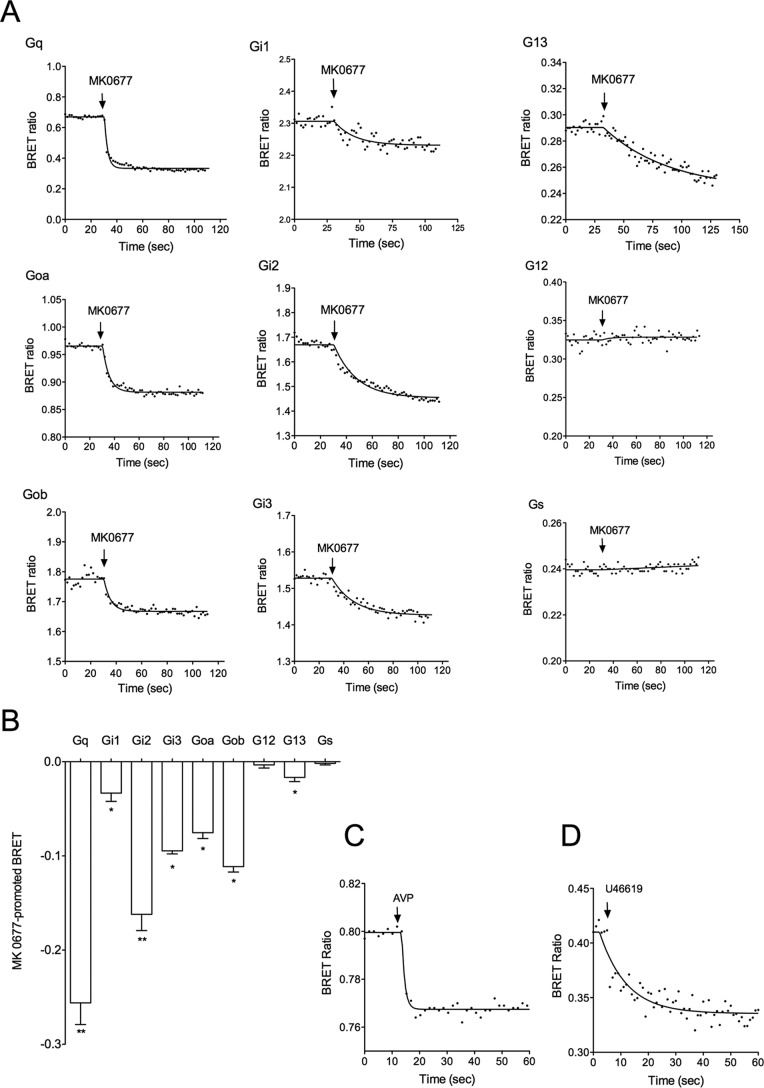
Using this approach, we revisited the GHS-R1a-G protein coupling. As expected, GHS-R1a stimulation with either ghrelin or MK-0677 agonists induced a large decrease of the BRET signal with the Gq biosensor confirming that GHS-R1a was indeed a typical Gq-coupled GPCR (Fig. 4). A decrease of the BRET signal was also detected for Gi1, Gi2, Gi3, Goa, Gob, and G13 isoforms, confirming more directly than in previous studies that GHS-R1a can couple to Gi and Go proteins. Importantly, a modest albeit significant decrease of the BRET signal was observed for G13, confirming that GHS-R1a activates G13 also (Fig. 4, A and B). In contrast, no variation of the BRET signal was observed for G12 and Gs. Because it was reported in the literature that GHS-R1a activates Gs-dependent pathways in some cell systems, we questioned whether the absence of Gs activation could result from a default in the biosensor. To address this point, we applied our BRET approach to the detection of Gs coupling to a typical Gs-coupled receptor control, the vasopressin V2 receptor. As shown in Fig. 4C, a large decrease of the BRET signal was observed on HEK293T cells co-transfected with V2R and the Gs biosensor following vasopressin stimulation. This confirmed that the Gs biosensor was an appropriate tool to detect Gs coupling and therefore suggested that GHS-R1a was unable to directly activate Gs, at least in HEK293T cells. We also confirmed that the absence of G12 stimulation was not due to a non-functioning G12 biosensor. Indeed, using the same experimental conditions with HEK293T cells co-expressing the thromboxane A2 α subtype (TPα) receptor and the G12 sensor, stimulation with the agonist U46619 triggering a decrease of BRET signal was easily detected as already described (32). This indicates that the G12 biosensor is also functional, suggesting that GHS-R1a is not coupled to G12 (Fig. 4D).
FIGURE 4.
Activation of G protein subtypes and isoforms by GHS-R1a. A, G protein activation kinetics was measured by BRET2 using G protein activation biosensors as described under “Experimental Procedures.” HEK293T cells co-expressing both the GHS-R1a and the G protein biosensor were stimulated by the GHS-R1a agonist MK-0677 (10−6 m). Data are representative of three to eight independent experiments. B, BRET maximal signal promoted by 10−6 m MK-0677 on HEK293T cells co-expressing GHS-R1a and G protein biosensors. Results are expressed as the difference in BRET ratio measured in the presence and in the absence of ligand stimulation for each G protein type (mean ± S.E.). Statistical significance between stimulated and non-stimulated cells was assessed using a paired Student's t test (**, p < 0.01; *, p < 0.05). C, Gs activation by the vasopressin V2 receptor. HEK293T cells co-expressing the V2 vasopressin receptor and Gs biosensor were stimulated by 10−6 m Arg-vasopressin, and the BRET signal was recorded as described in A. D, G12 activation by the thromboxane A2 α type (TPα) receptor: HEK293T cells co-expressing the TPα receptor and G12 biosensor were stimulated by 10−6 m U46619, and the BRET signal was recorded at described in A.
Selectivity of GHS-R1a Ligands toward Gq and IP1 Production
Although IP production was routinely used to measure Gq/11-mediated signaling pathways, it was interesting to compare the behavior of our ligands in the Gq activation and IP1 production assays to assess whether the efficiency of ligands to activate Gq is transmitted all along the PLCβ-inositol phosphate pathway. Comparison of transduction efficiency (Δlog(τ/KA)) at Gq activation and IP1 production was only possible for ghrelin, MK-0677, and JMV 1843. Indeed, no robust IP1 production dose-response curves could be obtained for JMV 2959, JMV 3002, and JMV 3018. Ghrelin, MK-0677, and JMV 1843 displayed similar potency and efficacy for both Gq activation and IP1 with MK-0677 displaying a higher efficacy and being more potent than JMV 1843 and ghrelin at both pathways (Fig. 5 and Table 2 for EC50 and Emax values). Quantification of bias demonstrated no selectivity of MK-0677 and JMV 1843 toward Gq activation and IP1 production compared with the reference ligand ghrelin (Table 3). As indicated above, quantification of bias was not possible for JMV 2959, JMV 3002, JMV 3011, and JMV 3018 (Table 3).
FIGURE 5.
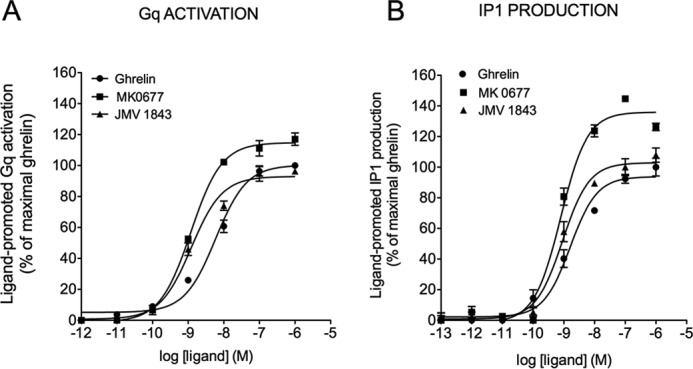
Efficacy and potency of ghrelin, MK-0677, and JMV 1843 toward Gq activation and IP1. A, dose-dependent Gq activation measured by BRET2 in HEK293T cells co-expressing both the GHS-R1a and Gq biosensor. B, dose-dependent IP1 measured by HTRF in HEK293T cells expressing the GHS-R1a. The zero value corresponds to basal non-stimulated HEK293T cells expressing the GHS-R1a. Curves are representative of three independent experiments, each performed in triplicate. Values of EC50 and Emax are reported in Table 2.
Selectivity of GHS-R1a Ligands toward Gq, Gi, and Go Activation
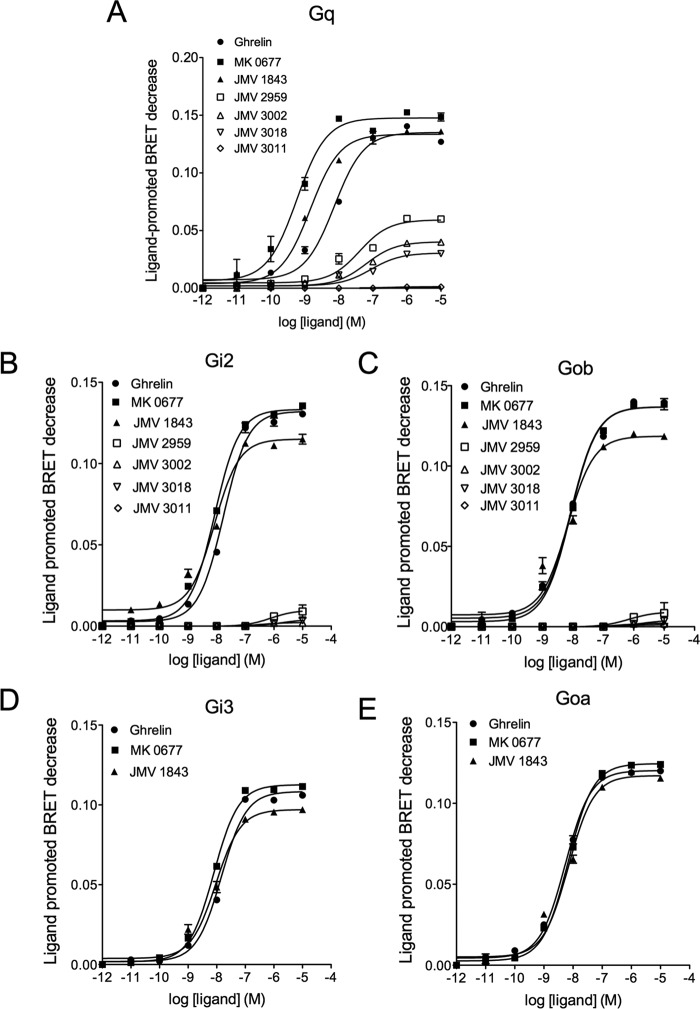
We performed dose-response curves for Gi and Go isoforms (Fig. 6). EC50 values reported in Table 2 showed that ghrelin was equally potent to stimulate Gq, Gi, and Go, whereas MK-0677 and JMV 1843 were more potent to stimulate Gq than Gi and Go. As shown in Fig. 6 and Table 2, MK-0677 displayed a higher potency toward Gq than toward Gi2, Gi3, Goa, and Gob. Quantification of bias confirms that MK-0677 is indeed slightly but significantly biased toward Gq relative to Gi2, Gi3, Goa, and Gob with a bias factor of 6.46, 10.11, 12.59, and 18.84 respectively (Fig. 6 and Table 3). We then investigated the selectivity of GHS-R1a ligands to promote activation of Gq, Gi2, and Gob, three G protein subtypes for which the highest BRET variation was observed following ghrelin stimulation.
FIGURE 6.
Efficacy and potency of GHS-R1a ligands to trigger activation of Gq, Gi, and Go. The BRET signal was recorded as a function of increasing concentrations of ligands in HEK293T cells co-expressing GHS-R1a and the G protein sensors. The effect of JMV 2959, JMV 3002, JMV 3018, and JMV 3011 was tested only on Gq, Gi2, and Gob. Data are representative of three independent experiments each performed in triplicate. Values of EC50 and Emax are reported in Table 2.
As already discussed above, ghrelin, MK-0677, and JMV 1843 behaved as full agonists toward Gq, Gi2, and Gob activation (Fig. 6, A–C). JMV 3011, which was classified as neutral and antagonistic based on the IP1 production assay (Figs. 1 and 3), had no action on its own on Gq, Gi2, and Gob activation. However, as expected, it antagonized ghrelin-induced Gq, Gi2, and Gob activation (Figs. 6 and 7). JMV 3011 is thus neutral and antagonistic at Gq, Gi2, and Gob. In contrast, JMV 2959, JMV 3002, JMV 3018, which behaved as partial agonists of Gq, were neutral at Gi2 and Gob activation (Figs. 6 and 7). When we tested them at a 10−6 m maximal dose in competition with 10−7 m ghrelin, these compounds partially inhibited ghrelin-promoted Gq activation and completely suppressed ghrelin-evoked Gi2 and Gob activation (Fig. 7). Taken together, these results suggest that JMV 2959, JMV 3011, and JMV 3018 are de facto biased agonists toward Gq relative to Gi2 and Gob. However, one can consider this as an observational bias. Indeed, no quantification of bias was possible because these ligands did not induce any significant signals at Gi2a and Gob.
FIGURE 7.
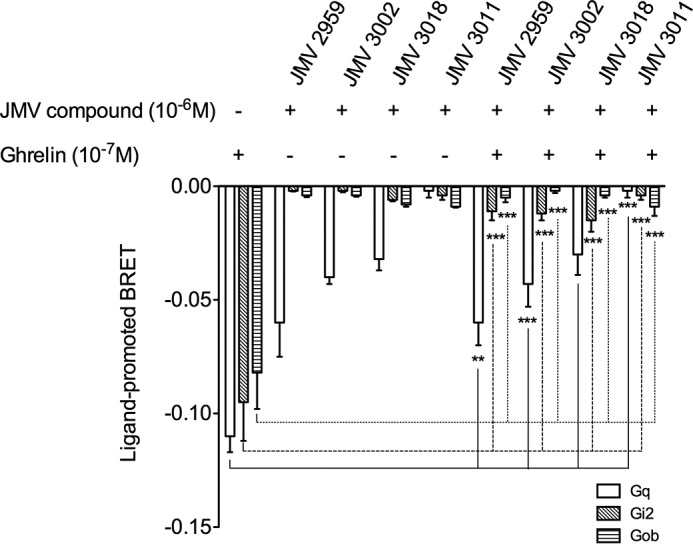
Efficacy of JMV 2959, JMV 3002, JMV 3018, and JMV 3011 at inhibiting ghrelin-promoted Gq, Gi2, and Gob activation. HEK293T cells expressing GHS-R1a were stimulated for 15 min at 25 °C with 10−6 m JMV compounds in the presence or absence of ghrelin at 10−7 m. Results are expressed as the difference in BRET ratio measured in the presence and in the absence of ligand stimulation for each G protein type. Values are mean ± S.E. of three experiments, each performed in triplicate. Statistical significance between the signal obtained with ghrelin alone and ghrelin in the presence of JMV compounds for each G protein was assessed using a paired Student's t test (***, p < 0.001; **, p < 0.01).
Selectivity of Inverse Agonists toward Gq and G13 Activation
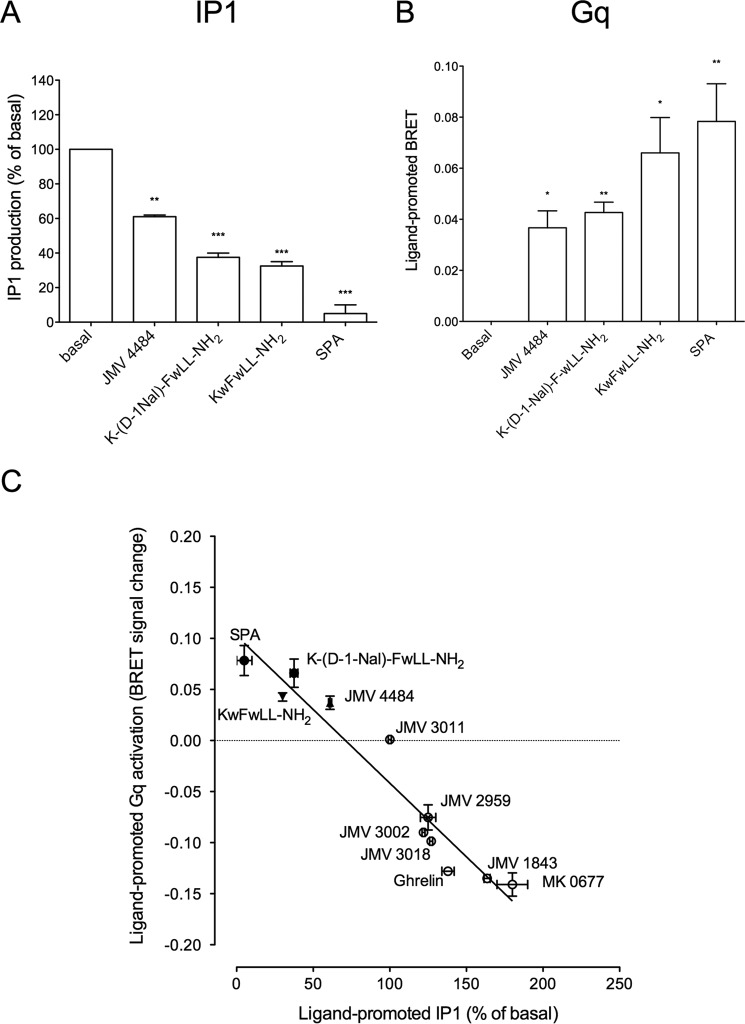
Interestingly, we found that the G protein BRET assay was also suitable for detection of inverse agonists. Indeed, in contrast to agonists, SPA induced an increase of the BRET signal on cells co-expressing GHS-R1a and the Gq biosensor (Fig. 8), confirming that SPA acts as an inverse agonist toward GHS-R1a-promoted Gq constitutive activity. To determine whether using the BRET assay could be a general way to identify inverse agonists, we applied it to a panel of compounds that had been classified as inverse agonists based on IP1 production (Fig. 8A and Table 2). All these ligands promoted an increase in the BRET signal in cells co-expressing GHS-R1a and the Gq biosensor (Fig. 8B). This confirms that SPA, KwFwLL-NH2, K-(d-1Nal)-FwLL-NH2, and JMV 4484 are inverse agonists toward GHS-R1a-mediated Gq constitutive activity. Interestingly, for different classes of GHS-R1a ligands, a close correlation was obtained between their efficacy to modulate Gq activity and their efficacy to modulate IP1 production (Fig. 8C).
FIGURE 8.
Efficacy of inverse agonists toward Gq and IP production. A, efficacy of ligands (10−6 m) at promoting IP1 production expressed as the percentage of basal IP of HEK293T cells expressing GHS-R1a, where zero represents the basal IP1 production of mock-transfected HEK293T cells. B, efficacy of ligands (10−6 m) at promoting BRET signal increase in HEK293T cells co-expressing the GHS-R1a and the Gq biosensor. The basal value represents the BRET signal obtained in the absence of ligand stimulation. Values are mean ± S.E. of three experiments, each performed in triplicate. Statistical significance between stimulated and non-stimulated cells was assessed using a paired Student's t test (***, p < 0.001; **, p < 0.01; *, p < 0.05). C, correlation between the efficacy of ligands toward Gq activation and their efficacy toward inositol phosphate production. Variation of the BRET2 signal triggered by ligands in HEK293T cells co-expressing GHS-R1a and the Gq sensor is plotted versus IP1 production promoted by ligands in HEK293T cells expressing GHS-R1a. BRET2 signal variation is expressed as the difference of the BRET ratio measured in simulated and non-stimulated cells. IP production is expressed as the percentage of basal IP production measured in HEK293T cells expressing the GHS-R1a with basal representing 100%. Values are mean ± S.E. of three experiments. R2 = 0.94
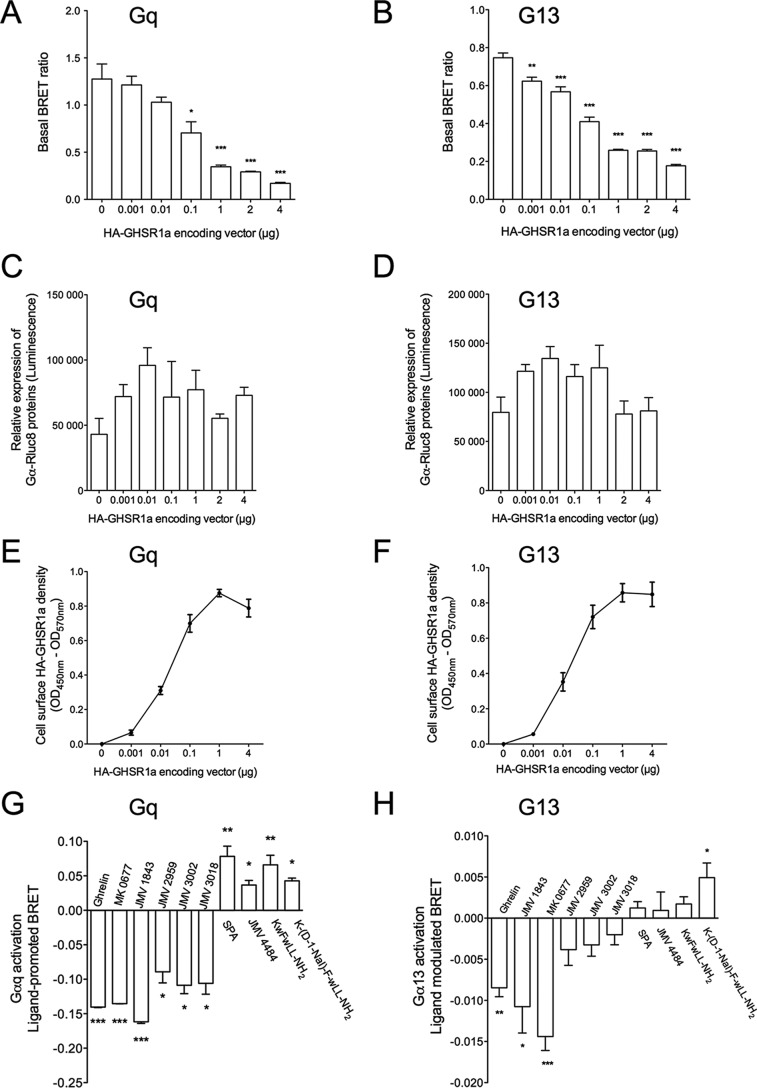
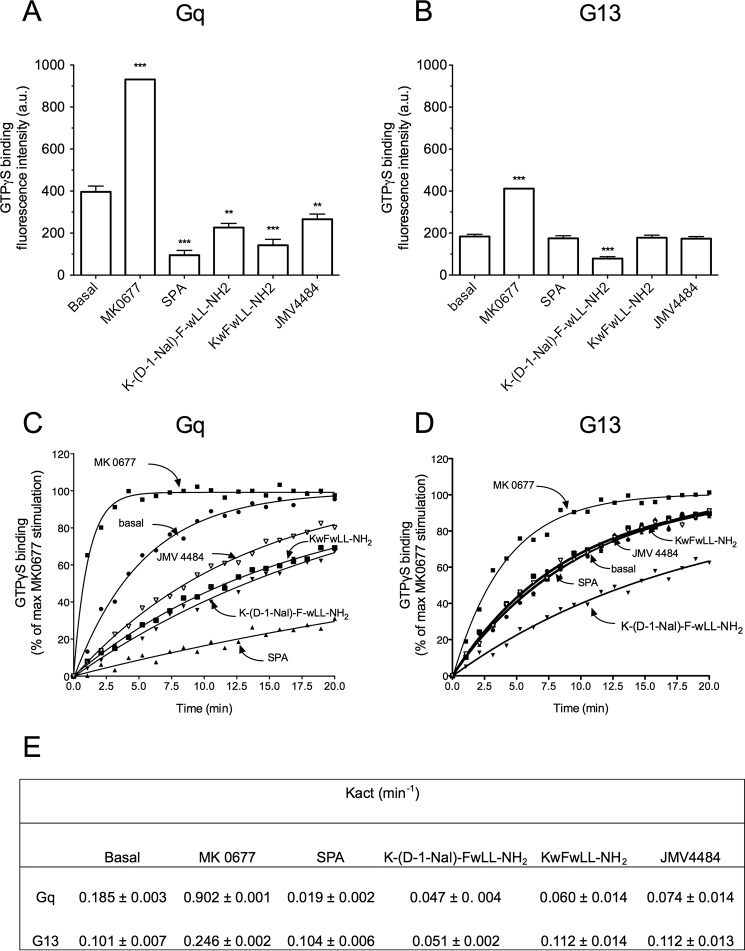
Besides the constitutive activity at the Gq-inositol phosphate signaling pathway, it had been previously suggested, based on an SRE reporter, that GHS-R1a also constitutively activated G12/G13-dependent pathways (25). Therefore, we checked whether the G13 biosensor could be used to bring more direct proof of GHS-R1a-mediated G13 constitutive activation. As was the case for Gq, the basal level of G13 activity was strictly dependent on the amount of GHS-R1a receptors expressed at the surface of the cells. Indeed, the BRET ratio decreased gradually upon increasing the amount of GHS-R1a at the cell surface (Fig. 9, A–F). These results confirmed that GHS-R1a constitutively activated G13, and, as expected, the level of this constitutive activity correlated to the receptor expression level. Based on this result, we investigated the behavior of inverse agonists of Gq on G13 activation (Fig. 9, G and H). Interestingly, compound K-(D-1Nal)-FwLL-NH2 promoted an increase of the BRET signal at both Gq and G13, whereas SPA, KwFwLL-NH2, and JMV 4484 behaved only as inverse agonists on Gq only (Fig. 9, G and H). Although this suggests that SPA, KwFwLL-NH2, and JMV 4484 are biased toward Gq over G13, it is difficult to firmly conclude at this stage. Indeed, the BRET signal was 10-fold lower for G13 than for Gq. The observational bias could thus result from a difference in sensitivity between Gq and G13 sensors. To confirm the results obtained with the BRET sensors, we then used a totally different assay. This assay consisted in measuring GTPγS binding to purified Gq and G13 proteins in the presence of purified GHS-R1a embedded in lipid discs. As expected, the agonist MK-0677 promoted an increase of GTPγS binding at both Gq and G13. However, although K-(D-1Nal)-FwLL-NH2 promoted a decrease of GTPγS binding for both Gq and G13 compared with the unliganded receptor, SPA, KwFwLL-NH2, and JMV 4484 promoted a decrease of GTPγS binding to Gq only (Fig. 10, A and B). These results were confirmed by kinetic analyses of GTPγS binding (Fig. 10, C and D). Indeed, stimulation of GHS-R1a with K-(D-1Nal)-FwLL-NH2 promoted a decrease of the Kact value for both Gq and G13 compared with unliganded receptor, whereas stimulation with SPA, KwFwLL-NH2, and JMV 4484 induced a decrease of the Kact value for Gq only (Fig. 10, C and D). Thus, these data confirmed that SPA, KwFwLL-NH2, and JMV 4484 compounds acted as biased inverse agonists toward Gq relative to G13. Although the raw fluorescence intensity increase of values upon GTP binding to Gq are 2-fold higher than those obtained with G13, both signal are nevertheless well above the signal to noise ratio. This suggest that a difference in sensitivity cannot explain the absence of change in receptor-catalyzed GTPγS binding to G13 observed for SPA, KwFwLL-NH2, and JMV 4484. Unfortunately, no quantification of bias for the inverse agonists could be done due to any detectable effect of these ligands on G13.
FIGURE 9.
GHS-R1a-dependent constitutive activity at Gq and G13 and selectivity of agonists and inverse agonists. A and B, BRET signal measured in HEK293T cells co-expressing either Gαq-Rluc8 (A) or Gα13-Rluc8 (B) and GFP10-Gγ2 and Gβ1 in the absence or presence of increasing amounts of HA-GHS-R1a (vectors encoding N-terminally the HA-tagged GHS-R1a ranging from 0.001 to 4 μg/well) and in the absence of ligand. Data represent the mean ± S.E. of at least three independent experiments. Statistical significance between cells expressing or not the HA-GHS-R1a was assessed using a one-way ANOVA followed by Tukey's test (*, p < 0.05; **, p < 0.01; ***, p < 0.001). Each transfection condition was controlled for Gαq-Rluc8 (C) and Gαq-Rluc8 (D) total expression levels by measuring luminescence intensity (C and D) and cell surface expression of HA-GHS-R1a quantified by ELISA using an anti-HA antibody (E and F). Results are expressed as the mean ± S.E. of at least three independent experiments. G and H, BRET signal promoted by ligands measured in HEK293T cells co-expressing either Gαq-Rluc8 (G) or Gα13-Rluc8 (H), GFP10-Gγ2 and Gβ1, in the presence of the HA-GHS-R1a, and stimulated or not with 10 μm ligands. Results are expressed as the difference in BRET signals measured in the presence and in the absence of ligand. Values are mean ± S.E. of at least four independent experiments. Statistical significance between stimulated and non-stimulated cells was assessed using a paired Student's t test (***, p < 0.001; **, p < 0.01; *, p < 0.05).
FIGURE 10.
GHS-R1a-dependent constitutive activity at Gq and G13 proteins and ligand selectivity with the purified receptor. The monomeric GHS-R1a in lipid discs was incubated with purified Gαq and Gα13 in the presence of Gβ1γ2. The efficacy of ligands to modulate GHS-R1a-promoted Gq (A) and G13 (B) activity was assessed by monitoring changes in the BODIPY® FL GTPγS emission intensity. GTPγS binding is expressed as raw values of fluorescence emission of BODIPY® FL GTPγS. Data are from one representative of three independent experiments, and statistical significance between unliganded and liganded GHS-R1a was assessed using Student's t test (***, p < 0.001; **, p < 0.01). Kinetics of GTPγS binding to Gq (C) and G13 (D) were carried out under the same conditions. GHS-R1a-catalyzed GTPγS binding is expressed as the percentage of maximal MK-0677 stimulation. E, Kact (min−1) values (mean ± S.E., n = 2) were calculated from GTPγS binding kinetics using GraphPad Prism software.
Discussion
In this study, we revisited the pharmacological behavior of ligands targeting GHS-R1a by deeply exploring their efficacy toward G protein-dependent and -independent signaling pathways. We paid particular attention to the selectivity of ligands toward a panel of G protein subtypes thanks to G protein activation biosensors that were recently developed (31, 32). As previously reported, GHS-R1a displays one of the highest constitutive activity (24, 26) in the GPCR family (45, 46). In HEK293T cells, the model we used in this study, the basal level of IP1 production represented 50–70% of the maximal level promoted by ghrelin, the endogenous ligand of GHS-R1a. In this particular situation, detection of partial agonists was problematic because the high basal level of IP1 production might hide the partial agonist character of some ligands. This was the case for JMV 2959, first reported as an antagonist (35, 47), but it displayed no or partial agonist activity depending on whether the basal activity was higher or lower than 60% of the maximal ghrelin response. Indeed, we unambiguously highlighted here the partial agonist character of JMV 2959 and of other compounds (JMV 3002 and JMV 3018) by testing their efficacy on the GHS-R1a-A204E mutant, which exhibits a low constitutive activity (42). These results highlighted the fact that ligands targeting GHS-R1a might be classified as neutral or partial agonists depending on the level of constitutive activity of the receptor. This point is of importance because constitutive activity of the GHS-R1a was demonstrated in vivo in rat brain (48) and in human somatotroph adenomas (49). However, the exact level of constitutive activity of the receptor was not ascertained due to the difficulty of its in vivo quantification. Furthermore, one can imagine that the level of constitutive activity of the GHS-R1a varies with its tissue or cellular localization. Indeed, it had been repeatedly demonstrated that the level of constitutive activity of a GPCR depends on the cell content in various protein partners such as other GPCRs or intracellular proteins (G proteins, scaffolding proteins) (45, 46). Therefore, the lack of knowledge on the ligand-independent activity of GHS-R1a in vivo should make us cautious about classifying GHS-R1a antagonists until a deep investigation has been performed. Interestingly we found that JMV compounds that behaved as partial agonists on IP signaling were unable to promote both β-arrestin2 recruitment and ERK1/2 activation, in contrast to the full agonists ghrelin, MK-0677, and JMV1843. However, these partial agonists totally inhibited ghrelin-promoted ERK1/2 phosphorylation and β-arrestin2 recruitment. Thus, this suggests that JMV 2959, JMV 3018, and JMV 3002 are biased agonists toward the IP pathway compared with arrestin recruitment and ERK1/2 activation and behave as biased antagonists of arrestin recruitment and ERK1/2 activation compared with the IP pathway. However, one can also consider this bias as an observational bias. Indeed, no quantification of bias was possible because these ligands did not induce any detectable, β-arrestin2 recruitment, and ERK1/2 phosphorylation. We took advantage here of G protein activation BRET biosensors (31, 32) that directly report on the conformational change of G protein upon activation, to assess whether the partial agonist behavior of these ligands toward IP1 production resulted from their Gq partial agonism. Although it was reported that GHS-R1a activated G protein-dependent signaling pathways through Gq, Gi, Go (23, 30, 50), and G13 (51), these conclusions were drawn from studies that indirectly measured G protein activation. We monitored here the selective coupling of GHS-R1a to the G protein family using activation biosensors for a panel of G protein subtypes and isoforms (Gq, Gi1, Gi2, Gi3, Goa, Gob, Gs, G12, and G13). As expected, GHS-R1a interaction with either ghrelin, MK-0677, or JMV1843 resulted in an efficient Gq activation. We also confirmed that stimulation of GHS-R1a either with ghrelin or MK-0677 promoted activation of Gi proteins with a better efficacy for Gi2 and Gi3 than for Gi1. We also found that ghrelin had the ability to promote Goa, Gob, and G13 activation but was unable to promote G12 and Gs activation. Thus, our data demonstrate that ghrelin-stimulated GHS-R1a activates Gq, Gi, Go, and G13 proteins, confirming that GHS-R1a signals through intracellular pathways governed by these G protein types. Although it was previously reported that GHS-R1a activated G13-dependent signaling pathways, these conclusions were drawn from indirect measurement of SRE (25, 52) and Rho kinase activation or by the use of a dominant negative mutant of Gα13 (51). Our data confirm more directly that ghrelin stimulates GHS-R1a-mediated G13 activation. In contrast, no Gs activation was detected, confirming our previous data that concluded due to the inability of the purified GHS-R1a to couple to Gs in lipid nanodiscs (26). Taken together, our data suggest that GHS-R1a does not interact with Gs in contrast to published data indicating that ghrelin activated cAMP production in pancreatic HIT-T25 beta cells (53, 54). Although we found that MK-0677 and JMV 1843 displayed similar efficacy toward several G protein subtypes and isoforms, quantification of bias demonstrate that MK-0677 is slightly biased compared with ghrelin toward Gq over Gi2, Gi3, Goa, and Gob. Interestingly, the neutral/antagonist character of JMV 3011 demonstrated on IP1 production and arrestin and ERK1/2 pathways was also confirmed on Gq, Gi2, and Gob, making this ligand a good lead for the design of GHS-R1a signaling neutral/antagonist. More importantly, the partial agonist behavior of JMV 2959, JMV 3002, and JMV 3018 first assessed with the IP1 production assay was further confirmed with the Gq biosensor. However, and interestingly, ligands displaying partial agonist efficacy toward Gq were silent toward Gi2 and Gob. Moreover, we clearly demonstrate that these ligands fully inhibit Gi2 and Gob activation promoted by ghrelin and MK-0677, whereas they only partially inhibited Gq activation. Because JMV 2959, JMV 3002, and JMV 3018 did not promote any detectable activation of Gi2 and Gob, no quantification of bias between Gq and Gi/o could be obtained for these compounds. Nevertheless, one can consider that up to 10−6 m JMV 2959, JMV 3002, and JMV 3018 behaved as follows: (i) biased agonists toward Gq activation and IP1 production relative to Gi2, Gob activation, arrestin recruitment, and ERK1/2 activation; (ii) biased antagonists toward Gi2, Gob activation, arrestin recruitment, and ERK1/2 activation relative to Gq activation and IP production. It is obvious that these results need to be confirmed in a more physiologically relevant natural system than HEK293 cells. It also remains to be assessed whether the ligand-directed functional selectivity toward downstream signaling pathways leads to a functional selectivity toward physiological functions controlled by the ghrelin/GHS-R1a axis. One can nevertheless point out that in vivo studies in rat demonstrated that JMV 2959 inhibited food intake and addiction but not GH secretion promoted by ghrelin (35, 47). This observation is of importance because it suggests that a potential link may exist between the selective action of JMV 2959 toward the signaling pathways activated by GHS-R1a and its selective antagonist action toward physiological responses promoted by ghrelin (Fig. 11). Very interestingly, the synthetic ligand GSK1614343 described as an antagonist on calcium release and IP1 production behaved in vivo as an antagonist against GH secretions although it stimulated food intake (55, 56). In the same line, another ghrelin analog, BIM-28163 considered as a ghrelin receptor antagonist based on in vitro calcium release assays, behaved in vivo as a ghrelin-induced GH secretion antagonist but as an agonist on stimulation of food intake (57). Therefore, GSK and BIM compounds behaved in vivo in an opposite way from JMV 2959. Whether the in vivo selective action of GSK and BIM compounds results from a signaling bias opposite that of JMV 2959 remains to be determined. Altogether, these observations suggest that it will certainly be possible in the near future to design new selective therapeutic drugs for pathologies associated with ghrelin/GHS-R1a interactions. In this context, it could be useful to selectively block some of the signaling pathways linked to constitutive activation of the GHS-R1a. Indeed, GHS-R1a is one of the most constitutively active GPCRs, and the potential role of its constitutive activity in the “snacking” behavior between meals is questioned (58). To our knowledge, so far the inverse agonists that display a functional selectivity toward the signaling pathways have only been described for the ghrelin receptor. Indeed, it was reported that compound KwFwLL-NH2, a GHS-R1a inverse agonist on IP production, was neutral in an SRE luciferase assay, suggesting that this ligand is a biased inverse agonist favoring inhibition of the constitutive GHS-R1a-mediated Gq-dependent pathway compared with that of the G13-dependent pathway (52). Thanks to G protein BRET biosensors, we directly demonstrated that GHS-R1a constitutively activates both Gq and G13. We found that K-(D-1Nal)-FwLL-NH2, which had been previously characterized as a GHS-R1a inverse agonist on the IP pathway (38), is indeed an efficient and potent inverse agonist toward Gq activity but also behaves as an inverse agonist toward G13. We also found that SPA as well as KwFwLL-NH2 and JMV 4484 behave as inverse agonists toward IP production and Gq activation but were silent toward G13 activation. However, it was difficult to interpret these data as resulting from a real functional selectivity because the intensity of the G13 signal was much lower than that of Gq. Nevertheless, these results were confirmed by directly measuring receptor-catalyzed GTPγS binding to Gq and G13 with GHS-R1a reconstituted in lipid discs, an assay for which Gq and G13 signals were comparable. Thus, using two different approaches that directly report on G protein activity, some inverse agonists appear selective toward Gq over G13. However, we could not confirm in these assays that SPA behaves as a modest inverse agonist at G13 signaling as suggested previously from data that indirectly measured G13 activity by recording SRE activity (25). A possibility would be that this discrepancy results from the different methods used in the two studies. Indeed, the method we have employed in this study monitors the activity of the G protein itself, whereas the SRE reporter assay monitors an activity resulting from the activation of various G proteins, including Gq, G13, Gi, and Gβγ of Gi. Therefore, it may be possible that the modest inverse agonist activity of SPA observed in the SRE reporter assay did not result from the G13 activation but rather from the activation of other G protein-dependent pathways. In summary, we have identified in this study a series of synthetic ligands that behave as partial agonists at Gq but are silent toward β-arrestin2 recruitment and Gi/Go activation. One of them, JMV 2959, appears particularly attractive because this ligand selectively blocks ghrelin-evoked food intake and addictions without altering GH secretion. It should be now of interest to further explore the in vivo behavior of the other molecules identified in this study that display a bias behavior similar to that of JMV 2959. Finally, our data suggest that GHS-R1a-dependent constitutive activation of Gq and G13 can be selectively modulated by synthetic ligands. It would also be important to test in future studies whether the signaling bias promoted by some of our ligands can result from their action on allosteric binding sites and not through their direct action on the orthosteric site, an issue that has not been explored in this study. Indeed, for a given GPCR, allosteric agonists can promote different signaling profiles compared with the orthosteric agonist, and there are several examples of allosteric ligands that change the coupling preference of the endogenous agonist (59). Finally, although our study brings new information on the selectivity of ligands at the GHS-R1a signaling, the data reported in this work were obtained in a single cell system model, HEK293. This cell system is certainly far from representing the physiological context of GHS-R1a-dependent signaling. Furthermore, the selectivity of action of ligands on various signaling pathways varies depending on the cellular context (60, 61). Therefore, before drawing any definitive conclusions on the physiological reality of the signaling selectivity of our ligands that was only observed so far in HEK293, further studies should be carried out in other heterologous cell systems, or even better in primary cells that endogenously express the GHS-R1a. It is obvious that the development of functional selective drugs that could be therapeutically useful will require further studies to better understand the contribution of individual signaling pathways to the diverse physiological responses controlled by GHS-R1a.
FIGURE 11.
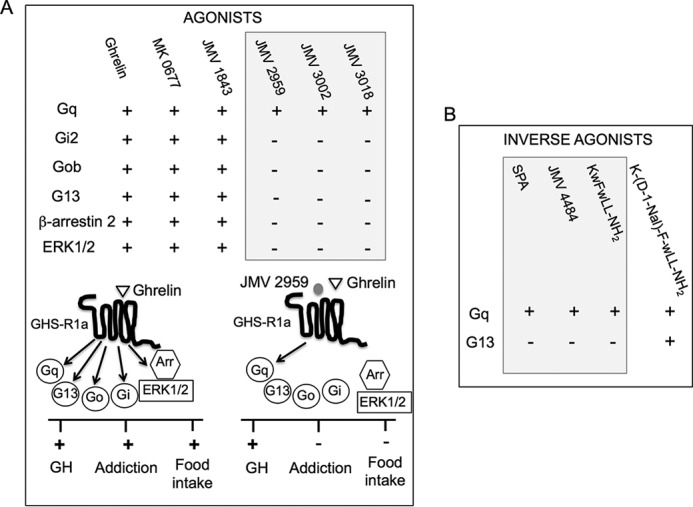
Outline of the functional selectivity of GHS-R1a ligands at GHS-R1a signaling. A, agonists. Ghrelin, MK-0677, and JMV 1843 are agonists (+) for all pathways, whereas JMV 2959, JMV 3002, and JMV 3018 compounds are partial agonists for Gq and neutral (−) toward the other pathways. Schematic drawings represent signaling pathways and in vivo effects promoted by ghrelin upon binding to GHS-R1a. Ghrelin, the endogenous ligand of GHS-R1a, activates Gq-, Go-, Gi-, and G13-dependent pathways and induces arrestin recruitment and ERK1/2 phosphorylation, resulting in GH secretion, food intake, and addiction. JMV 2959 antagonizes ghrelin action at Go, Gi, arrestin, and ERK but inhibits only partially Gq resulting in inhibition of addiction and food intake but not to inhibition of GH secretion. The possible connection between selectivity of JMV 2959 toward signaling pathways and physiological responses remains to be established. B, inverse agonists at Gq and G13. K-(D-1-Nal)-F-wLL-NH2 is an inverse agonist at both Gq and G13, whereas SPA, JMV 4484, and KwFwLL-NH2 are inverse agonists for both Gq and G13. Physiological consequences of the inverse agonism selectivity at Gq and G13 remain to be explored.
Author Contributions
C. M'K., J. P. L., and J. Marie designed the research; C. M'K., J. P. L., L. O., C. G., A. S., D. G., M. D., and S. M. performed the research; M. M., S. D., P. V., J. A. F., and J. Martinez synthesized the ligands; C. M'K., J. L. B., and J. Marie analyzed the data, and J. Marie wrote the paper. All the authors reviewed the results and approved the final version of the manuscript.
Acknowledgment
We thank Eric Trinquet (Cisbio) for providing us materials for HTRF-based assays.
This work was supported by grants from INSERM, CNRS, and Université de Montpellier, Agence Nationale de la Recherche Grant PCV08-323163. The authors declare that they have no conflicts of interest with the contents of this article.
- GHS-R1a
- growth hormone secretagogue receptor type 1a
- GH
- growth hormone
- GPCR
- G protein-coupled receptor
- IP1
- inositol 1-phosphate
- SRE
- serum-responsive element
- BRET
- bioluminescence resonance energy transfer
- HTRF
- homogenous time resolved fluorescence
- GTPγS
- guanosine 5′-O-(3-thiotriphosphate)
- ANOVA
- analysis of variance
- SPA
- substance P analog
- IP
- inositol phosphate.
References
- 1.Kojima M., Hosoda H., Date Y., Nakazato M., Matsuo H., and Kangawa K. (1999) Ghrelin is a growth-hormone-releasing acylated peptide from stomach. Nature 402, 656–660 [DOI] [PubMed] [Google Scholar]
- 2.Akamizu T., and Kangawa K. (2012) The physiological significance and potential clinical applications of ghrelin. Eur. J. Intern. Med. 23, 197–202 [DOI] [PubMed] [Google Scholar]
- 3.Delporte C. (2013) Structure and physiological actions of ghrelin. Scientifica 2013, 518909. [DOI] [PMC free article] [PubMed] [Google Scholar]
- 4.Lagerström M. C., and Schiöth H. B. (2008) Structural diversity of G protein-coupled receptors and significance for drug discovery. Nat. Rev. Drug Discov. 7, 339–357 [DOI] [PubMed] [Google Scholar]
- 5.Cruz C. R., and Smith R. G. (2008) The growth hormone secretagogue receptor. Vitamins Hormones 77, 47–88 [DOI] [PubMed] [Google Scholar]
- 6.Callaghan B., and Furness J. B. (2014) Novel and conventional receptors for ghrelin, desacyl-ghrelin, and pharmacologically related compounds. Pharmacol. Rev. 66, 984–1001 [DOI] [PubMed] [Google Scholar]
- 7.Moulin A., Ryan J., Martinez J., and Fehrentz J. A. (2007) Recent developments in ghrelin receptor ligands. ChemMedChem 2, 1242–1259 [DOI] [PubMed] [Google Scholar]
- 8.Holubová M., Spolcová A., Demianová Z., Sýkora D., Fehrentz J. A., Martinez J., Stofková A., Jurčovičová J., Drápalová J., Lacinová Z., Haluzík M., Zelezná B., and Maletínská L. (2013) Ghrelin agonist JMV 1843 increases food intake, body weight and expression of orexigenic neuropeptides in mice. Physiol. Res. 62, 435–444 [DOI] [PubMed] [Google Scholar]
- 9.Chollet C., Meyer K., and Beck-Sickinger A. G. (2009) Ghrelin–a novel generation of anti-obesity drug: design, pharmacomodulation and biological activity of ghrelin analogues. J. Pept. Sci. 15, 711–730 [DOI] [PubMed] [Google Scholar]
- 10.Hansson C., Shirazi R. H., Näslund J., Vogel H., Neuber C., Holm G., Anckarsäter H., Dickson S. L., Eriksson E., and Skibicka K. P. (2012) Ghrelin influences novelty seeking behavior in rodents and men. PLoS One 7, e50409. [DOI] [PMC free article] [PubMed] [Google Scholar]
- 11.Menzies J. R., Skibicka K. P., Leng G., and Dickson S. L. (2013) Ghrelin, reward and motivation. Endocr. Dev. 25, 101–111 [DOI] [PubMed] [Google Scholar]
- 12.Nass R., Gaylinn B. D., and Thorner M. O. (2011) The role of ghrelin in GH secretion and GH disorders. Mol. Cell. Endocrinol. 340, 10–14 [DOI] [PMC free article] [PubMed] [Google Scholar]
- 13.Murphy M. G., Weiss S., McClung M., Schnitzer T., Cerchio K., Connor J., Krupa D., Gertz B. J., and MK-677/Alendronate Study Group. (2001) Effect of alendronate and MK-677 (a growth hormone secretagogue), individually and in combination, on markers of bone turnover and bone mineral density in postmenopausal osteoporotic women. J. Clin. Endocrinol. Metab. 86, 1116–1125 [DOI] [PubMed] [Google Scholar]
- 14.Kenakin T. (2011) Functional selectivity and biased receptor signaling. J. Pharmacol. Exp. Ther. 336, 296–302 [DOI] [PubMed] [Google Scholar]
- 15.Maudsley S., Patel S. A., Park S. S., Luttrell L. M., and Martin B. (2012) Functional signaling biases in G protein-coupled receptors: game theory and receptor dynamics. Mini Rev. Med. Chem. 12, 831–840 [DOI] [PMC free article] [PubMed] [Google Scholar]
- 16.Whalen E. J., Rajagopal S., and Lefkowitz R. J. (2011) Therapeutic potential of β-arrestin- and G protein-biased agonists. Trends Mol. Med. 17, 126–139 [DOI] [PMC free article] [PubMed] [Google Scholar]
- 17.Kobilka B. K., and Deupi X. (2007) Conformational complexity of G protein-coupled receptors. Trends Pharmacol. Sci. 28, 397–406 [DOI] [PubMed] [Google Scholar]
- 18.Mary S., Damian M., Louet M., Floquet N., Fehrentz J. A., Marie J., Martinez J., and Banères J. L. (2012) Ligands and signaling proteins govern the conformational landscape explored by a G protein-coupled receptor. Proc. Natl. Acad. Sci. U.S.A. 109, 8304–8309 [DOI] [PMC free article] [PubMed] [Google Scholar]
- 19.Kahsai A. W., Xiao K., Rajagopal S., Ahn S., Shukla A. K., Sun J., Oas T. G., and Lefkowitz R. J. (2011) Multiple ligand-specific conformations of the β2-adrenergic receptor. Nat. Chem. Biol. 7, 692–700 [DOI] [PMC free article] [PubMed] [Google Scholar]
- 20.Yao X. J., Vélez Ruiz G., Whorton M. R., Rasmussen S. G., DeVree B. T., Deupi X., Sunahara R. K., and Kobilka B. (2009) The effect of ligand efficacy on the formation and stability of a GPCR-G protein complex. Proc. Natl. Acad. Sci. U.S.A. 106, 9501–9506 [DOI] [PMC free article] [PubMed] [Google Scholar]
- 21.Damian M., Mary S., Maingot M., M'Kadmi C., Gagne D., Leyris J. P., Denoyelle S., Gaibelet G., Gavara L., Garcia de Souza Costa M., Perahia D., Trinquet E., Mouillac B., Galandrin S., Galès C., et al. (2015) Ghrelin receptor conformational dynamics regulate the transition from a preassembled to an active receptor:Gq complex. Proc. Natl. Acad. Sci. U.S.A. 112, 1601–1606 [DOI] [PMC free article] [PubMed] [Google Scholar]
- 22.Zhou L., and Bohn L. M. (2014) Functional selectivity of GPCR signaling in animals. Curr. Opin. Cell Biol. 27, 102–108 [DOI] [PMC free article] [PubMed] [Google Scholar]
- 23.Yin Y., Li Y., and Zhang W. (2014) The growth hormone secretagogue receptor: its intracellular signaling and regulation. Int. J. Mol. Sci. 15, 4837–4855 [DOI] [PMC free article] [PubMed] [Google Scholar]
- 24.Holst B., Cygankiewicz A., Jensen T. H., Ankersen M., and Schwartz T. W. (2003) High constitutive signaling of the ghrelin receptor–identification of a potent inverse agonist. Mol. Endocrinol. 17, 2201–2210 [DOI] [PubMed] [Google Scholar]
- 25.Holst B., Holliday N. D., Bach A., Elling C. E., Cox H. M., and Schwartz T. W. (2004) Common structural basis for constitutive activity of the ghrelin receptor family. J. Biol. Chem. 279, 53806–53817 [DOI] [PubMed] [Google Scholar]
- 26.Damian M., Marie J., Leyris J. P., Fehrentz J. A., Verdié P., Martinez J., Banères J. L., and Mary S. (2012) High constitutive activity is an intrinsic feature of ghrelin receptor protein: a study with a functional monomeric GHS-R1a receptor reconstituted in lipid discs. J. Biol. Chem. 287, 3630–3641 [DOI] [PMC free article] [PubMed] [Google Scholar]
- 27.Holliday N. D., Holst B., Rodionova E. A., Schwartz T. W., and Cox H. M. (2007) Importance of constitutive activity and arrestin-independent mechanisms for intracellular trafficking of the ghrelin receptor. Mol. Endocrinol. 21, 3100–3112 [DOI] [PubMed] [Google Scholar]
- 28.Camiña J. P., Lodeiro M., Ischenko O., Martini A. C., and Casanueva F. F. (2007) Stimulation by ghrelin of p42/p44 mitogen-activated protein kinase through the GHS-R1a receptor: role of G proteins and β-arrestins. J. Cell. Physiol. 213, 187–200 [DOI] [PubMed] [Google Scholar]
- 29.Mousseaux D., Le Gallic L., Ryan J., Oiry C., Gagne D., Fehrentz J. A., Galleyrand J. C., and Martinez J. (2006) Regulation of ERK1/2 activity by ghrelin-activated growth hormone secretagogue receptor 1A involves a PLC/PKCvarepsilon pathway. Br. J. Pharmacol. 148, 350–365 [DOI] [PMC free article] [PubMed] [Google Scholar]
- 30.Pazos Y., Casanueva F. F., and Camiña J. P. (2008) Basic aspects of ghrelin action. Vitamins Hormones 77, 89–119 [DOI] [PubMed] [Google Scholar]
- 31.Galés C., Van Durm J. J., Schaak S., Pontier S., Percherancier Y., Audet M., Paris H., and Bouvier M. (2006) Probing the activation-promoted structural rearrangements in preassembled receptor-G protein complexes. Nat. Struct. Mol. Biol. 13, 778–786 [DOI] [PubMed] [Google Scholar]
- 32.Saulière A., Bellot M., Paris H., Denis C., Finana F., Hansen J. T., Altié M. F., Seguelas M. H., Pathak A., Hansen J. L., Sénard J. M., and Galés C. (2012) Deciphering biased-agonism complexity reveals a new active AT1 receptor entity. Nat. Chem. Biol. 8, 622–630 [DOI] [PubMed] [Google Scholar]
- 33.Patchett A. A., Nargund R. P., Tata J. R., Chen M. H., Barakat K. J., Johnston D. B., Cheng K., Chan W. W., Butler B., and Hickey G. (1995) Design and biological activities of L-163,191 (MK-0677): a potent, orally active growth hormone secretagogue. Proc. Natl. Acad. Sci. U.S.A. 92, 7001–7005 [DOI] [PMC free article] [PubMed] [Google Scholar]
- 34.Guerlavais V., Boeglin D., Mousseaux D., Oiry C., Heitz A., Deghenghi R., Locatelli V., Torsello A., Ghé C., Catapano F., Muccioli G., Galleyrand J. C., Fehrentz J. A., and Martinez J. (2003) New active series of growth hormone secretagogues. J. Med. Chem. 46, 1191–1203 [DOI] [PubMed] [Google Scholar]
- 35.Moulin A., Demange L., Bergé G., Gagne D., Ryan J., Mousseaux D., Heitz A., Perrissoud D., Locatelli V., Torsello A., Galleyrand J. C., Fehrentz J. A., and Martinez J. (2007) Toward potent ghrelin receptor ligands based on trisubstituted 1,2,4-triazole structure. 2. Synthesis and pharmacological in vitro and in vivo evaluations. J. Med. Chem. 50, 5790–5806 [DOI] [PubMed] [Google Scholar]
- 36.Moulin A., Demange L., Ryan J., Mousseaux D., Sanchez P., Bergé G., Gagne D., Perrissoud D., Locatelli V., Torsello A., Galleyrand J. C., Fehrentz J. A., and Martinez J. (2008) New trisubstituted 1,2,4-triazole derivatives as potent ghrelin receptor antagonists. 3. Synthesis and pharmacological in vitro and in vivo evaluations. J. Med. Chem. 51, 689–693 [DOI] [PubMed] [Google Scholar]
- 37.Holst B., Lang M., Brandt E., Bach A., Howard A., Frimurer T. M., Beck-Sickinger A., and Schwartz T. W. (2006) Ghrelin receptor inverse agonists: identification of an active peptide core and its interaction epitopes on the receptor. Mol. Pharmacol. 70, 936–946 [DOI] [PubMed] [Google Scholar]
- 38.Els S., Schild E., Petersen P. S., Kilian T. M., Mokrosinski J., Frimurer T. M., Chollet C., Schwartz T. W., Holst B., and Beck-Sickinger A. G. (2012) An aromatic region to induce a switch between agonism and inverse agonism at the ghrelin receptor. J. Med. Chem. 55, 7437–7449 [DOI] [PubMed] [Google Scholar]
- 39.Leyris J. P., Roux T., Trinquet E., Verdié P., Fehrentz J. A., Oueslati N., Douzon S., Bourrier E., Lamarque L., Gagne D., Galleyrand J. C., M'kadmi C., Martinez J., Mary S., Banères J. L., and Marie J. (2011) Homogeneous time-resolved fluorescence-based assay to screen for ligands targeting the growth hormone secretagogue receptor type 1a. Anal. Biochem. 408, 253–262 [DOI] [PubMed] [Google Scholar]
- 40.Kenakin T., Watson C., Muniz-Medina V., Christopoulos A., and Novick S. (2012) A simple method for quantifying functional selectivity and agonist bias. ACS Chem. Neurosci. 3, 193–203 [DOI] [PMC free article] [PubMed] [Google Scholar]
- 41.Black J. W., and Leff P. (1983) Operational models of pharmacological agonism. Proc. R. Soc. Lond. B Biol. Sci. 220, 141–162 [DOI] [PubMed] [Google Scholar]
- 42.Pantel J., Legendre M., Cabrol S., Hilal L., Hajaji Y., Morisset S., Nivot S., Vie-Luton M. P., Grouselle D., de Kerdanet M., Kadiri A., Epelbaum J., Le Bouc Y., and Amselem S. (2006) Loss of constitutive activity of the growth hormone secretagogue receptor in familial short stature. J. Clin. Invest. 116, 760–768 [DOI] [PMC free article] [PubMed] [Google Scholar]
- 43.Evron T., Peterson S. M., Urs N. M., Bai Y., Rochelle L. K., Caron M. G., and Barak L. S. (2014) G Protein and β-arrestin signaling bias at the ghrelin receptor. J. Biol. Chem. 289, 33442–33455 [DOI] [PMC free article] [PubMed] [Google Scholar]
- 44.Sivertsen B., Holliday N., Madsen A. N., and Holst B. (2013) Functionally biased signalling properties of 7TM receptors–opportunities for drug development for the ghrelin receptor. Br. J. Pharmacol. 170, 1349–1362 [DOI] [PMC free article] [PubMed] [Google Scholar]
- 45.Milligan G. (2003) Constitutive activity and inverse agonists of G protein-coupled receptors: a current perspective. Mol. Pharmacol. 64, 1271–1276 [DOI] [PubMed] [Google Scholar]
- 46.Nelson C. P., and Challiss R. A. (2007) “Phenotypic” pharmacology: the influence of cellular environment on G protein-coupled receptor antagonist and inverse agonist pharmacology. Biochem. Pharmacol. 73, 737–751 [DOI] [PubMed] [Google Scholar]
- 47.Moulin A., Brunel L., Boeglin D., Demange L., Ryan J., M'Kadmi C., Denoyelle S., Martinez J., and Fehrentz J. A. (2013) The 1,2,4-triazole as a scaffold for the design of ghrelin receptor ligands: development of JMV 2959, a potent antagonist. Amino Acids 44, 301–314 [DOI] [PubMed] [Google Scholar]
- 48.Petersen P. S., Woldbye D. P., Madsen A. N., Egerod K. L., Jin C., Lang M., Rasmussen M., Beck-Sickinger A. G., and Holst B. (2009) In vivo characterization of high Basal signaling from the ghrelin receptor. Endocrinology 150, 4920–4930 [DOI] [PubMed] [Google Scholar]
- 49.Mear Y., Blanchard M. P., Defilles C., Brue T., Figarella-Branger D., Graillon T., Manavela M., Barlier A., Enjalbert A., and Thirion S. (2014) Ghrelin receptor (GHS-R1a) and its constitutive activity in somatotroph adenomas: a new co-targeting therapy using GHS-R1a inverse agonists and somatostatin analogs. J. Clin. Endocrinol. Metab. 99, E2463–E2471 [DOI] [PubMed] [Google Scholar]
- 50.Bennett K. A., Langmead C. J., Wise A., and Milligan G. (2009) Growth hormone secretagogues and growth hormone releasing peptides act as orthosteric super-agonists but not allosteric regulators for activation of the G protein Gα(o1) by the Ghrelin receptor. Mol. Pharmacol. 76, 802–811 [DOI] [PMC free article] [PubMed] [Google Scholar]
- 51.Sivertsen B., Lang M., Frimurer T. M., Holliday N. D., Bach A., Els S., Engelstoft M. S., Petersen P. S., Madsen A. N., Schwartz T. W., Beck-Sickinger A. G., and Holst B. (2011) Unique interaction pattern for a functionally biased ghrelin receptor agonist. J. Biol. Chem. 286, 20845–20860 [DOI] [PMC free article] [PubMed] [Google Scholar]
- 52.Holst B., Mokrosinski J., Lang M., Brandt E., Nygaard R., Frimurer T. M., Beck-Sickinger A. G., and Schwartz T. W. (2007) Identification of an efficacy switch region in the ghrelin receptor responsible for interchange between agonism and inverse agonism. J. Biol. Chem. 282, 15799–15811 [DOI] [PubMed] [Google Scholar]
- 53.Stork P. J., and Schmitt J. M. (2002) Crosstalk between cAMP and MAP kinase signaling in the regulation of cell proliferation. Trends Cell Biol. 12, 258–266 [DOI] [PubMed] [Google Scholar]
- 54.Granata R., Settanni F., Biancone L., Trovato L., Nano R., Bertuzzi F., Destefanis S., Annunziata M., Martinetti M., Catapano F., Ghè C., Isgaard J., Papotti M., Ghigo E., and Muccioli G. (2007) Acylated and unacylated ghrelin promote proliferation and inhibit apoptosis of pancreatic beta-cells and human islets: involvement of 3′,5′-cyclic adenosine monophosphate/protein kinase A, extracellular signal-regulated kinase 1/2, and phosphatidylinositol 3-kinase/Akt signaling. Endocrinology 148, 512–529 [DOI] [PubMed] [Google Scholar]
- 55.Costantini V. J., Vicentini E., Sabbatini F. M., Valerio E., Lepore S., Tessari M., Sartori M., Michielin F., Melotto S., Bifone A., Pich E. M., and Corsi M. (2011) GSK1614343, a novel ghrelin receptor antagonist, produces an unexpected increase of food intake and body weight in rodents and dogs. Neuroendocrinology 94, 158–168 [DOI] [PubMed] [Google Scholar]
- 56.Sabbatini F. M., Di Fabio R., Corsi M., Cavanni P., Bromidge S. M., St-Denis Y., D'Adamo L., Contini S., Rinaldi M., Guery S., Savoia C., Mundi C., Perini B., Carpenter A. J., Dal Forno G., Faggioni F., Tessari M., Pavone F., Di Francesco C., Buson A., Mattioli M., Perdona' E., and Melotto S. (2010) Discovery process and characterization of novel carbohydrazide derivatives as potent and selective GHSR1a antagonists. ChemMedChem 5, 1450–1455 [DOI] [PubMed] [Google Scholar]
- 57.Halem H. A., Taylor J. E., Dong J. Z., Shen Y., Datta R., Abizaid A., Diano S., Horvath T., Zizzari P., Bluet-Pajot M. T., Epelbaum J., and Culler M. D. (2004) Novel analogs of ghrelin: physiological and clinical implications. Eur. J. Endocrinol. 151, S71–S75 [DOI] [PubMed] [Google Scholar]
- 58.Holst B., and Schwartz T. W. (2004) Constitutive ghrelin receptor activity as a signaling set-point in appetite regulation. Trends Pharmacol. Sci. 25, 113–117 [DOI] [PubMed] [Google Scholar]
- 59.Kenakin T., and Christopoulos A. (2013) Signalling bias in new drug discovery: detection, quantification and therapeutic impact. Nat. Rev. Drug Discov. 12, 205–216 [DOI] [PubMed] [Google Scholar]
- 60.Kenakin T. (2007) Functional selectivity through protean and biased agonism: who steers the ship? Mol. Pharmacol. 72, 1393–1401 [DOI] [PubMed] [Google Scholar]
- 61.Luttrell L. M., Maudsley S., and Bohn L. M. (2015) Fulfilling the promise of “biased” G protein-coupled receptor agonism. Mol. Pharmacol. 88, 579–588 [DOI] [PMC free article] [PubMed] [Google Scholar]


