Abstract
We report a novel approach to Fourier ptychographic microscopy (FPM) by using a digital micromirror device (DMD) and a coherent laser source (532 nm) for generating spatially modulated sample illumination. Previously demonstrated FPM systems are all based on partially-coherent illumination, which offers limited throughput due to insufficient brightness. Our FPM employs a high power coherent laser source to enable shot-noise limited high-speed imaging. For the first time, a digital micromirror device (DMD), imaged onto the back focal plane of the illumination objective, is used to generate spatially modulated sample illumination field for ptychography. By coding the on/off states of the micromirrors, the illumination plane wave angle can be varied at speeds more than 4 kHz. A set of intensity images, resulting from different oblique illuminations, are used to numerically reconstruct one high-resolution image without obvious laser speckle. Experiments were conducted using a USAF resolution target and a fiber sample, demonstrating high-resolution imaging capability of our system. We envision that our approach, if combined with a coded-aperture compressive-sensing algorithm, will further improve the imaging speed in DMD-based FPM systems.
OCIS codes: (170.0110) Imaging systems, (100.0100) Image processing, (110.0180) Microscopy, (110.1758) Computational imaging
1. Introduction
The performance of conventional optical microscopes has long been limited by the space-bandwidth product (SBP): a trade-off between the field-of-view (FOV) and the imaging resolution (related to the spatial bandwidth of optical imaging systems). Increasing the SBP in a conventional microscope will inevitably lead to system design complexity that minimizes optical aberrations [1]. In recent years, several methods have been proposed to overcome this limitation, which include synthetic-aperture microscopy [2–4], lens-free imaging [5–8], montaging microscope images [9], multiscale gigapixel photography [10], and Fourier ptychographic microscopy (FPM) [11–16]. Among these methods, FPM has been developed as an effective approach to achieve imaging with both large FOV and high resolution. In a FPM system, an objective lens with a low numerical aperture (NA) and a small magnification is used to capture images with a large FOV, while the resolution enhancement is realized by digitally processing the image sequence that corresponds to the sample scattering complex fields generated by illuminating waves at different incident angles [11]. It is known that when an oblique plane wave is used to illuminate a sample in a coherent imaging system, an extra linear phase will be added to the field in the sample plane. This results in a center shift of the scattered field’s spatial spectrum, allowing the information with higher spatial frequency to be captured by an objective lens with a low NA. By combining images with distinct illumination angles, containing different frequency components of the sample, one can numerically reconstruct an image with frequency support much wider than that allowed by the NA of the objective lens used. Image reconstruction methods incorporating conventional ptychography [17–20] and phase retrieval algorithms [21–23] have been proposed for FPM to reconstruct both the amplitude and phase distribution of samples with high resolution [21, 24, 25]. In biological imaging, the reconstructed phase contains sample information such as morphology and motion dynamics [26, 27]. Further improvements in the recovery algorithm have also been developed to eliminate the impact of illumination uncertainty and aberrations [28, 29].
In FPM systems, the illumination field is typically achieved by using a programmable LED array, placed under the sample stage in the far-zone. Every LED element in the array produces an illumination field at a specific incident angle. Thus, sample images, corresponding to sample scatterings from different illumination angles, can be obtained by lighting up one or multiple LED elements successively [30, 31]. If a condenser lens-based imaging system is used, the illumination field can be engineered with a low-cost liquid crystal display (LCD) placed in the back focal plane (BFP) of the condenser lens [32]. Beside the use of LCDs, the incident field direction has also been controlled with a wedge prism [33] or a galvo-mirror [34] placed in the illumination path. Despite all the efforts engineering the illumination, all current LED-based FPM systems suffer from low light power and camera dark noise, making them difficult to achieve robust high-speed imaging.
In this paper, we propose a novel FPM design to overcome the above mentioned issues such as low-light, illumination intensity non-uniformity, dark-noise limited detection, and low imaging speed. Instead of LEDs, we utilize a 532 nm high power laser as the illumination source, which allows for easy power scaling leading to high-speed imaging. To the best of our knowledge, this is the first experimental demonstration of a photon shot-noise limited FPM system. Also, for the first time, we implement a digital micromirror device (DMD) based aperture-coding for high-speed FPM. Unlike LED arrays, DMD has a more flexible illumination pattern control with close to a million independent micromirrors that can be used to engineer the illumination beam in all sorts of ways. Moreover, as evidenced by the experimental results, our FPM system is immune to laser speckle that was generally regarded as a hurdle in a laser-based FPM. It is also worth mentioning that our system has removed the need for a high performance camera, since only the camera well depth is relevant to the image sensitivity in our experiments.
In our FPM system, the DMD is placed in a plane conjugate to the BFP of the illumination objective (functioning as a condenser lens). Light reflected by the DMD micromirror corresponds to a point source at a specific location in the BFP. Therefore, by selectively turning on or off the mirrors on the DMD, the sample can be illuminated by plane waves at different incident angles. The sample scattered light is then collected by the imaging objective and relayed to an 8-bit CMOS camera. Our results demonstrate the principles and concepts of DMD-based laser-illumination FPM. Specifically, we have experimentally demonstrated the reconstruction of complex imaging fields with significantly improved resolution, compared with normal-incident laser illumination. Moreover, the achieved resolution is close to the theoretically predicted value.
2. DMD-based FPM setup
Figure 1 shows the configuration of our DMD-based FPM system. The illumination beam from a 532 nm laser source (Verdi V8, Coherence Inc.) is collimated and expanded before illuminating the DMD (DLP3000 DMD, Texas Instruments) at a 24-degree incident angle (24-degree angle is determined by the micromirror tilt angle. When a micromirror is on or off, its tilt angle is at 12 or −12 degrees with respect to the DMD surface normal direction). The employed DMD has 608684 binary micromirror elements, arranged in a rhombus array, with a 10.8 μm pitch (each micromirror dimension is 7.6 μm × 7.6 μm). By introducing a 4f system, the light reflected off the DMD is relayed onto the BFP of a 10X/0.16 illumination objective. Therefore, illumination plane waves with given incident angles can be achieved by coding the on/off state of each micromirror on the DMD. This establishes a one-to-one relationship between the position of the on-state micromirror and the center of the sample’s detectable spatial spectrum. In experiments, we use a group of 5 x 5 micromirrors instead of one to insure the best performance (refer to discussion on system limitations). The forward scattered beam is collected by a 1.25X/0.04 objective and imaged on an 8-bit CMOS camera (DCC1545M, Thorlabs) using a tube lens.
Fig. 1.
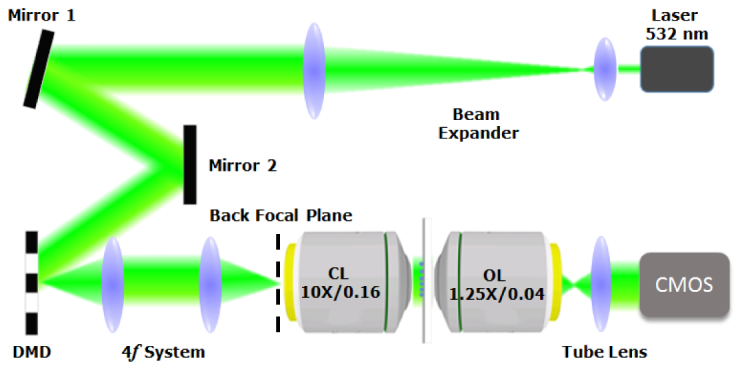
Configuration of the proposed DMD-based laser-illumination FPM system. DMD: digital micromirror device, CL: condenser lens or illumination objective, OL: objective lens.
3. Experiments and results
3.1 Image reconstruction algorithm
By sequentially turning on micromirrors on the DMD, we obtain several images with different angles of illumination. In our experiments, we turn on the micromirrors from the center, where the reflected beam illuminates sample normally [35]. This strategy is based on the fact that the energy distribution of most biological samples concentrates on the low-frequency components, and thus scanning from the low-frequency region speeds up the convergence speed of the FPM iterative algorithm. Our on-state micromirror scanning follows a ring pattern, and the corresponding sampling pattern in the Fourier domain is shown in Fig. 2. The spatial frequency scale is normalized by the wavenumber in vacuum, (), so that the relative values denote the enhanced NA when oblique illumination is used. This ring sampling pattern allows for recovering the Fourier ptychographic image with isotropic enhancements in resolution. Overall, 92 micromirrors are sequentially turned on, resulting in 92 raw sample images corresponding to different incident angles. It should be pointed out that as the DMD aperture scans, the beam distribution on the sample stays almost unchanged in order to ensure the best imaging performance. This is achieved by carefully aligning the 4f system between the DMD and the condenser objective lens, as illustrated in Fig. 1.
Fig. 2.
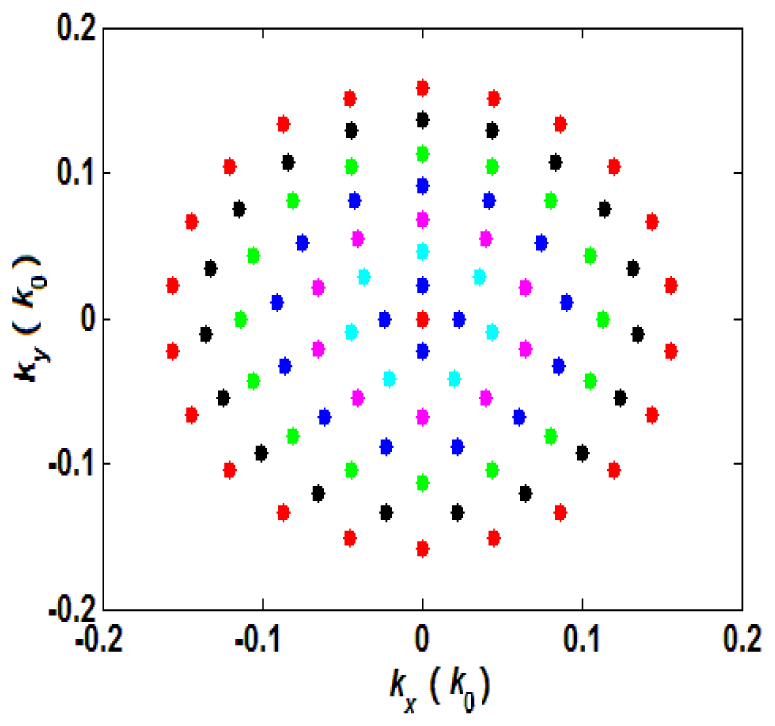
The Fourier-plane sampling pattern when using a ring scanning sequence for the on-state micromirrors on the DMD. This sequence is used to recover the Fourier ptychographic image with isotropic resolution enhancements.
The collected images are further used to reconstruct a high-resolution sample image. We use the iterative algorithm with aberration correction, namely the recovery of the pupil function, to process the captured image sequence and reconstruct the complex sample information in space. Notice that, we did not seek to improve the recovery algorithm. Thus, the image reconstruction method, as described in the following, is similar to those reported in [29, 30]. When the nth pixel in the DMD is set to be on, the spatial frequency shift induced by the generated oblique plane-wave illumination is denoted as Kn, where n = 1, 2 … 92. To give a better understanding of the reconstruction process, we describe the image retrieval process in detail below with the help of a graphic illustration shown in Fig. 3. Assume that the initial guess of the sample’s spatial spectrum and the pupil function are and , respectively. The updated spatial spectrum along with the updated pupil function by using the nth raw image intensity are obtained as follows:
Fig. 3.
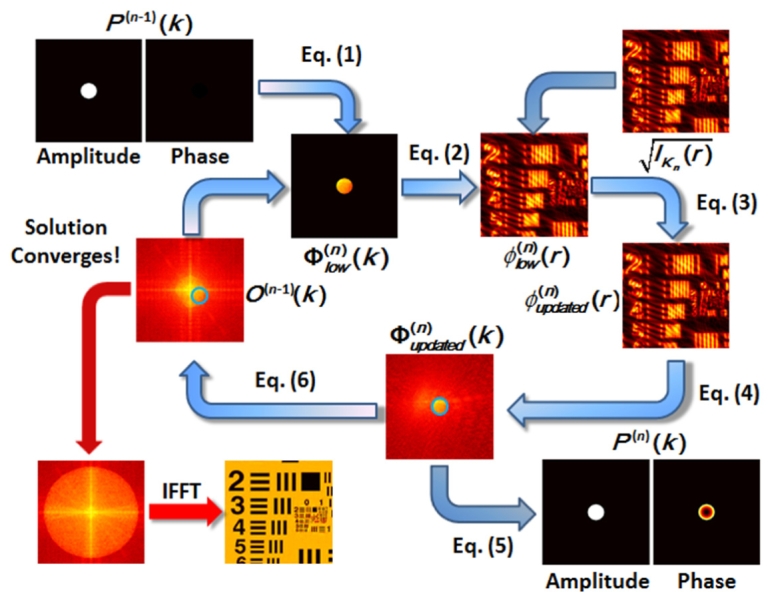
Schematic diagram of the whole image recovery procedure.
First, we simulate the imaging result (with low resolution limited by the NA of the imaging objective lens) from the non-updated sample spectrum, where an oblique plane wave with a spatial frequency shift of Kn is used as the illumination field, as is shown in Eq. (1) and Eq. (2),
| (1) |
| (2) |
where and are the non-updated spatial spectrum and pupil function, respectively; is the spatial spectrum of the simulated low-resolution image ; and denotes the two-dimension inverse Fourier transform.
Then, we update the simulated image amplitude with the experimentally measured intensity image, as shown in Eq. (3),
| (3) |
and obtain the spatial spectrum of the updated low-resolution image by using Eq. (4),
| (4) |
where denotes the two-dimensional Fourier transform.
Finally, the spatial spectrum of the updated low-resolution image is used to update the pupil function and sample spectrum, as is shown in Eq. (5) and Eq. (6), respectively,
| (5) |
| (6) |
where and are regularization constants for avoiding the possible zeros in the denominator. Since the pupil function is a circular low-pass function with a radius given by NA·k0, where k0 is the wave number in vacuum, the values appearing outside the circular region during the iterative process is set to zero. After using all the raw images to update the spatial spectrum of the analyzed sample, we repeat the iteration using the equations presented above until the solution converges. The computational time cost of one iteration, which uses 92 raw images 501 by 501 pixels each, is 16 seconds using a personal computer (Intel Core i5, 2.9 GHz). In our experiments, the solution converges after 5-10 iterations. Thus, the computation time required for one final output image is about 2 minutes.
3.2 Experimental results
To demonstrate the feasibility of resolution enhancement in our DMD-based FPM system, we first image a USAF target (Edmund Optics). The camera exposure time is set at 10 ms and the laser power is tuned to about 500 mW (the camera exposure time stays the same throughout the whole experiment). Figures 4(a) and 4(b) show the imaging results for Group 7, cropped from a larger field of view, obtained by using LED Köhler illumination and the Fourier ptychographic method, respectively. We find that individual elements in this group, which can hardly been resolved with LED Köhler illumination, are clearly visible with FPM. These results show that the proposed FPM system has the ability to break the imaging resolution barrier set by the NA of the objective. Figures 4(c) and 4(d) show the corresponding Fourier spectra of the images in Figs. 4(a) and 4(b), respectively. By using the DMD-based Fourier ptychographic process, we have significantly extended the spatial spectrum in Fig. 4(d) from Fig. 4(c), which is limited by the pupil function in a coherent imaging system. This demonstrates the feasibility of applying the DMD in FPM system for controlling the incident angle of the illumination beam, thus improving the imaging resolution. Due the fact that the used USAF target is a pure amplitude sample, we only present the sample amplitude images as the imaging results, even though the complex sample images have also been recovered in FPM.
Fig. 4.
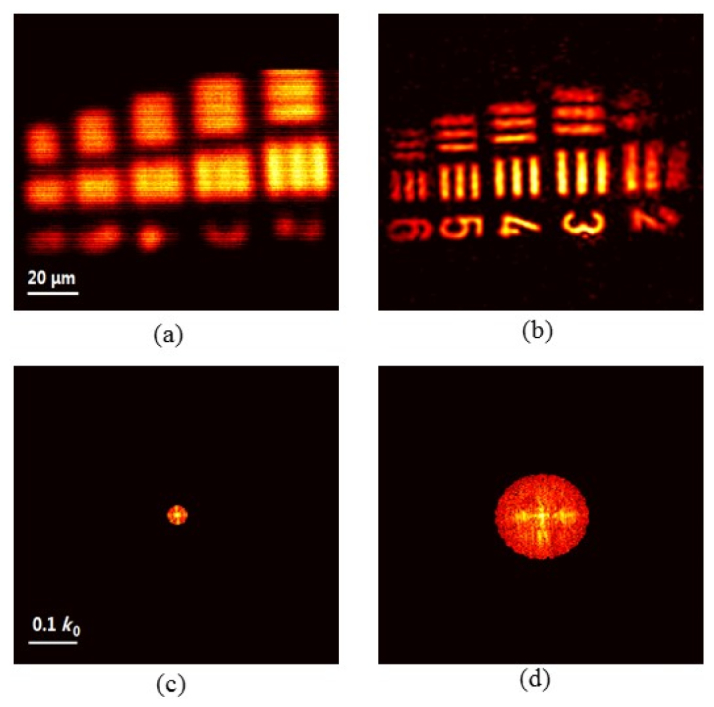
USAF target Group 7 imaging by using (a) the LED Köhler illumination and (b) the DMD-based Fourier ptychographic method. Fourier spectra of images obtained by using the (c) normal incidence illumination and (d) the DMD-based FPM. The reconstruction of the sample information in spatial and Fourier domain is implemented by running the self-developed software written in Matlab (see Visualization 1 (6.5MB, MP4) ).
To further investigate the resolution of our FPM system, we imaged Group 8 and Group 9 elements in the USAF target, which have smaller feature size. Figure 5(a) shows the Group 8 and Group 9 pattern to be imaged. A laser illumination-based image of Group 8 and Group 9, acquired by turning on all the DMD micromirrors, is shown in Fig. 5(b); the image indicates that the elements cannot be resolved due to poor resolution and the laser speckle noise. Next, we obtain Group 8 and Group 9 images using LED Köhler illumination and the DMD-based FPM as shown in Figs. 5(c) and 5(d), respectively. Intensity profiles of the lines shown in blue (Element 4, Group 8) in Figs. 5(a), 5(c) and 5(d) are displayed in Fig. 5(e). It is noted that the intensity profile of the image with LED Köhler illumination is relatively flat, while the profile of the FPM reconstructed image exhibits obvious peaks and valleys, indicating that the DMD-based FPM system has a lateral resolution beyond 2.76 μm (the designed separation between the line elements). By using the Abbe resolution criterion, the theoretical resolution is calculated as , which is close to the experimental value provided above. Furthermore, we can see that the used iterative algorithm can rule out the negative impact of the speckle noise on the reconstructed image. This will be further discussed in section 3.3.
Fig. 5.
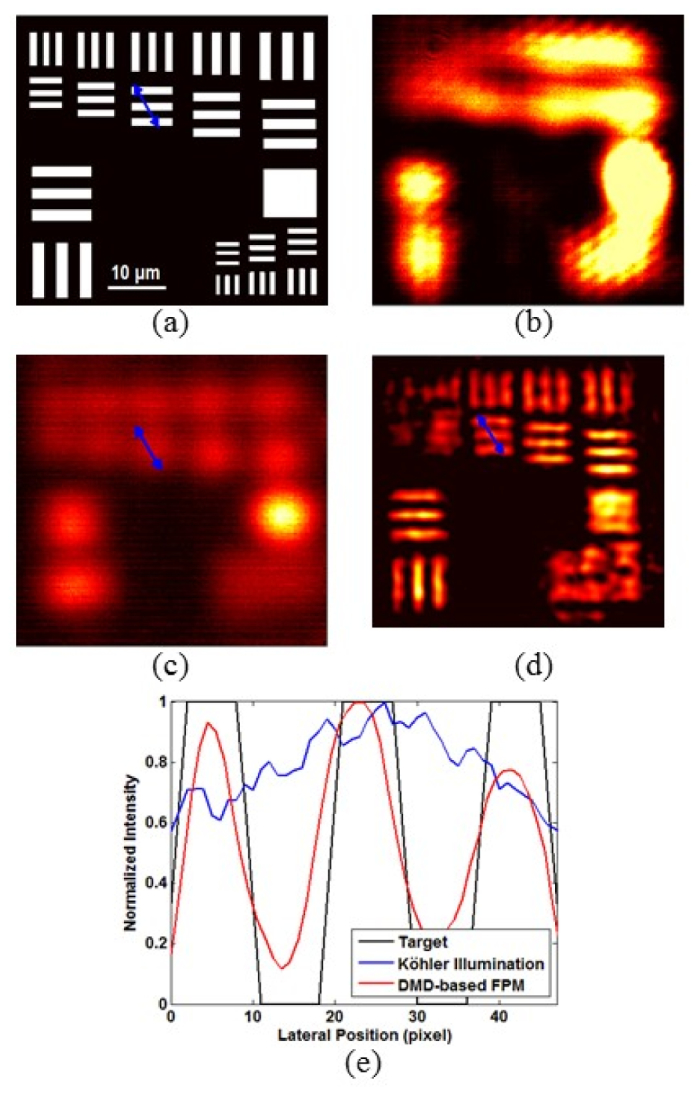
Imaging of Groups 8 and 9 elements in a USAF target. (a) Resolution target design pattern. (b) A raw image, corresponding to the laser illumination at normal incident angle. (c) Imaging of the same field-of-view with LED Köhler illumination. (d) Reconstructed image obtained by using the DMD-based FPM. (e) Intensity profiles of the lines shown in blue (Element 4, Group 8) in Figs. 5(a), 5(c) and 5(d). The intensity profile of the image with Köhler illumination is relatively flat, while the profile of the reconstructed image obtained by using the DMD-based FPM system shows obvious peaks and valleys, which demonstrates that the proposed FPM system has the lateral resolution of 2.76 μm.
We also demonstrate the FPM reconstruction of a thin cellulose fiber sample. Figure 6(a) shows the image obtained by using Köhler illumination with a laser source, whereas Figs. 6(b) and 6(c) show the reconstructed amplitude and wrapped phase images, respectively, of the sample using the proposed DMD-based FPM. This proves that the performance of our FPM system is robust and the proposed system can improve imaging resolution over the wide-field microscopy for various structures.
Fig. 6.
(a) Imaging various structures in a thin cellulose fiber sample using Köhler illumination with a laser source. Reconstructed (b) amplitude and (c) wrapped phase images obtained by using the DMD-based FPM.
3.3 Discussion
(1) Illumination intensity correction
The current LED array-based FPM systems require a correction algorithm for the intensity difference among various LED elements as well as the intensity fluctuations over time [28]. However, in our DMD-based laser-illumination FPM system, the illumination intensity remains constant over time on the sample plane, regardless of the laser illumination angle. This is achieved by imaging the DMD (via a 4f system) in the back aperture of a condenser lens used for illumination. Furthermore, our laser intensity fluctuation is less than 1%. Therefore, no illumination correction is needed in our FPM system. To experimentally validate this point, we reconstruct images without and with the illumination intensity correction, as shown in Figs. 7(a) and 7(b), respectively. As expected, no obvious difference is observed between the two reconstructions, indicating that our system is less susceptible to illumination intensity variations.
Fig. 7.
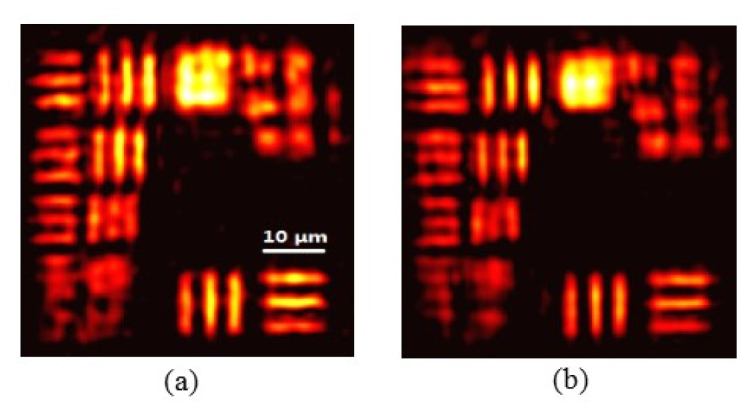
Reconstructed images obtained (a) without and (b) with illumination intensity correction. It is noted that no obvious difference exists between reconstructions (a) and (b), which means that the used condenser lens system for illumination provides us with uniform illumination and reduces the complexity of FPM algorithm.
(2) Laser speckle effects
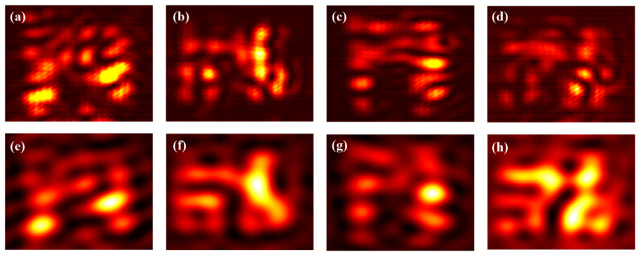
Traditionally, using a laser source for illumination in a coherent imaging system suffers the speckle noise, thus degrading the quality of the raw images on the CMOS camera. However, we find (as experimentally demonstrated above) that the speckle noise is removed during the iterative Fourier ptychographic image reconstruction. We attribute this capability of eliminating speckle noise to both the filtering operation in the reconstruction process as well as the averaging effect. To better explain speckle noise elimination in our DMD-based laser illumination FPM, we show four representative raw images in Figs. 8(a)-8(d) that were used to recover Group 8 and Group 9 elements of USAF target used in Fig. 5. The comparison of Figs. 8(a)-8(d) shows that the detected speckle noise is displayed as nearly fixed pattern. More importantly, the contained spatial frequency in the speckle noise is compatible with that of the pattern in the reconstructed high-resolution image shown in Fig. 5(d), which means that it is higher than the cut-off frequency of the imaging objective with a lower NA. Thus, we can conclude that the detected speckle arises from the interference of the light transmitted through the imaging objective and has higher frequency components than that allowed by the NA of the objective itself. In the presented iterative FPM algorithm, however, the pupil function with aberration recovery is consistently set to be a circular low-pass function. Furthermore, only the frequency components of raw data within this low-pass region are used to update the sample information. This is illustrated in Figs. 8(e)-8(h), which are the Figs. 8(a)-8(d) images filtered by the circular low-pass function, resulting in the rejection of high-frequency noise. Moreover, the speckle related to the finer sample features are averaged out during the iteration process, since each illumination angle leads to a corresponding unique speckle distribution, and we use a set of raw images to recover one high-resolution image. Therefore, the capability to eliminate the speckle noise allows us to use a high-power laser for illumination and a DMD to engineer illumination field for high resolution imaging.
Fig. 8.
(a)-(d) Four raw images that were used in Fig. 5 to reconstruct USAF target Group 8 and Group 9 elements using the FPM algorithm. (e)-(h) Corresponding filtered images of (a)-(d) using a circular low-pass function used to update the sample information in the iterative process.
(3) Current system limitations
First of all, our current DMD-based FPM system has a limitation on the achievable FOV, as seen in Fig. 4(b) where the information of the resolution target at the top right corner is partially missing after reconstruction. Two factors can potentially affect the FOV in a DMD based FPM. The first factor is the DMD chip size in the back focal of the illumination objective (or the condenser lens). A smaller DMD illumination spot in back focal plane will generate a wider sample illumination field, thus increasing the FOV. This can be achieved by using a larger DMD that allows for more demagnification to the back foal plane of the condenser from the DMD or reducing the number of micromirrors for each illumination spot. DMDs with more than four million pixels and sufficient internal patterns are available from Texas Instruments. However, at the time when we performed the experiments, we did have the access to a larger DMD. Thus, we tried reducing DMD illumination spots by using fewer numbers of micromirrors, such as 2 x 2 mirrors, to increase the sample illumination area. Unfortunately, this did not work out. The reason that we found out is that the signal to noise ratio (defined as the on-state mirror reflected light intensity to the off-state mirrors reflected intensity), which is related to the DMD dynamic range, is too low. Especially consider that the laser illumination, reflected off all the DMD off-state mirrors sitting at the Fourier plane, is focus to a spot in the image plane. This spot, as an accumulation of the half-million off-states mirrors signals, can be very strong due to the limited dynamic range (<1000:1) of the DMD. In order to solve this bright spot issue, we have very recently proposed implementing two DMDs in the illumination path to achieve two orders of magnitude improvement in signal to noise contrast. The second factor that limits the FOV is the imaging aperture of the illumination objective. This problem can be solved by replacing the illumination objective with an actual condenser lens that usually has a larger aperture, thus increasing the illumination area.
The currently achieved NA in our system is not very high, but can be improved in the future. The achieved NA is limited by the number of patterns, ~92, on the DMD that can be scanned at 4k Hz. There are DMDs that offer more patterns at much higher speed, but as a proof of concept, we were using the most basic DMD model, i.e., TI DLP3000.
(4) Camera sensitivity
Finally, we comment on the camera sensitivity. It is generally regarded that high sensitivity cameras, that capture high dynamic range (HDR) images, are needed for FPM experiments to be able to achieve robust image reconstructions. However, in our experiments we used a low-cost 8-bit Thorlabs camera without HDR. We found that we could still obtain high quality image reconstruction using our FPM system. We believe that it is due to the fact that we are using a high power laser that has sufficient photons to fully utilize camera well depth for all the camera pixels, thus making our system performance shot-noise limited. In the following, we give an explanation on this point. The camera noise has two main components (assuming camera read noise is negligible), one is the dark noise and the other one is the photon shot-noise due to the nature of photon fluctuation. The 8-bit USB camera that we use has a well depth of 10,000 e- and 30 e- dark noise. Under bright-field illumination, we tune up the illumination laser power to enable camera operation at the full well depth, thus, the photon-shot noise is ~ e- = 100 e- which is 3x more than the dark noise, i.e., shot-noise limited detection. For dark-field images, generated at larger illumination angles correspond to mirrors close to the edge, their intensities will reduce to ~1/10 of the bright-field images (see ref [11]). In this case, the shot-noise is ~ e- = 33 e-, which is still larger than the dark noise. Thus, we claim that our system is shot-noise limited. Notice that this type of noise, resulting from the nature of photon fluctuation, cannot be avoided. In contrary, for the LED illumination FPM methods, each individual LED element power is very weak, thus, the photon shot-noise is well below the dark noise when using a low dynamic range camera.
In a dark-field system (similar to larger angle illuminations in a FPM system), one can increase the photon flux, like was done in reference [30] where they used multiple LED elements for each illumination to beat the dark-noise, thus obtaining dark-field images with acceptable signal levels along with increased the imaging speed. Also, one can use cooling, subtraction, and averaging techniques to weaken the impact of dark noise when there are not enough imaging photons.
4. Conclusion
In conclusion, we have proposed and demonstrated a DMD-based laser-illumination FPM system for high-resolution imaging. This system has overcome major issues in the current FPM systems including low light detection, non-uniform illumination intensity, dark-noise limited detection, and low imaging speed. Experiments using USAF resolution target and thin cellulose fiber sample have been conducted, demonstrating 4x enhancement in image resolution. Finally, DMDs are capable of coding complicated patterns and displaying them at tens of kilohertz speed. Future work relates to combining a higher speed DMD with a fast camera (a Photron Fastcam camera with the frame rate over 10k fps) and an algorithm to achieve real-time FPM imaging. We expect our future DMD-based FPM system to be able to observe the dynamic biological processes with both high resolution and large FOV.
Supplementary Material
Acknowledgments
This work was supported by National Basic Research Program of China (973 Program) (No.2015CB352003), NIH 9P41EB015871-26A1, 1R01HL121386-01A1, the Hamamatsu Corp, and the Singapore-MIT Alliance for Science and Technology Center (BioSym IRG).
References and links
- 1.Lohmann A. W., Dorsch R. G., Mendlovic D., Zalevsky Z., Ferreira C., “Space-bandwidth product of optical signals and systems,” J. Opt. Soc. Am. A 13(3), 470–473 (1996). 10.1364/JOSAA.13.000470 [DOI] [Google Scholar]
- 2.Alexandrov S. A., Hillman T. R., Gutzler T., Sampson D. D., “Synthetic aperture Fourier holographic optical microscopy,” Phys. Rev. Lett. 97(16), 168102 (2006). 10.1103/PhysRevLett.97.168102 [DOI] [PubMed] [Google Scholar]
- 3.Hillman T. R., Gutzler T., Alexandrov S. A., Sampson D. D., “High-resolution, wide-field object reconstruction with synthetic aperture Fourier holographic optical microscopy,” Opt. Express 17(10), 7873–7892 (2009). 10.1364/OE.17.007873 [DOI] [PubMed] [Google Scholar]
- 4.Di J., Zhao J., Jiang H., Zhang P., Fan Q., Sun W., “High resolution digital holographic microscopy with a wide field of view based on a synthetic aperture technique and use of linear CCD scanning,” Appl. Opt. 47(30), 5654–5659 (2008). 10.1364/AO.47.005654 [DOI] [PubMed] [Google Scholar]
- 5.Bishara W., Su T.-W., Coskun A. F., Ozcan A., “Lensfree on-chip microscopy over a wide field-of-view using pixel super-resolution,” Opt. Express 18(11), 11181–11191 (2010). 10.1364/OE.18.011181 [DOI] [PMC free article] [PubMed] [Google Scholar]
- 6.Isikman S. O., Bishara W., Mavandadi S., Yu F. W., Feng S., Lau R., Ozcan A., “Lens-free optical tomographic microscope with a large imaging volume on a chip,” Proc. Natl. Acad. Sci. U.S.A. 108(18), 7296–7301 (2011). 10.1073/pnas.1015638108 [DOI] [PMC free article] [PubMed] [Google Scholar]
- 7.Greenbaum A., Luo W., Khademhosseinieh B., Su T.-W., Coskun A. F., Ozcan A., “Increased space-bandwidth product in pixel super-resolved lensfree on-chip microscopy,” Sci. Rep. 3, 1717 (2013). 10.1038/srep01717 [DOI] [Google Scholar]
- 8.Su T.-W., Xue L., Ozcan A., “High-throughput lensfree 3D tracking of human sperms reveals rare statistics of helical trajectories,” Proc. Natl. Acad. Sci. U.S.A. 109(40), 16018–16022 (2012). 10.1073/pnas.1212506109 [DOI] [PMC free article] [PubMed] [Google Scholar]
- 9.Mir M., Wang Z., Shen Z., Bednarz M., Bashir R., Golding I., Prasanth S. G., Popescu G., “Optical measurement of cycle-dependent cell growth,” Proc. Natl. Acad. Sci. U.S.A. 108(32), 13124–13129 (2011). 10.1073/pnas.1100506108 [DOI] [PMC free article] [PubMed] [Google Scholar]
- 10.Brady D. J., Gehm M. E., Stack R. A., Marks D. L., Kittle D. S., Golish D. R., Vera E. M., Feller S. D., “Multiscale gigapixel photography,” Nature 486(7403), 386–389 (2012). 10.1038/nature11150 [DOI] [PubMed] [Google Scholar]
- 11.Zheng G., Horstmeyer R., Yang C., “Wide-field, high-resolution Fourier ptychographic microscopy,” Nat. Photonics 7(9), 739–745 (2013). 10.1038/nphoton.2013.187 [DOI] [PMC free article] [PubMed] [Google Scholar]
- 12.Dong S., Bian Z., Shiradkar R., Zheng G., “Sparsely sampled Fourier ptychography,” Opt. Express 22(5), 5455–5464 (2014). 10.1364/OE.22.005455 [DOI] [PubMed] [Google Scholar]
- 13.Dong S., Guo K., Nanda P., Shiradkar R., Zheng G., “FPscope: a field-portable high-resolution microscope using a cellphone lens,” Biomed. Opt. Express 5(10), 3305–3310 (2014). 10.1364/BOE.5.003305 [DOI] [PMC free article] [PubMed] [Google Scholar]
- 14.Williams A., Chung J., Ou X., Zheng G., Rawal S., Ao Z., Datar R., Yang C., Cote R., “Fourier ptychographic microscopy for filtration-based circulating tumor cell enumeration and analysis,” J. Biomed. Opt. 19(6), 066007 (2014). 10.1117/1.JBO.19.6.066007 [DOI] [PMC free article] [PubMed] [Google Scholar]
- 15.Tian L., Waller L., “3D intensity and phase imaging from light field measurements in an LED array microscope,” Optica 2(2), 104–111 (2015). 10.1364/OPTICA.2.000104 [DOI] [Google Scholar]
- 16.Li P., Batey D. J., Edo T. B., Rodenburg J. M., “Separation of three-dimensional scattering effects in tilt-series Fourier ptychography,” Ultramicroscopy 158, 1–7 (2015). 10.1016/j.ultramic.2015.06.010 [DOI] [PubMed] [Google Scholar]
- 17.Rodenburg J., “Ptychography and related diffractive imaging methods,” Adv. Imag. Electron. Phys. 150, 87–184 (2008). 10.1016/S1076-5670(07)00003-1 [DOI] [Google Scholar]
- 18.Maiden A. M., Rodenburg J. M., Humphry M. J., “Optical ptychography: a practical implementation with useful resolution,” Opt. Lett. 35(15), 2585–2587 (2010). 10.1364/OL.35.002585 [DOI] [PubMed] [Google Scholar]
- 19.Maiden A. M., Humphry M. J., Zhang F., Rodenburg J. M., “Superresolution imaging via ptychography,” J. Opt. Soc. Am. A 28(4), 604–612 (2011). 10.1364/JOSAA.28.000604 [DOI] [PubMed] [Google Scholar]
- 20.Dierolf M., Menzel A., Thibault P., Schneider P., Kewish C. M., Wepf R., Bunk O., Pfeiffer F., “Ptychographic X-ray computed tomography at the nanoscale,” Nature 467(7314), 436–439 (2010). 10.1038/nature09419 [DOI] [PubMed] [Google Scholar]
- 21.Fienup J. R., “Phase retrieval algorithms: a comparison,” Appl. Opt. 21(15), 2758–2769 (1982). 10.1364/AO.21.002758 [DOI] [PubMed] [Google Scholar]
- 22.Maiden A. M., Rodenburg J. M., “An improved ptychographical phase retrieval algorithm for diffractive imaging,” Ultramicroscopy 109(10), 1256–1262 (2009). 10.1016/j.ultramic.2009.05.012 [DOI] [PubMed] [Google Scholar]
- 23.Rodenburg J. M., Faulkner H. M., “A phase retrieval algorithm for shifting illumination,” Appl. Phys. Lett. 85(20), 4795–4797 (2004). 10.1063/1.1823034 [DOI] [Google Scholar]
- 24.Ou X., Horstmeyer R., Yang C., Zheng G., “Quantitative phase imaging via Fourier ptychographic microscopy,” Opt. Lett. 38(22), 4845–4848 (2013). 10.1364/OL.38.004845 [DOI] [PMC free article] [PubMed] [Google Scholar]
- 25.Fienup J. R., “Reconstruction of a complex-valued object from the modulus of its Fourier transform using a support constraint,” J. Opt. Soc. Am. A 4(1), 118–123 (1987). 10.1364/JOSAA.4.000118 [DOI] [Google Scholar]
- 26.Popescu G., Quantitative Phase Imaging of Cells and Tissues (McGraw-Hill, 2011). [Google Scholar]
- 27.Bhaduri B., Edwards C., Pham H., Zhou R. J., Nguyen T. H., Goddard L. L., Popescu G., “Diffraction phase microscopy: principles and applications in materials and life sciences,” Adv. Opt. Photonics 6(1), 57–119 (2014). 10.1364/AOP.6.000057 [DOI] [Google Scholar]
- 28.Bian Z., Dong S., Zheng G., “Adaptive system correction for robust Fourier ptychographic imaging,” Opt. Express 21(26), 32400–32410 (2013). 10.1364/OE.21.032400 [DOI] [PubMed] [Google Scholar]
- 29.Ou X., Zheng G., Yang C., “Embedded pupil function recovery for Fourier ptychographic microscopy,” Opt. Express 22(5), 4960–4972 (2014). 10.1364/OE.22.004960 [DOI] [PMC free article] [PubMed] [Google Scholar]
- 30.Tian L., Li X., Ramchandran K., Waller L., “Multiplexed coded illumination for Fourier Ptychography with an LED array microscope,” Biomed. Opt. Express 5(7), 2376–2389 (2014). 10.1364/BOE.5.002376 [DOI] [PMC free article] [PubMed] [Google Scholar]
- 31.Dong S., Shiradkar R., Nanda P., Zheng G., “Spectral multiplexing and coherent-state decomposition in Fourier ptychographic imaging,” Biomed. Opt. Express 5(6), 1757–1767 (2014). 10.1364/BOE.5.001757 [DOI] [PMC free article] [PubMed] [Google Scholar]
- 32.Guo K., Bian Z., Dong S., Nanda P., Wang Y. M., Zheng G., “Microscopy illumination engineering using a low-cost liquid crystal display,” Biomed. Opt. Express 6(2), 574–579 (2015). 10.1364/BOE.6.000574 [DOI] [PMC free article] [PubMed] [Google Scholar]
- 33.Cotte Y., Toy F., Jourdain P., Pavillon N., Boss D., Magistretti P., Marquet P., Depeursinge C., “Marker-free phase nanoscopy,” Nat. Photonics 7(2), 113–117 (2013). 10.1038/nphoton.2012.329 [DOI] [Google Scholar]
- 34.Xiu P., Zhou X., Kuang C., Xu Y., Liu X., “Controllable tomography phase microscopy,” Opt. Lasers Eng. 66, 301–306 (2015). 10.1016/j.optlaseng.2014.10.001 [DOI] [Google Scholar]
- 35.Guo K., Dong S., Nanda P., Zheng G., “Optimization of sampling pattern and the design of Fourier ptychographic illuminator,” Opt. Express 23(5), 6171–6180 (2015). 10.1364/OE.23.006171 [DOI] [PubMed] [Google Scholar]
Associated Data
This section collects any data citations, data availability statements, or supplementary materials included in this article.


