Abstract
Speckle decorrelation analysis of optical coherence tomography (OCT) signal has been used in motion tracking. In our previous study, we demonstrated that cross-correlation coefficient (XCC) between Ascans had an explicit functional dependency on the magnitude of lateral displacement (δx). In this study, we evaluated the sensitivity of speckle motion tracking using the derivative of function XCC(δx) on variable δx. We demonstrated the magnitude of the derivative can be maximized. In other words, the sensitivity of OCT speckle tracking can be optimized by using signals with appropriate amount of decorrelation for XCC calculation. Based on this finding, we developed an adaptive speckle decorrelation analysis strategy to achieve motion tracking with optimized sensitivity. Briefly, we used subsequently acquired Ascans and Ascans obtained with larger time intervals to obtain multiple values of XCC and chose the XCC value that maximized motion tracking sensitivity for displacement calculation. Instantaneous motion speed can be calculated by dividing the obtained displacement with time interval between Ascans involved in XCC calculation. We implemented the above-described algorithm in real-time using graphic processing unit (GPU) and demonstrated its effectiveness in reconstructing distortion-free OCT images using data obtained from a manually scanned OCT probe. The adaptive speckle tracking method was validated in manually scanned OCT imaging, on phantom as well as in vivo skin tissue.
OCIS codes: (170.4500) Optical coherence tomography, (120.5800) Scanners, (030.6140) Speckle, (330.4150) Motion detection
1. Introduction
Speckle exists in images acquired with various imaging modalities using coherent sources, such as synthetic aperture imaging, ultrasound imaging, and optical coherence tomography (OCT) [1–3]. In OCT, speckle is often considered as noise that makes fine anatomic structures indiscernible. Over the years, researchers have developed various methods to suppress speckle noise in OCT images, including hardware compounding and digital signal-processing [4–10]. On the other hand, speckle also carries information. For example, speckle texture in OCT images has been used to differentiate tissue type [11–13]. Moreover, OCT speckle can be used to infer tissue or probe dynamics, with high accuracy that scales with OCT’s spatial resolution. For example, OCT speckle tracking has been used to quantify tissue deformation during photocoagulation [14, 15], provide visualization or quantitative measurement of blood flow [16–23], correct motion artifact in manually scanned OCT imaging, and etc [24, 25].
In our previous study, we have demonstrated that Pearson cross-correlation coefficient (XCC) between slightly displaced OCT Ascans had an explicit functional dependency on the magnitude of lateral motion [25]. Based on this finding, we developed a method for motion tracking by calculating XCC between subsequently acquired Ascans and converting XCC value to displacement. It was noted that there existed an optimized degree of decorrelation motion tracking. When the decorrelation between adjacent Ascans was very small (XCC close to 1) or very big (XCC close to 0), the result of motion tracking was dominated by noise. As a result, it was challenging to track motion speed that could vary in a large range using XCC between Ascans acquired with the same time interval. Therefore, there is an unmet need to achieve improved robustness in motion tracking based on OCT speckle analysis.
In this study, we evaluated the sensitivity (S) of speckle motion tracking using the derivative of function XCC (δx) on variable δx, where δx indicates lateral displacement. We demonstrated that the magnitude of the derivative could be maximized and the optimized motion tracking robustness could be achieved using signals with appropriate amount of decorrelation for XCC calculation. Based on this finding, we developed an adaptive speckle decorrelation analysis strategy for robust motion tracking. For adaptive speckle tracking, we calculated a set of XCC values using Ascan pairs obtained with different intervals and selected the XCC that maximized S for motion tracking. Instantaneous motion speed can be calculated by dividing the obtained displacement with time interval between Ascans involved in XCC calculation. We also implemented the algorithm for adaptive speckle decorrelation analysis in real-time using graphic processing unit (GPU) and demonstrated its effectiveness in reconstructing distortion-free OCT image using data obtained from a manually scanned OCT probe. Imaging experiments were conducted on phantom as well as in vivo skin tissue.
2. Principle
In this study, we use a Cartesian coordinate system (x, y, z) to describe the 3D space. Light beam propagates along z direction. x and y are lateral coordinates orthogonal to z axis. In general, motion in 3D space is characterized by a vector with three independent components, δx, δy and δz. We assume the sample is static and the motion is attributed to light beam scanning in x direction. Therefore, the only nonzero component in the motion is δx, and δy = δz = 0.
In our previous work, we theoretically derived and experimentally validated that the Pearson correlation coefficient XCC (ρ) between displaced Ascans has an explicit functional dependency on spatial displacement, as shown in Eq. (1) where ω0 indicates the beam waist of the probing beam [25]. Equation (1) suggests δx can be obtained from speckle decorrelation analysis.
| (1) |
An estimation of XCC () between Ascan It(z) and It+Δt(z) is calculated using Eq. (2).
| (2) |
In Eq. (2), < > indicates taking the mean value of a signal; It(z) and It+Δt(z) are the intensity of Ascans acquired at time t and t + Δt; mt = <It(z)> and mt+Δt = <It+Δt (z)> are the mean values for It(z) and It+Δt(z), respectively; σt and σt+Δt are the standard deviations for It(z) and It+Δt(z), respectively.
With XCC calculated using Eq. (2), an estimated value of lateral displacement () can be obtained as below.
| (3) |
Due to the nonlinear relationship between ρ(δx) and δx (Eq. (1)) and between and (Eq. (3)), the derivative of ρ(δx) on δx is not a constant. As a result, the same infinitesimal change in lateral displacement (dδx) will result in different change in XCC (dρ), for different value of δx. In practice, the estimation of ρ suffers from inaccuracy, and the same amount of inaccuracy in estimating ρ will lead to different amount of inaccuracy in estimating displacement δx. Therefore, it is critical to select an optimized operating point for decorrelation analysis. This is illustrated in Fig. 1 where the functional relationship between ρ and δx is plotted according to Eq. (1) with ω0 = 17μm. Consider three values of XCC (ρ1, ρ2 and ρ3 in Fig. 1) and assume the same amount of uncertainty ( ± 0.035) in XCC measurement (red bars in vertical direction). Clearly, the same uncertainty in XCC will lead to different amount of inaccuracy in displacement estimation (blue bars in horizontal direction with different length) for different operating point in speckle decorrelation analysis, due to the nonlinear relationship between ρ and δx.
Fig. 1.
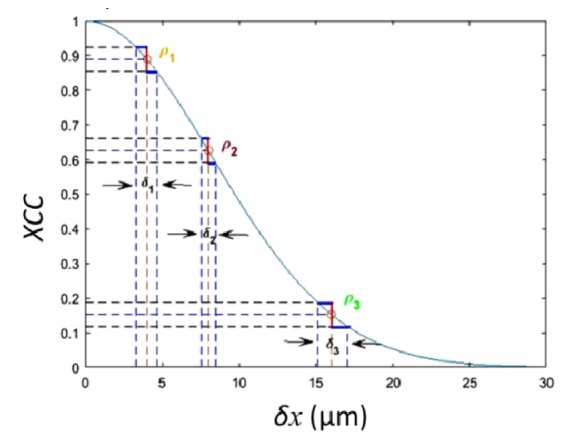
Person cross-correlation coefficient (XCC) versus lateral displacement δx. The same amount of uncertainty in calculating XCC results in different inaccuracy in estimating displacement δx.
We define the sensitivity (S) of speckle motion tracking as the absolute value of the derivative of ρ(δx) on δx (Eq. (4)) [26]. Figure 2 show how S varies as δx. Clearly, there exists a maximum value of S (Smax).
Fig. 2.
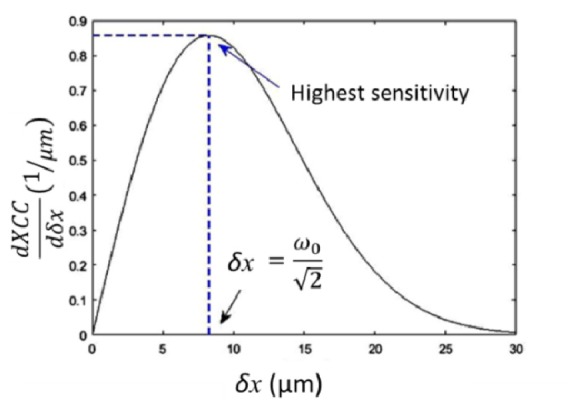
Sensitivity S at different values of displacement.
| (4) |
Analytically, the value of δx that maximizes S can be found when dS/dδx = 0. This relationship is shown explicitly in Eq. (5). Clearly, S is maximized when δxmax = ω0/√2 or ρmax = e-1/2.
| (5) |
In this study, we propose to use the XCC value that approximately equals ρmax and maximizes S for robust motion tracking. In other words, we select XCC value most sensitive to change in displacement δx for speckle decorrelation analysis [26]. This is because a large S is desirable for speckle tracking. With a large S, change in displacement δx can result in measurable change in XCC. Otherwise, the measurement of XCC is overwhelmed by random noise [27]. For example, if two Ascans with small displacement (δx<< ω0) or large displacement (δx>>ω0) are chosen for decorrelation analysis, S is approximately 0, leading to a compromised sensitivity in speckle motion tracking.
Theoretically, there may exist an optimal ω0 for the proposed method. However, the beam waist ω0 is determined by the optics of imaging probe. Once the probe is designed and fabricated, ω0 remains the same. Therefore, it is challenging to practically optimize ω0 in manually scanned OCT instruments.
In our robust speckle tracking, we will calculate XCC values using multiple pairs of Ascans: It and It+Δt, It and It+2Δt, It and It+3Δt, …, It and It+NΔt, where Δt is the time interval between the acquisition of adjacent OCT Ascans. Using N different pairs of Ascans, N different values of XCC are obtained: ρΔt, ρ2Δt, ρ3Δt,… and ρNΔt. With sufficiently small Δt and sufficiently large N, we will be able to find one XCC close enough to ρmax. We can thus choose the value of XCC closest to ρmax to calculate displacement for robust motion tracking.
3. OCT system
We used a spectral domain OCT (SD OCT) engine at 1.3μm for this study. More details of this system can be found in our previous work [23]. The system uses a superluminescent diode as light source (SLD1325 Thorlabs, 100 nm bandwidth, corresponding to a 7.4 μm axial resolution). Interferometric signal is detected by a CMOS InGaAs camera (SUI1024LDH2, Goodrich). A frame grabber (PCIe-1433, National Instrument) takes the interferometric signal from the camera. Results in 4.1 were obtained based on a Michelson interferometer with reference and sample arms. In the sample arm of the Michelson interferometer, the light beam is scanned by a galvanometer and a 3X scanning lens (SLM04, Thorlabs) is used in front of the sample. The e−1 lateral resolution of the system is 17 μm according to experimental characterization and therefore ω0 = 17 μm. This configuration allowed us to accurately control the transverse motion and thus validate the proposed adaptive speckle tracking method. Data analysis was performed with Matlab. Signal to noise ratio (SNR) for images used in speckle decorrelation analysis in Section 4.1 was 43 dB, according to the following definition: SNR = 10log10(Imean2/σ2). Here Imean indicates mean signal amplitude and σ2 indicates noise variance. Results in 4.2 were obtained from a common path interferometer and signal was processed in real-time with GPU in a host computer (Dell Precision T7600) based on software developed in C + + (Microsoft Visual Studio, 2012). In the common path interferometer, a single mode fiber with flat tip was used as probe arm. Reference light derived from the fiber tip and shared the same probe path as sample light. Such a system acquired OCT signal from a simple, robust single mode fiber probe. The e−1 lateral resolution ω0 as 43 μm for the depth range used in speckle tracking according to experimental characterization.
4. Results
4.1 Experimental validation of adaptive speckle decorrelation analysis for motion tracking
To validate Eq. (1) and (4), we performed Bscan imaging on a phantom made by mixing titanium dioxide with optical epoxy. Bscan images were obtained by steering the light beam in x direction with a galvanometer scanner (Thorlabs, GVS012, 99.9% linearity and a 400 μs step response time). The galvanometer was driven by sawtooth functions with different amplitude to acquire different Bscan images at an 89 Hz frame rate. For each Bscan, we excluded the first 150 Ascans (1600 μs after the Bscan started) and used the rest of Ascans for speckle decorrelation analysis, so that the only source of motion was constant speed lateral scanning of light beam in x direction. With identical line-scan interval (Δt = 10.9 μs) of the camera, the displacement between adjacent Ascans was proportional to voltage applied to the galvanometer.
The relationship shown in Eq. (1) assumes fully developed speckle with scatterers in different spatial location described by identical but independent random variables [25, 29]. To validate the statistics of speckled signal, we calculated the probability density functions (PDF) of OCT signal (Bscan). To obtain the PDF, we first converted each OCT Bscan to unitless image by normalizing its magnitude with its mean value. Afterwards, we calculated the probability for normalized, unitless signal magnitudes. Results corresponding to Bscans obtained with different scanning speeds are shown as thin lines with different colors in Fig. 3(a). In Fig. 3(a), Rayleigh distribution (thick black curve) which is the standard PDF for fully developed speckle (for imaged normalized to its mean value) is also shown [28, 29]. Our results suggests PDFs obtained from experimental data are highly consistent with standard Rayleigh PDF and the model of fully developed speckle is valid for data obtained in our experiments.
Fig. 3.
(a) PDFs of OCT signals used for speckle decorrelation analysis and standard Rayleigh PDF; comparison between theoretical and experimental results for (a) XCC and (b) S at different displacements.
Notably, speckle statistics of OCT signal particularly higher order statistics such as correlation depends on its lateral resolution which varies as imaging depth. Therefore, we used segment of Ascan signal in the vicinity (100 μm) of beam waist to calculate PDF and perform speckle tracking. The beam waist was located 150 μm under the sample surface and 300μm from the equal optical-path-length plane. The depth range was chosen because: first, the chosen Ascan segments had high SNR, due to focused light beam, small light attenuation, and negligible sensitivity roll-off; second, our model assumed a constant beam diameter and ω0 remained approximately constant within the 100μm segment which was significantly smaller compared to the 700 μm Rayleigh range of the incident light beam, although ω0 generally depends on depth. In addition, ω0 = 17 μm is valid for light beam in vacuum (or air). The beam waist in our phantom (ωphantom) was smaller than ω0 and could be obtained by dividing ω0 with phantom refractive index (n = 1.4). Therefore, δxmax = ωphantom / = ω0/. Given ω0 = 17 μm, the optimal displacement should be approximately 8.6 μm, as to be shown in our experimental results.
To validate Eq. (1) using the same experimental data leading to Fig. 3(a), we calculated the cross-correlation coefficient between subsequently acquired Ascans, It and It+Δt, in Bscan image obtained with spatial sampling interval δx0. The resultant XCC is denoted as ρt(δx0). We averaged ρt(δx0) at different t to obtain ρ(δx0). Similarly, ρ(δx1), ρ(δx2), ρ(δx3) … were obtained using Bscan images with spatial sampling interval δx1, δx2, δx3…. δx0, δx1, δx2, δx3… were in a range from 1μm to 33 μm. The results are shown in Fig. 3(b) as blue circles. Error bars were obtained using the standard deviation of ensemble values of XCC. Figure 3(b) also shows the values of XCC at different displacements according to Eq. (1) (red curve with ω0 = 17μm). In addition, we validated the relationship between sensitivity (S) in motion tracking and displacement (δxk) shown in Eq. (4) using experimental data. For Bscan image obtained with spatial sampling interval δxk, we compared ρ(δxk) and ρ(δxk + dδx) obtained from Ascan pairs with displacements δxk and δxk + dδx, and calculated the ratio between [ρ(δxk + dδx)-ρ(δxk)] and dδx for the evaluation of S. The results are shown in Fig. 3(c) (circle: experimental data; red curve: theory). Figure 3(b) and 3(c) clearly validated the effectiveness of Eq. (1) and (4).
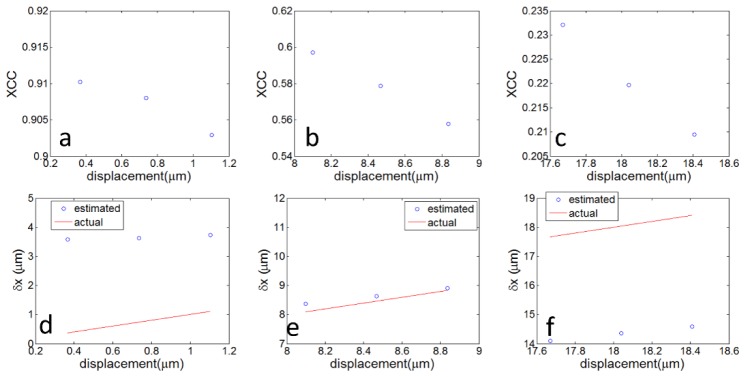
According to discussion in Section 2 and results shown in Fig. 3, it is ideal to select Ascans with appropriate displacement (δxmax = ω0/ and appropriate degree of decorrelation (ρmax = e-1/2) for speckle tracking. To further validate this, we performed speckle decorrelation analysis using data from a Bscan with 0.37 μm lateral scanning interval. We calculated XCC between Ascans with small time interval (Δt, 2Δt, and 3Δt) and thus small lateral displacements (0.37 μm, 0.74 μm and 1.11 μm). We also calculated XCC between Ascans with medium time interval (21Δt, 22Δt, and 23Δt) and thus medium lateral displacements approximating δxmax = 8 μm (7.73 μm, 8.09 μm and 8.47 μm); as well as XCC between Ascans with large time interval (45Δt, 46Δt, and 47Δt) and thus large lateral displacements (16.56 μm, 16.93 μm and 17.30 μm). In this analysis, Ascans with large displacement (17 μm) were obtained at a 480μs time interval. This time interval was small enough so that the decorrelation was induced by speckle rather than other random factors. XCC values obtained are shown in Fig. 4(a), 4(b) and 4(e), corresponding to small, appropriate and large degree of decorrelation. Using XCC values obtained, we extracted displacements using Eq. (3) and show results in Fig. 4(d), 4(e) and 4(f). Figure 4(d) shows that the estimated magnitude of motion is larger than its actual value if the XCC values are close to 1. With small displacement and thus XCC value close to 1, the decorrelation is dominated by random noise in OCT signal, resulting in an overestimated motion. On the other hand, motion is underestimated in Fig. 4(f) where Ascans with large displacement are used to calculate XCC. This is because the expected value of XCC is extremely small (Eq. (1), Fig. 1) when δx is large and the estimated displacement is determined by the non-zero noise floor in XCC measurement. In comparison, displacements obtained using XCC values close to s ρmax (ρmax = e-1/2) (Fig. 4(b) and 4(e)) are consistent with actual displacements. Results in Fig. 4 show that it is critical to use Ascans with appropriate degree of decorrelation for motion tracking.
Fig. 4.
(a) XCC values calculated using Ascans with small displacements; (b) XCC values calculated using Ascans with medium displacements; (c) XCC values calculated using Ascans with large displacements; (d) displacements obtained using XCC values in Fig. 4(a); (e) displacements obtained using XCC values in Fig. 4(b); (f) displacements obtained using XCC values in Fig. 4(c).
In practice, motion of sample or probe in OCT imaging can have speed varying in a large range and two Ascans acquired with a fixed time interval can have very small or very large displacement. According to results shown in Fig. 3 and Fig. 4, XCC between subsequently acquired Ascans can be close to 1 or close to 0, corresponding to a limited accuracy in motion tracking. Therefore, adaptive speckle decorrelation analysis that estimates displacement using Ascans with XCC close to ρmax can achieve more robust speckle tracking over a large range of motion speed.
To demonstrate the advantage of the adaptive motion tracking algorithm, we compared the results obtained from different speckle decorrelation analysis strategies for motion tracking, as shown in Fig. 5. We used OCT data in Bscans obtained with different lateral scanning speeds in our analysis and the horizontal axis in Fig. 5 indicates lateral scanning speeds.
Fig. 5.
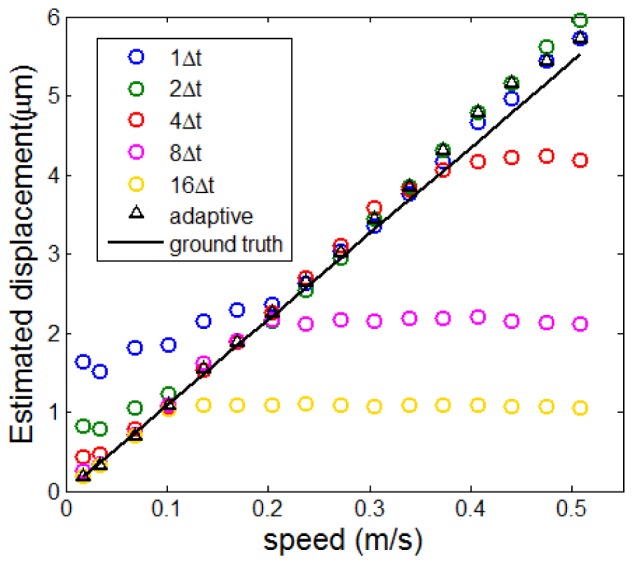
Displacement estimation (circles) based on XCC between Ascans with fixed time intervals at different lateral scanning speeds; displacement estimation (triangles) based on adaptive XCC calculation for robust motion tracking at different lateral scanning speeds.
For Bscan acquired with a certain lateral scanning speed, we calculated XCC values (averaged) using Ascan pairs with different time intervals (Δt, 2Δt, 4Δt, 8Δt, and 16Δt) and hence displacement between Ascan pairs shown as circles in different colors in Fig. 5. Notably, when Ascans with time interval kΔt were used for speckle tracking, the resultant XCC and the lateral displacement (δx(kΔt)) corresponded to time interval kΔt. Therefore, the displacement between subsequently obtained Ascans was calculated by dividing δx(kΔt) with k. On the other hand, we performed adaptive decorrelation analysis using the same set of experimental data. For each Bscan acquired with a certain lateral scanning speed, we calculated XCC values (averaged) using Ascan pairs with different time intervals (Δt, 2Δt, 3Δt, 4Δt…., 16Δt) and denoted the results as ρΔt, ρ2Δt, ρ3Δt, ρ4Δt, …, ρ16Δt. We then chose the XCC value (ρmΔt) closest to ρmax = e-1/2 to calculate the displacement δx(mΔt) between two Ascans acquired with time interval mΔt and the displacement between adjacent Ascans which was δx(mΔt)/m. Results obtained from adaptive speckle decorrelation analysis are shown as black triangles in Fig. 5. To evaluate the performance of different speckle tracking methods, we also show the actual displacement between adjacent Ascans in Fig. 5 (solid black line) according to the known scanning speed and Ascan acquisition rate. As shown in Fig. 5, displacement obtained from XCC between Ascans with fixed time interval deviates from its actual value, no matter the time interval is small or large. Displacement estimated by calculating XCC between Ascans with small time intervals (Δt and 2Δt) is larger than its actual value for small speed. On the other hand, displacement obtained by calculating XCC between Ascans with large time intervals (4Δt, 8Δt and 16Δt) is smaller than its actual value for large speed. This is also consistent with results shown in Fig. 4(d) and 4(f). In comparison, adaptive speckle tracking provides a closer approximation to actual displacement over a large range of motion speed and outperforms speckle tracking based on XCC between Ascans with fixed time intervals.
From a different perspective, inaccuracy in displacement quantification for small or large decorrelation (XCC≈1 or XCC≈0) is due to the small value of motion tracking sensitivity, S. As shown in Fig. 3(c), when displacement is very small (XCC≈1) or value large (XCC≈0), S is approximately 0. With extremely small S, change in displacement does not lead to measurable change in XCC and therefore the estimated displacement appears saturated.
To further validate that our adaptive speckle decorrelation analysis can track motion with nonconstant speed, we applied sinusoidal voltage with period T (T = 5.5 ms) to the galvanometer scanner and acquired OCT signal within a time span of 2T. We stacked sequentially acquired Ascans and show the resultant 2D data in Fig. 6(a). Due to the sinusoidal voltage applied to the galvanometer, the speed of lateral scanning was not constant. Therefore, distortion artifacts are clearly visible in Fig. 6(a). To obtain the magnitude of speed by analyzing acquired OCT signal, we performed adaptive speckle decorrelation analysis to derive the speed of motion and show the result as dashed black curve in Fig. 6(b). For comparison, we used Ascans acquired subsequently with time interval Δt for XCC calculation and motion tracking, with results shown the red dashed curve in Fig. 6(b). We also used Ascans pairs acquired with larger time interval (10Δt) for motion tracking, with results shown the green dashed curve in Fig. 6(b). The ground truth scanning speed is plotted as the solid black curve for comparison. Results of motion tracking shown in Fig. 6(b) correspond to two periods of the sinusoidal voltage and four speed peak can be observed because speckle decorrelation analysis extracts the magnitude of lateral motion that can have positive or negative values. Clearly, adaptive speckle decorrelation analysis provides a better approximation of the beam scanning speed.
Fig. 6.
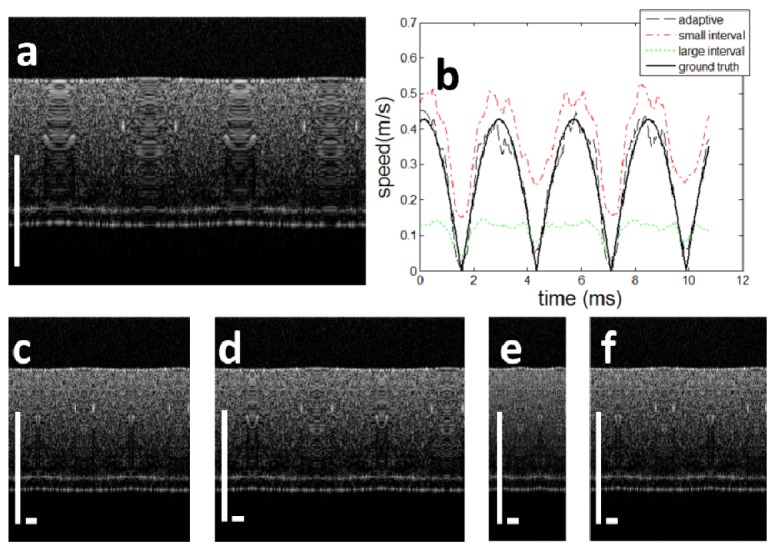
(a) 2D images of sequentially obtained Ascans; (b) estimated speed using small interval, large interval and adaptive speckle decorrelation analysis. 2D images of Ascans after distortion artifact corrected based on (c) the proposed adaptive speckle decorrelation analysis strategy, (d) speckle decorrelation with small time interval, (e) large time interval and (f) use the ground truth beam scanning speed.
Using scanning speeds obtained from different speckle decorrelation analysis strategies, we re-sampled Ascans shown in Fig. 6(a) to correct motion artifact due to nonconstant beam scanning speed. Reconstructed images are shown in Fig. 6(c), 6(d) and 6(c), based on adaptive speckle decorrelation analysis, speckle decorrelation analysis of Ascans with small time interval (Δt = 10.9 μs), and speckle decorrelation analysis of Ascans with large time interval (10Δt = 109 μs). We also used the actual sinusoidal beam scanning speed to correct image artifact and obtained Fig. 6(f). Compared to Fig. (d) and (e), Fig. 6(c) better resembles Fig. 6(f), suggesting that more robust motion tracking through adaptive speckle decorrelation analysis can provide better correction of image artifact.
4.2 Real-time distortion-free manual-scanning OCT imaging based on adaptive speckle decorrelation analysis
To demonstrate the effectiveness of adaptive speckle tracking in real-time imaging, we developed software to reconstruct distortion-free OCT images using signals obtained from a manually scanned probe. The algorithm is described in detail below. With M spectral interferograms acquired as a frame by the frame grabber, we subtracted reference spectrum from the measured interferograms, converted data from wavelength space to wavenumber space and performed fast Fourier transform (FFT) to obtain M Ascans. Afterwards, adaptive speckle decorrelation analysis illustrated in Fig. 7 was performed. For the ith Ascan (Ii) in the frame acquired at time t, we used Eq. (2) to calculate XCC values between Ii and subsequent Ascans, Ii + 1, Ii + 2, Ii + 3, …, acquired at t + Δt, t + 2Δt, t + 3Δt, …, with Δt indicating the time interval between the acquisition of adjacent Ascans (Fig. 7(a)). Resultant XCC values, ρi,Δt, ρi,2Δt, ρi,3Δt,…, were expected to be different as illustrated in Fig. 7(b), according to our theoretical analysis and experimental results shown in Fig. 1 and Fig. 3(b). We then selected XCC that was closest to ρmax (dashed red line in Fig. 7(b)) for robust motion tracking, as indicated by the red arrow in Fig. 7(b). Denote the data point used for displacement calculation as ρi,mΔt. The lateral displacement between the ith Ascan Ai and the (i + m)th Ascan Ii + m could be calculated using Eq. (3): δxi,m = ω0[ln(1/ρi,m)]1/2. Assuming constant motion during the acquisition of Ii, Ii + 1, Ii + 2, Ii + 3, Ii + 4 …, Ii+k, we were able to estimate the displacement between the ith Ascan and the subsequent Ascan: δxi = δxi,m/m. Procedures for XCC calculation and displacement estimation shown in Fig. 7(a) and 7(b) were performed for all M Ascans obtained in the frame, to obtain displacements between adjacent Ascans, δx1, δx2, …, δxM-1. Due to the nonconstant beam steering speed in manual scanning, δx1, δx2, …, δxM-1 had different values, as shown in Fig. 7(c). For distortion-free OCT imaging, we established a grid to place Ascans with identical interval δxs. Signal values of the grid were obtained through interpolation using raw Ascan data and actual displacement values (δx1, δx2, …, δxM-1) derived from adaptive speckle decorrelation analysis. Given spatially oversampled OCT signal, we were able to obtain Mdecorr (Mdecorr<M) Ascans to form a distortion-free 2D image (I0). We then attached I0 to the end of the existing 2D distortion-free image and update the display.
Fig. 7.
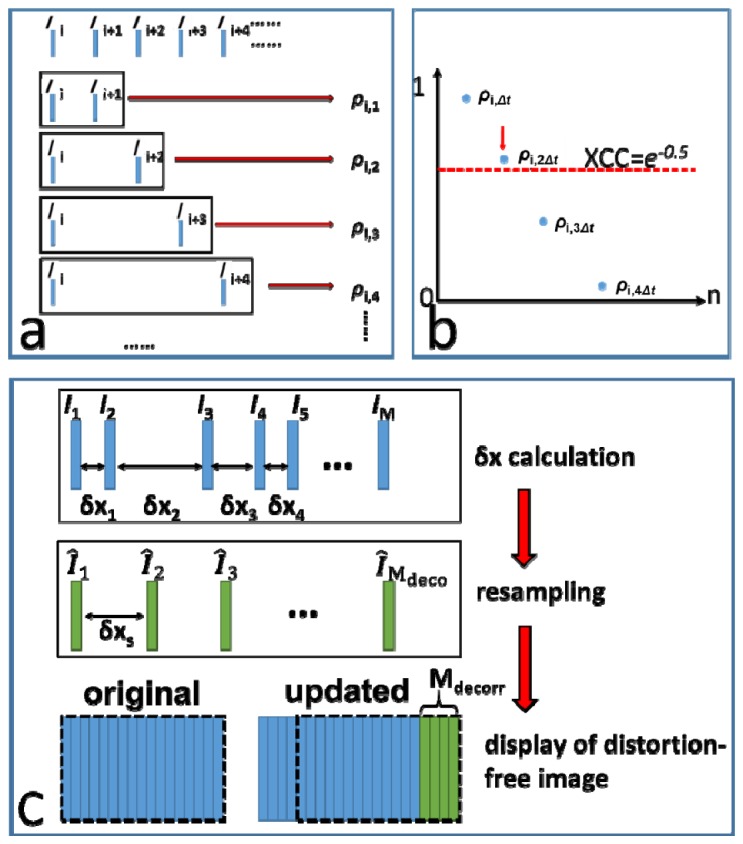
(a) Calculation of cross-correlation between Ascan pairs acquired with different time intervals; (b) the value of XCC closest to ρmax is chose for robust motion tracking; (c) reconstruct distortion-free 2D OCT imaging and update display.
The above-described software was implemented in real-time, summarized as flow chart shown in Fig. 8(a). To estimate the motion speed between adjacent Ascans, we calculated 16 values of XCC using Ascans with different time intervals. Procedures indicated by red boxes were implemented using GPU. Signal processing speed was analyzed using NVidia Nsight embedded in Visual Studio. Ascans were processed on average at a speed of 120 kHz which is faster than the highest data acquisition speed of the line scan camera used in our OCT system (92 kHz). The most time consuming computation tasks in our algorithm are shown Fig. 8(b).
Fig. 8.
(a) Data processing flowchart for imaging reconstruction based on robust motion tracking using adaptive speckle decorrelation analysis.
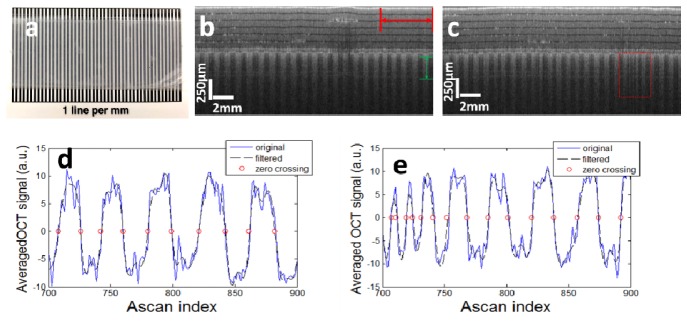
To validate the robustness of adaptive speckle tracking in real-time imaging, we made a phantom (photo shown in Fig. 9(a)) by covering 1 line/mm Ronchi Ruling Pattern with multiple layers of Scotch tapes and performed manual scanning using a single mode fiber OCT probe. Signal was processed in real-time using our home-made GPU software. Motion was limited in x dimension. To prevent axial motion (z dimension) from decorrelating the signal, we maintained the probe at the same height from the phantom surface during imaging. In addition, we constrained the motion with a barrier along x direction to exclude motion in y direction. We compared images reconstructed using XCCadaptive that was obtained through adaptive speckle decorrelation analyses, with images reconstructed using XCC between adjacent Ascans (XCCadj). Notably, signal within depth range corresponding to Scotch tape layers was used to calculate XCC. Otherwise, the periodical lateral structure from the ruling pattern might affect the accuracy of speckle tracking. Images obtained using XCCadaptive and XCCadj are shown in Fig. 9(b) and 9(c). Clearly, Fig. 9(b) shows well defined periodical structure while residual distortion exists in Fig. 9(c). Distortion artifact can be seen more clearly within the dashed rectangular box in Fig. 9(c). To quantitatively compare the accuracy of motion tracking based on XCCadaptive and XCCadj, we averaged OCT signal within depth range indicated by the green arrow in Fig. 9(b). The result was subtracted with its mean value (Fig. 9(d) and 9(e), blue curve) and low pass filtered (Fig. 9(d) and 9(e), black, dashed curve). We then identified zero-crossing points corresponding to the edge of the bars in the ruling pattern, as indicated by red circles in Fig. 9(d) and 9(e). For clear visualization of zero-crossing points, Fig. 9(d) and 9(e) show results of edge detection within lateral range indicated by the red arrow in Fig. 9(b). Figure 9(d) shows a more uniform distribution of zero-crossing points compared to Fig. 9(e). The actual distance between adjacent zero-crossing points is the same for different bars in the periodical ruling pattern and a more uniform distribution of zero-crossing points suggests better performance in motion artifact removal. Therefore, results in Fig. 9(d) and 9(e) show that motion tracking based on XCCadaptive outperformed motion tracking based on XCCadj. We repeated the manual scanning experiments for four times, and performed motion tracking using XCCadaptive and XCCadj, respectively. To evaluate the quality of reconstructed image in terms of motion artifact, we performed zero-crossing detection on OCT signal and obtained the number of Ascans (NAscan_bar) between adjacent zero-crossing points. NAscan_bar had different values for different pairs of zero-crossing points and the robustness of motion tracking was quantified using the ratio between the standard deviation and the mean of NAscan_bar, denoted as Radaptive and Radj, for images reconstructed using XCCadaptive and XCCadj. Radaptive and Radj were averaged using data obtained from all the four experiments and turned out to be 0.11 and 0.27, indicating a significant improvement in motion artifact removal through adaptive speckle decorrelation analysis.
Fig. 9.
(a) Photo of the phantom; (b) OCT image obtained by manual scanning; image reconstructed using XCCadaptive; (c) OCT image obtained by manual scanning; image reconstructed using XCCadj; (d) detecting edge of the ruling pattern in the image obtained using XCCadaptive through zero-crossing detection; (e) detecting edge of the ruling pattern in the image obtained using XCCadj through zero-crossing detection.
The advantage of adaptive speckle analysis is further illustrated in videos acquired in real-time using our GPU software. Visualization 1 (234.5KB, MP4) and Visualization 2 (167.2KB, MP4) were obtained by imaging the phantom shown in Fig. 9(a) with a manually scanned single mode fiber probe, based on motion tracking with XCCadaptive and XCCadj. Screen captures of the software are shown in Fig. 10(a) and 10(b). During the acquisition of Visualization 1 (234.5KB, MP4) and Visualization 2 (167.2KB, MP4) , we first scanned the single mode fiber probe slowly and then with higher speed. Due to improved robustness through adaptive speckle decorrelation analysis, Visualization 1 (234.5KB, MP4) can reveal the periodical structure of the resolution target in the reconstructed 2D image. In comparison, Visualization 2 (167.2KB, MP4) obtained using speckle analysis between adjacent Ascans shows distorted 2D image due to limited dynamic range in motion tracking.
Fig. 10.
(a) Screen capture for OCT image reconstructed using XCCadaptive, Visualization 1 (234.5KB, MP4) ; (b) screen capture for OCT image reconstructed using XCCadj, Visualization 2 (167.2KB, MP4) .
We performed manual scanning using a single mode fiber probe on the skin of a healthy volunteer and obtained distortion-free images through adaptive speckle decorrelation analysis. Images were obtained from the skin of forearm (Fig. 11(a) and Visualization 3 (320.8KB, MP4) ), fingertip (Fig. 11(b)), volar of hand (Fig. 11(c)) and dorsum of hand (Fig. 11(d)). Scale bars in Fig. 11 indicate 250μm. Skin layers (stratum corneum, epidermis, dermis, subcutaneous adipose tissue) are clearly visible. Figure 11(b) and 11(c) also show sweat ducts as indicated by green arrows. In Fig. 11(d), blood vessels that cause image shadow can be observed, as indicated by white arrows.
Fig. 11.
in vivo distortion-free image of skin obtained through robust motion tracking, from a healthy volunteer. (a) forearm, Visualization 3 (320.8KB, MP4) ; (b) skin of fingertip; (c) volar of hand; (d) dorsum of hand. Scale bars indicate 250 μm.
5. Conclusion and discussion
In this study, we developed an adaptive speckle decorrelation analysis strategy. We calculated XCC using Ascans with different time intervals and selected the XCC value that maximizes motion tracking sensitivity for displacement calculation. This method was validated using experimental data. We implemented the algorithm for robust motion tracking in GPU software to reconstruct distortion-free image for a manually scanned OCT system. Images were obtained from phantom and human skin.
The motion tracking method described in this manuscript enables scanner-free OCT imaging based on a manually actuated miniature single mode fiber probe. Such an imaging configuration offers great flexibility to access pathological region of interest in clinical diagnosis and surgical guidance. It can achieve a large lateral field-of-view (FOV) that is independent of lateral resolution. This is a desirable when imaging region of interest has a large dimension, such as in OCT’s application for tumor margin delineation. Conventionally, Bscan OCT image is obtained by steering collimated light beam with galvanometer in front of an imaging lens. In such a sample arm configuration, the lateral FOV limited by the dimension of imaging optics. To achieve a large lateral FOV at a given lateral resolution, the dimension of the imaging lens has to be large. To demonstrate this, we performed Bscan imaging on the phantom used in section 4.2 using conventional sample arm configuration with a 10X scanning lens (Thorlabs, LSM02, 13 μm 1/e2 beam waist size). The resultant image is shown in Fig. 12 with a 3.4mm lateral FOV. The scale bar in Fig. 12 represents 500 μm. The surface of the phantom appears curved, because light beam had large aberration when passing through the edge of the scanning lens. In comparison, Fig. 9(b) and 9(c) are free of such image artifact due to beam aberration and have a significantly larger FOV compared to Fig. 12.
Fig. 12.
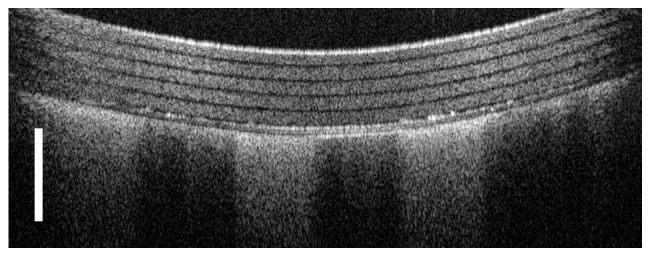
Bscan image obtained from the phantom shown in Fig. 9(a), using a sample arm configuration based on galvanometer and scanning lens. Scale bars indicate 500μm.
Speckle tracking developed here provides quantification for the magnitude of motion. Although motion in 3D space is essentially a three dimensional vector, our speckle decorrelation analysis can provide satisfactory performance in tracking motion with limited degree of freedom. When OCT signal is decorrelated by motion with non-zero components in dimensions other than x direction, it is challenging to fully correct motion artifact through speckle tracking. However, 2D image consisting of re-sampled Ascans will appear undistorted. This allows morphological feature of the sample to be identified through visual inspection. Otherwise, multiplicative speckle noise randomly modulates the magnitude of OCT signal and morphological features are not discernable in simple Ascan display or 2D image obtained by directly stacking sequentially acquired Ascans.
For the application of speckle tracking, it is critical to achieve a large dynamic range in motion speed measurement. Particularly, the adaptive speckle tracking in this paper allows more accurate tracking of small motion speed, compared to the method we developed before based XCC between adjacent Ascans. If Ascans acquired subsequently with time interval Δt are used in decorrelation analysis, the smallest speed that can be reliably measured is inversely proportional to Δt: vmin = Dmin/Δt. Here, Dmin indicates the smallest displacement that can be reliably measured. As a result, it is challenging to track slow motion using an OCT system with high imaging speed (small Δt). In comparison, the adaptive speckle tracking methods calculates XCC using Ascans with larger time interval (kΔt where k is larger than 1) and can be sensitive to slow motion. On the other hand, the maximum motion speed that can be estimated accurately by the adaptive speckle tracking method is still determined by OCT system’s data acquisition rate. If the scanning speed is so large that the displacement within Δt is significantly larger than the beam waist size ω0, subsequently acquired Ascans are completely decorrelated and calculating XCC using adjacent Ascans or Ascans with larger time interval cannot provide effective quantification of motion. However, current high-speed OCT system allows us to track a large scanning speed and does not pose a significant limitation in practice. Assume an OCT system has a 92 kHz Ascan rate (R) and the lateral interval between adjacent Ascans is δxmax = 10 μm. The highest trackable speed is thus 0.46 m/s (v = δxmaxR), and is a very large scanning speed for the application of manual scanning OCT imaging.
Intuitively, there exists an optimal value of XCC between 0 and 1 for speckle decorrelation analysis. If Ascans involved in XCC calculation are completely decorrelated, the resultant XCC is small but does not carry any information about displacement. If Ascans involved in XCC calculation are almost identical, the resultant XCC value is dominated by additive noise in OCT signal rather than spatial displacement. In this study, we chose to select XCC value that maximized S defined in Eq. (4) to achieve robust motion tracking. We successfully demonstrated adaptive motion tracking using XCC that maximized. On the other hand, XCC measurement that suffers from uncertainty that can be quantified by σxcc (standard deviation) [30]. An alternative strategy is to perform speckle tracking using XCC values that optimize the ratio between S and σxcc: (η = S/σxcc). However, σxcc is generally unknown for an arbitrary sample, therefore optimizing η is an untraceable problem.
Acknowledgment
The research reported in this paper was supported by internal funding from New Jersey Institute of Technology.
References and links
- 1.Lee J. S., “Speckle analysis and smoothing of synthetic aperture radar images,” Comput. Graph. Image Process. 17(1), 24–32 (1981). 10.1016/S0146-664X(81)80005-6 [DOI] [Google Scholar]
- 2.Wagner R. F., Smith S. W., Sandrik J. M., Lopez H., “Statistics of speckle in ultrasound B-scans,” IEEE Trans. Sonics Ultrason. 30(3), 156–163 (1983). 10.1109/T-SU.1983.31404 [DOI] [Google Scholar]
- 3.Schmitt J. M., Xiang S. H., Yung K. M., “Speckle in optical coherence tomography,” J. Biomed. Opt. 4(1), 95–105 (1999). 10.1117/1.429925 [DOI] [PubMed] [Google Scholar]
- 4.Adler D. C., Ko T. H., Fujimoto J. G., “Speckle reduction in optical coherence tomography images by use of a spatially adaptive wavelet filter,” Opt. Lett. 29(24), 2878–2880 (2004). 10.1364/OL.29.002878 [DOI] [PubMed] [Google Scholar]
- 5.Marks D. L., Ralston T. S., Boppart S. A., “Speckle reduction by I-divergence regularization in optical coherence tomography,” J. Opt. Soc. Am. A 22(11), 2366–2371 (2005). 10.1364/JOSAA.22.002366 [DOI] [PubMed] [Google Scholar]
- 6.Pircher M., Götzinger E., Leitgeb R., Fercher A. F., Hitzenberger C. K., “Speckle reduction in optical coherence tomography by frequency compounding,” J. Biomed. Opt. 8(3), 565–569 (2003). 10.1117/1.1578087 [DOI] [PubMed] [Google Scholar]
- 7.Kennedy B. F., Hillman T. R., Curatolo A., Sampson D. D., “Speckle reduction in optical coherence tomography by strain compounding,” Opt. Lett. 35(14), 2445–2447 (2010). 10.1364/OL.35.002445 [DOI] [PubMed] [Google Scholar]
- 8.Desjardins A. E., Vakoc B. J., Oh W. Y., Motaghiannezam S. M., Tearney G. J., Bouma B. E., “Angle-resolved optical coherence tomography with sequential angular selectivity for speckle reduction,” Opt. Express 15(10), 6200–6209 (2007). 10.1364/OE.15.006200 [DOI] [PMC free article] [PubMed] [Google Scholar]
- 9.Ozcan A., Bilenca A., Desjardins A. E., Bouma B. E., Tearney G. J., “Speckle reduction in optical coherence tomography images using digital filtering,” J. Opt. Soc. Am. A 24(7), 1901–1910 (2007). 10.1364/JOSAA.24.001901 [DOI] [PMC free article] [PubMed] [Google Scholar]
- 10.Jian Z., Yu L., Rao B., Tromberg B. J., Chen Z., “Three-dimensional speckle suppression in Optical Coherence Tomography based on the curvelet transform,” Opt. Express 18(2), 1024–1032 (2010). 10.1364/OE.18.001024 [DOI] [PMC free article] [PubMed] [Google Scholar]
- 11.Gossage K. W., Tkaczyk T. S., Rodriguez J. J., Barton J. K., “Texture analysis of optical coherence tomography images: feasibility for tissue classification,” J. Biomed. Opt. 8(3), 570–575 (2003). 10.1117/1.1577575 [DOI] [PubMed] [Google Scholar]
- 12.Gossage K. W., Smith C. M., Kanter E. M., Hariri L. P., Stone A. L., Rodriguez J. J., Williams S. K., Barton J. K., “Texture analysis of speckle in optical coherence tomography images of tissue phantoms,” Phys. Med. Biol. 51(6), 1563–1575 (2006). 10.1088/0031-9155/51/6/014 [DOI] [PubMed] [Google Scholar]
- 13.Kasaragod D. K., Lu Z., Smith L. E., Matcher S. J., “Speckle texture analysis of optical coherence tomography images,” Proc. SPIE 7387, 73871V (2010). 10.1117/12.870767 [DOI] [Google Scholar]
- 14.Kurokawa K., Makita S., Hong Y. J., Yasuno Y., “Two-dimensional micro-displacement measurement for laser coagulation using optical coherence tomography,” Biomed. Opt. Express 6(1), 170–190 (2015). 10.1364/BOE.6.000170 [DOI] [PMC free article] [PubMed] [Google Scholar]
- 15.Kurokawa K., Makita S., Hong Y. J., Yasuno Y., “In-plane and out-of-plane tissue micro-displacement measurement by correlation coefficients of optical coherence tomography,” Opt. Lett. 40(9), 2153–2156 (2015). 10.1364/OL.40.002153 [DOI] [PubMed] [Google Scholar]
- 16.Mariampillai A., Standish B. A., Moriyama E. H., Khurana M., Munce N. R., Leung M. K. K., Jiang J., Cable A., Wilson B. C., Vitkin I. A., Yang V. X. D., “Speckle variance detection of microvasculature using swept-source optical coherence tomography,” Opt. Lett. 33(13), 1530–1532 (2008). 10.1364/OL.33.001530 [DOI] [PubMed] [Google Scholar]
- 17.Mariampillai A., Leung M. K. K., Jarvi M., Standish B. A., Lee K., Wilson B. C., Vitkin A., Yang V. X. D., “Optimized speckle variance OCT imaging of microvasculature,” Opt. Lett. 35(8), 1257–1259 (2010). 10.1364/OL.35.001257 [DOI] [PubMed] [Google Scholar]
- 18.Wang Y., Wang R., “Autocorrelation optical coherence tomography for mapping transverse particle-flow velocity,” Opt. Lett. 35(21), 3538–3540 (2010). 10.1364/OL.35.003538 [DOI] [PMC free article] [PubMed] [Google Scholar]
- 19.Liu X., Zhang K., Huang Y., Kang J. U., “Spectroscopic-speckle variance OCT for microvasculature detection and analysis,” Biomed. Opt. Express 2(11), 2995–3009 (2011). 10.1364/BOE.2.002995 [DOI] [PMC free article] [PubMed] [Google Scholar]
- 20.Cadotte D. W., Mariampillai A., Cadotte A., Lee K. K. C., Kiehl T. R., Wilson B. C., Fehlings M. G., Yang V. X. D., “Speckle variance optical coherence tomography of the rodent spinal cord: in vivo feasibility,” Biomed. Opt. Express 3(5), 911–919 (2012). 10.1364/BOE.3.000911 [DOI] [PMC free article] [PubMed] [Google Scholar]
- 21.Motaghiannezam R., Fraser S., “Logarithmic intensity and speckle-based motion contrast methods for human retinal vasculature visualization using swept source optical coherence tomography,” Biomed. Opt. Express 3(3), 503–521 (2012). 10.1364/BOE.3.000503 [DOI] [PMC free article] [PubMed] [Google Scholar]
- 22.Liu X., Huang Y., Ramella-Roman J. C., Mathews S. A., Kang J. U., “Quantitative transverse flow measurement using optical coherence tomography speckle decorrelation analysis,” Opt. Lett. 38(5), 805–807 (2013). 10.1364/OL.38.000805 [DOI] [PMC free article] [PubMed] [Google Scholar]
- 23.Liu X., Kirby M., Zhao F., “Motion analysis and removal in intensity variation based OCT angiography,” Biomed. Opt. Express 5(11), 3833–3847 (2014). 10.1364/BOE.5.003833 [DOI] [PMC free article] [PubMed] [Google Scholar]
- 24.Ahmad A., Adie S. G., Chaney E. J., Sharma U., Boppart S. A., “Cross-correlation-based image acquisition technique for manually-scanned optical coherence tomography,” Opt. Express 17(10), 8125–8136 (2009). 10.1364/OE.17.008125 [DOI] [PMC free article] [PubMed] [Google Scholar]
- 25.Liu X., Huang Y., Kang J. U., “Distortion-free freehandscanning OCT implemented with real-time scanning speed variance correction,” Opt. Express 20(15), 16567–16583 (2012). 10.1364/OE.20.016567 [DOI] [Google Scholar]
- 26.Webster J. G., Medical Instrumentation Application and Design (Wiley; 2010). [Google Scholar]
- 27.Leitgeb R., Hitzenberger C., Fercher A., “Performance of fourier domain vs. time domain optical coherence tomography,” Opt. Express 11(8), 889–894 (2003). 10.1364/OE.11.000889 [DOI] [PubMed] [Google Scholar]
- 28.Goodman J. W., Statistical Optics (Wiley, 1985). [Google Scholar]
- 29.Goodman J. W., “Some fundamental properties of speckle,” J. Opt. Soc. Am. 66(11), 1145–1150 (1976). 10.1364/JOSA.66.001145 [DOI] [Google Scholar]
- 30.Uribe-Patarroyo N., Villiger M., Bouma B. E., “Quantitative technique for robust and noise-tolerant speed measurements based on speckle decorrelation in optical coherence tomography,” Opt. Express 22(20), 24411–24429 (2014). 10.1364/OE.22.024411 [DOI] [PMC free article] [PubMed] [Google Scholar]


