Abstract
Phase Contrast Microscopy (PCM) is an important tool for the long term study of living cells. Unlike fluorescence methods which suffer from photobleaching of fluorophore or dye molecules, PCM image contrast is generated by the natural variations in optical index of refraction. Unfortunately, the same physical principles which allow for these studies give rise to complex artifacts in the raw PCM imagery. Of particular interest in this paper are neuron images where these image imperfections manifest in very different ways for the two structures of specific interest: cell bodies (somas) and dendrites. To address these challenges, we introduce a novel parametric image model using the level set framework and an associated variational approach which simultaneously restores and segments this class of images. Using this technique as the basis for an automated image analysis pipeline, results for both the synthetic and real images validate and demonstrate the advantages of our approach.
OCIS codes: (100.0100) Image processing, (100.2960) Image analysis, (100.1830) Deconvolution, (100.3020) Image reconstruction-restoration, (100.3190) Inverse problems
1. Introduction
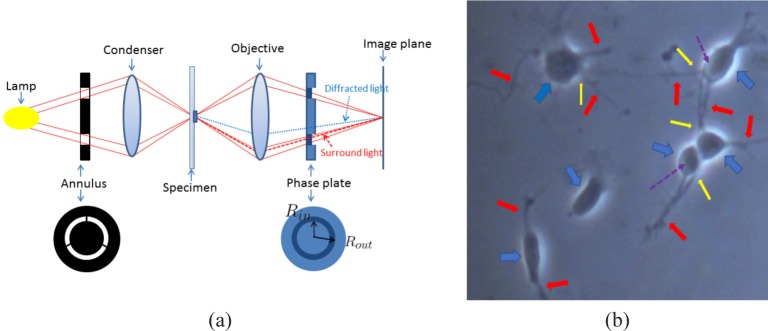
Phase Contrast Microscopy (PCM) is an important technique for the study of living cells. As illustrated in Fig. 1(a), PCM adds an annulus and a phase plate to a conventional light microscope to create a phase shift between light propagating along the “diffracted” and “surround” paths which is converted into intensity variations on the imaging plane [1]. There are two major advantages of PCM due to the fact that specimens are not to be stained as required by fluorescence microscopy. First, researchers can perform long-term observations of unstained living cells without worrying about photobleaching. Second, disruption of the observed cells and thus measurement artifacts caused by introduction of fluorescence can be avoided.
Fig. 1.
(a) The optical path of phase contrast microscopy; (b) A cropped region of a PCM neuron image. The blue arrows point to somas; the red arrows point to dendrites; the yellow arrows point to places where dendrites and somas are separated by halos; the purple dash arrows point to shade-offs.
However, as seen in the work of [2, 3] and as illustrated in Fig. 1(b), PCM images can suffer from imaging artifacts such as the halo and shade-off due to the imaging physics. Therefore it is challenging to build models for cell intensity distribution and design algorithms to analyze the images. Recently, various algorithms have been developed to help to automatically analyze PCM images for osteosarcoma cells [4], bovine aortic endothelial cells [5], bone marrow stromal cells [6] and fish keratocytes [7]. The above algorithms mainly employ the gradient information among halo, cell and background for segmentation.
Besides the PCM imaging artifacts, the development of analysis algorithms for neurons is even more challenging due to the requirement of identifying both cell bodies (somas) as well as dendrites, two classes of structures with very different geometries and contrasts within the data. Indeed, as illustrated in [8–12], dendrite tracing itself is already a quite challenging problem since these structures can be dim and broken in some cases. Moreover, dendrites and soma of the same neuron are sometimes separated by the halo artifacts in PCM images (see Fig. 1(b)). These gaps need to be filled for the purpose of biological connectivity analysis. Biological connectivity consists of chemical (synapses), electrical (gap junctions), physiological (voltage-sensitive ion channels, synaptic receptors) and anatomical (synaptic clefts) components. In order to study biological connectivity, structural connectivity (identifying somas and connecting corresponding dendrites) needs to first be determined [13,14]. However, computationally bridging this gap is not at all trivial. Currently, the majority of image related research of neurons has been performed on fluorescence microscopy data [15] with very limited work focusing on the development of automatic algorithm for neuron segmentation (including both somas and dendrites) and connectivity analysis for PCM images [16, 17]. The work in [16] mainly considered on dendrite tracing and quantification of the dendrite change while [17] only examined soma segmentation. To the best of our knowledge, the work in this paper is the first to present a method that segments both somas and dendrites simultaneously for PCM neuron images.
Recently, the authors of [2, 3] modeled the imaging process of PCM as a convolution operation. Based on the convolution model, [2] built an optimization function including smoothness and sparseness regularization to restore artifact-free images. Then simple segmentation methods such as thresholding [18] can be used to these restored images.
In this paper, rather than employing a pixel-based parametrization of the problem as in [2], we present a parametric image model consisting of two level set functions to represent the neuron images. Then we formulate an optimization problem merging image restoration and segmentation. Our novel approach has multiple advantages over the methods in [2, 3]. First of all, even after restoration, image segmentation must still be performed on the restored images for the purpose of image analysis in [2, 3]. Our method performs the restoration and segmentation simultaneously, so no other major segmentation operation is needed. Secondly, due to the parametric representation, both dendrites and somas can be segmented simultaneously.
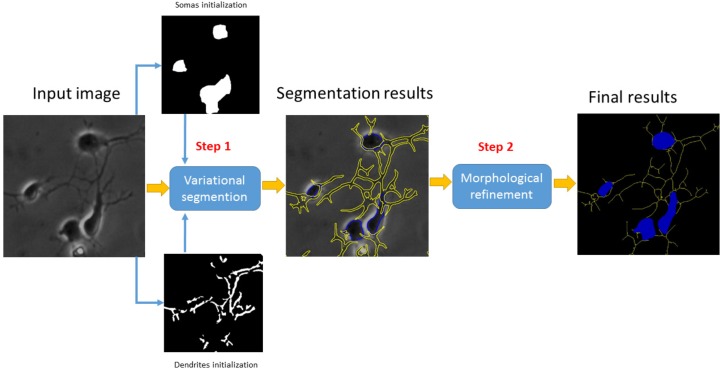
Based on the above segmentation approach, we present the pipeline illustrated in Fig. 2 which performs image analysis for the PCM neuron images. This pipeline is automatic and, aside from the specification of a few parameters, requires no human interaction thereby making it suitable for large scale automated image analysis. As in [2, 3], background bias correction is performed before the essential part of the pipeline as well as the major contributions of this paper which is “variational segmentation.” In this essential part, we build an energy functional of level set functions based on the PCM physical model and image information. Then we solve an optimization problem to obtain a segmenation/restoration of the PCM images. Based on the segmentation of somas and dendrites, some simple morphological operations are performed to refine the results. The feasibility and advantages of our variational segmentation method are demonstrated by synthetic images in Section 5.1. In addition, the whole pipeline has been validated in real PCM neuron images for the neural development study [19]. The remainder of this paper is organized as follows. In Section 2, some background of the level set method is introduced. We propose and illustrate our variational segmentation method in details in Section 3. Then we introduce a set of morphological operations which aim to refine the variational segmentation results in Section 4. We present experimental results and discussions in Section 5. Finally, we draw our conclusion and discuss our future work in Section 6.
Fig. 2.
Illustration of the pipeline for PCM neuron image analysis
2. The level set method for image segmentation
The level set method is a very powerful and convenient approach to represent boundaries or surfaces for objects [20, 21]. The essential idea of level set methods for segmentation is to represent a curve as the intersection of a horizontal plane z(x) = 0 of an auxiliary level set function ϕ (x); i.e., .
Image segmentation aims to identify objects of interest and/or their boundaries. From the variational perspective, segmentation is often posed as an optimization problem by constructing a scalar energy functional based on , a curve representing the boundary of the object. The energy functional , consisting of a data fidelity term and a regularization term, is always constructed in a way that when approaches to the true boundary of the object, the minimum value of is achieved.
For example, the well-known Chan-Vese model [22] implicitly assumes that object and background are Gaussian distributed with the same variance, and subsequently seeks a segmentation which minimizes partially a mean square error-type of energy functional. In particular, the Chan-Vese model is defined
| (1) |
where I(x) is the image intensity value at location x, Ω1 is the region inside of the curve , is the region outside of the curve and which is the whole image domain. In addition, c1 and c2 are the mean image intensity values for the regions Ω1 and respectively. Moreover, α is a coefficient, is the length of the curve and the term basically is a smoothness regularization term.
By introducing the level set function ϕ such that , eqn. (1) can be converted into a function based on ϕ as
| (2) |
where Hε (·) is an approximate Heaviside function [22], defined as
| (3) |
and the Heaviside function is defined as
By using calculus of variations [23], the optimization of Ecv can be realized by iteratively updating c1, c2 and ϕ using the following Euler-Lagrange equation
| (4) |
where
Here we use δε (·) to represent the derivative of Hε (·) through the paper. Thus the level set method can be treated as an optimization technique which “evolve” the level set function ϕ as a function of time such that, as t → ∞, approaches the contour of interest in the image.
3. A variational formulation for PCM neuron image segmentation
In principle, phase contrast microscopy converts the phase difference of the surround wave and the diffracted wave which passes through specimen into intensity difference that can be directly measured [1] (see Fig. 1). Yin et al. [2,3] modeled the imaging process of phase contrast microscopy as a convolution operation
| (5) |
where * represents convolution; I(x) is the observed image; θ (x) is the phase retardation at the location x; δ (x) is the Dirac delta function; G(x) is a bias field caused by uneven illumination and can be estimated using flat-field correction method [24]. The function airy(x) is an obscured airy pattern defined as follow [2, 25, 26]
| (6) |
where J1(·) is the first order Bessel function of the first kind, Nm is the radius of the airy pattern kernel, rm = 0.85 in our case which is the ratio of the inner radius (Rin) to the outer radius of the phase ring (Rout) in Fig. 1, km is a scale parameter related with the properties of microscopy and the wavelength of the imaging light [25, 26]. In addition, the airy pattern is normalized such that 1 * airy(x) = 1 as in [2, 3].
In this section, we present a parametric model to represent θ (x) based on the level set framework. As previously discussed, for our application, a neuron usually consists of a soma and multiple dendrites which need to be segmented [15, 27]. Somas and dendrites differ in two critical ways. First, the shape of a soma is like a blob while the dendrites are typical tubular structures. Second, somas are darker than dendrites in PCM images and halos are more obvious than those of dendrites. This is because somas are usually thicker than dendrites. Thus, in the soma regions, the phase retardation is larger and the PCM image is darker accordingly as shown in Fig. 1(b) and illustrated in Section 5.1. In Section 5.1, a single level set function is demonstrated to have difficulty capturing both somas and dendrites simultaneously. Thus we use two level set functions ϕ1 and ϕ2 for somas and dendrites respectively. Specifically, the image to be recovered can be represented as the following Double Level Sets model (DLS)
| (7) |
where ϕ1 and ϕ2 are the level set functions, s1 and s2 are real scalars representing in some sense the average phase retardation values for somas and dendrites respectively, and Hε (·) is the approximate Heaviside function defined in (3).
Based on the parametric model in (7), we propose the following energy function
| (8) |
The energy term Ephy is a data fidelity term based on the physical model as specified in Section 3.1. In addition, Eloc is a local data fidelity term based on localized active contour models [28] as introduced in Section 3.2. Moreover, Ewtub is a spatial weighted version of the geometric regularization term for tubular structure [29] as introduced in Section 3.3. Lastly, λi,i = 1 ⋯,3 are real scalars to balance these energy terms.
Here we want to point that, in the case of multiple level set functions, constraints are usually imposed to guarantee each level set function does not overlap with each other [30] etc. In our case for the segmentation of somas and dendrites, the overlap regularization does not apply. A neuron can be divided into a soma and dendrites but no clear boundaries between the soma and dendrites exist. Thus imposing overlap penalty always makes the soma and dendrites in the segmentation separated from each other which complicates the connectivity analysis. Therefore, we do not use regularization to guarantee the non-overlap for somas and dendrites for now. We will develop a regularization method that ensures smooth connection between these two structures in the future.
3.1. A data fidelity term based on the physical model
By compensating for G(x) and the multiplicative factor during preprocessing, and using the sifting property of the Dirac δ function, the imaging model (5) can be written as
| (9) |
In order to formulate an optimization problem, the physical model in (5) or (9) are always represented using a matrix form. Following [31], here we define an operator vec: ℂn×m → ℂnm×1 such that for a given array w ∈ ℂn×m,
The operator array defines the inverse of the vec operator such that
where w ∈ ℂn×m and w ∈ ℂnm×1.
Then we can define ϕ1, ϕ2 and θ are the vectorized version of ϕ1, ϕ2 and θ respectively. Thus the vectorized version of the DLS model (7) is represented by
| (10) |
where ϕ1 = vec(ϕ1), ϕ2 = vec(ϕ2) and θ = vec(θ). In addition, (9) can be discretized and represented by the following matrix form
| (11) |
where I is vectorized from I(x) such that I = vec(I). Moreover, H = (K − In) where In is an identity matrix, K is a matrix with special structure built from the convolution kernel airy(x) [31]. In this paper, we assume θ (x) is periodic so that K is a block-circulant-circulant-block(BCCB) matrix. As we will discuss in Section 3.5, the BCCB assumption enables efficient implementation of the matrix and vector multiplication in (11) through the Fast Fourier Transformation (FFT) [31, 32].
From the physical model (11), a data fitting term Ephy is defined as
3.2. Localized active contours
In order to deal with the inhomogeneity of images, level set methods driven by local image features were proposed [28, 33]. The general idea of the localized level set method is illustrated by Fig. 3. For each point in the evolving curve such as x, the driven force derived from image at x is only based on its neighborhood Br(x) rather than the whole image domain such as the Chan-Vese model [22]. Therefore, localized active contours are robust to image heterogeneities and also can capture information in small details such as vessels and dendrites [28, 33].
Fig. 3.
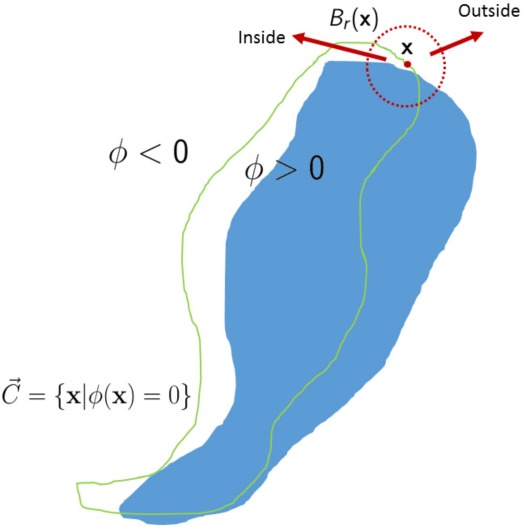
An Illustration for the localized level set method. The point x is in the evolving curve and Br(x) is a neighborhood of x. Note: the neighborhood Br(x) is divided into two parts by .
Specifically, the local image fitting energy function formulation of [28] is defined as follows
| (12) |
where Floc denotes a metric to evaluate local adherence to a given model. Mathematically, the neighborhood of x with radius equals r is defined by
| (13) |
where ∥·∥2 indicates the l2 norm. In this paper, we use a localized version of the mean separation energy [34] for Floc
| (14) |
where ux and vx are the mean values of the inside and outside parts of Br(x) respectively and they can be represented by
3.3. A weighted geometric regularization of tubular structure
The most well known geometric regularization is the smoothness constraint in [22, 35] as also defined as the third term in (1) which shrinks the curve in the normal direction. For the PCM neuron image analysis in this paper, we take advantages of a geometric regularization term Etub for tubular structure proposed by [29]. This tubular regularization is defined on the base of local geometric properties of the level set function. It is similar as the localized level set method introduced in Section 3.2, but the major difference is that only the level set function information rather than image information is used to construct the regularization energy term.
An intuitive illustration of the effect of Etub can be found in Fig. 4. Rather than shrink the curve into a point as smoothness regularization [22, 35] does, the tubular regularization would extend curve into the major principal direction while keep the other direction unchanged.
Fig. 4.
Curve evolution under the geometric tubular structure regularization. From left to right: iteration 0, 20, 40 and 60 respectively.
By incorporating this geometric regularization term, most of the gaps between broken dendrites, dendrites and their corresponding somas in the PCM images could be filled for neural connectivity analysis. However, as illustrated later in this section, the energy term Etub in [29] might impose the regularization in unnecessary regions and thus cause false dendrites. In order to to reduce the false dendrite artifacts, we introduce Ewtub, a spatial weighted version of Etub as follows.
| (15) |
where
Tr(·) represents the trace of a matrix, f is a non-negative decreasing function from ℝ+ to ℝ+. The only difference between Ewtub and Etub is a spatial varying weight term w(x). Here we define w(x) is static and independent of ϕ as
| (16) |
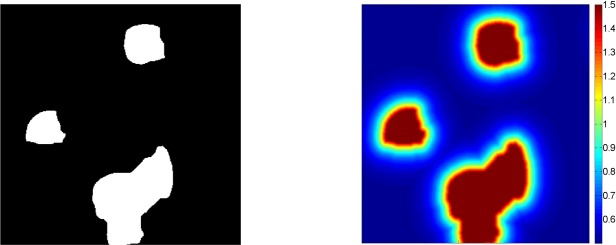
where a and b are two real positive numbers. BW(x) is a binary image. Here we use the soma initializations as BW(x) which is illustrated in Section 3.4. The function dist(·) calculates the Euclidean distance transform of a binary image. For a zero pixel in BW(x), dist(·) assigns a number that is the distance between that pixel and its nearest nonzero pixel of BW(x). For a nonzero pixel, dist(·) assigns zero to that pixel. Therefore w(x) imposes stronger constraints near the somas and thus reduces false dendrites in the area away from somas. An example of the weight map w(x) is Fig. 5 by setting a = 20 and b = 0.5.
Fig. 5.
Left: A binary image; Right: The corresponding weight map w(x) with a = 20 and b = 0.5.
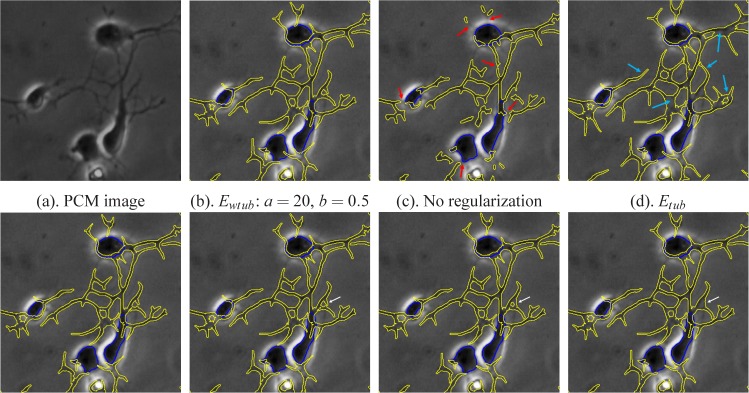
The motivation of introducing w(x) is that term Etub in [29] is independent of image information which does not work well in our case of neuron images. Strong tubular regularization could encourage connections of dendrites to corresponding somas separated by halos. However, if the same weight for the regularization applies over the whole image, false dendrites tend to be generated in areas away from somas as illustrated in Fig. 6. In order to reduce the false created dendrites, w(x) aims to put more tubular regularization near somas and less for regions far from somas. By incorporating the term Ewtub, most of the gaps between broken dendrites, dendrites and their corresponding somas in the PCM images can be filled for neural connectivity analysis.
Fig. 6.
Effects of the tubular regularization for segmentation.
The effect of the weighting term w(x) as well as the tubular geometric regularization can be found in Fig. 6. In addition, the parameters a and b are set as a = 20 and b = 0.5 for the real PCM images in Section 5.2. In order to show that the Ewtub is not that sensitive to a and b, we consider four combinations of (a,b) values that are both above and below the (20,0.5) values and include the corresponding segmentation results in Fig. 6. From Fig. 6, we find that, without the term Ewtub, some dendrites fail to connect to their corresponding somas as pointed by red arrows in Fig. 6(c). Using a constant weighting term, dendrites are connected to somas with the result that some false dendrites are produced as denoted by light blue arrows in Fig. 6(d). By comparing with Fig. 6(b) to (e–h), we see that varying the a and b values has little impact on the final segmentation. Indeed, there is only a single readily identified difference as denoted by the white arrow in Fig. 6(f)–(h).
3.4. Curve initialization
Curve initialization is very important for level set methods. Good initializations can yield more accurate segmentation results and also make algorithms converge rapidly. Instead of using manual initialization, we propose an automatic initialization method as described in Fig. 7.
Fig. 7.
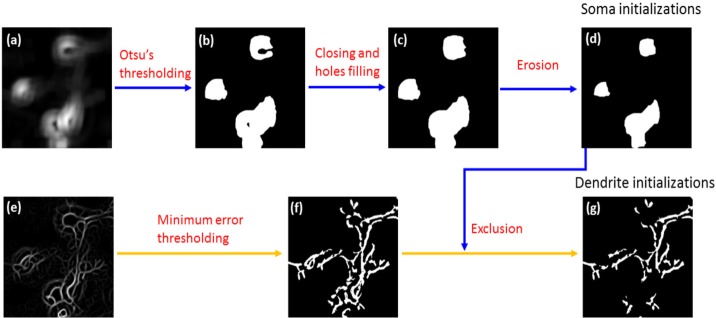
Illustration of the initializations for somas and dendrites. The input image to be processed is in Fig. 2 for curve initializations. (a): local standard deviation (b) Otsu’s thresholding results on (a); (c): closing and hole filling on (b); (d): erosion of (c); (e): steerable filtering enhancement for dendrite initializations; (f) The minimum error thresholding results on (e); (g) The final dendrites initialization.
To begin with, two feature maps (Fig. 7(a) and Fig. 7(e)) for somas and dendrites are obtained from the original input image (Fig. 2). For somas, the feature map is the local standard deviation of the image [36]. For dendrites, a steerable filter using the second order Gaussian derivative template [37] is applied to enhance tubular structures. The radius of the local standard deviation in is set to 30 pixels while the standard deviation of the Gaussian template is three pixels in this paper. These two parameters are set based on prior information concerning the approximate sizes of the somas and dendrites respectively. Then by using Otsu’s method [18] and the minimum error thresholding [38], preliminary initializations for somas and dendrites (Fig. 7(b) and (f)) are obtained respectively. The morphological closing and hole filling operations are then performed to make the initialization cover most of the somas as in Fig. 7(c). The structuring element of the closing is a disk with radius equals seven pixels. Next, a morphological erosion using a disk with radius equals ten pixels as the structuring element is used to get the final soma initializations Fig. 7(d). There are two benefits for the erosion operation. Firstly, the initialized soma size is reduced which makes the algorithm converge fast. Secondly, it can keep more dendrites initializations since Fig. 7(g) is obtained by excluding the final soma initializations from the preliminary dendrite initialization.
3.5. Implementation
By combining the gradient flows of terms Ephy, Eloc and Ewtub, the optimization of the energy functional (8) can be achieved using the gradient descent flow method by following Algorithm 1 iteratively.
As summarized by Algorithm 1, there are 4 steps during each iteration. The gradient flows of Ephy, Eloc and Ewtub are defined in (17), (20) and (21) respectively below.
Using the calculus of variation, the gradient flow of Ephy(ϕ1,ϕ2,s1,s2) with respective to ϕk and sk(k = 1,2) can be obtained as
Algorithm 1.
Optimization for energy functional (8) for each iteration
and sk(k = 1,2) can be obtained as
| (17) |
| (18) |
Using the array(·) operator defined in Section 3.1, the array version of (17) is
| (19) |
According to [28], the gradient descent flow of Eloc defined in (12) is
| (20) |
where
For the weighted tubular regularization term Ewtub, according to [29], the gradient flow of (15) is
| (21) |
where
and denotes the derivative of f.
The difficult part of implementing (17) to (21) is the matrix and vector multiplication Hθ. More specifically, as the size of matrix H grows rapidly as the size of image increases making direct, space domain implementation of the model computationally cumbersome. If we assume θ(x), the image to be restored, is n × n, then the size (also the memory cost) of H is n2 × n2. The time cost of the matrix and vector multiplication operation is O((n2)2) = O(n4).
By assuming a BCCB structure, the matrix and and vector multiplication Hθ can be implemented very efficiently through FFT as [31]
| (22) |
where ℱ(·) and ℱ−1(·) are discrete Fourier transform and its inverse form respectively, ○ is the component-wise multiplication. In addition, we have
Thus the implementation of the Dirac δ function can be done in the spatial frequency domain. In addition, from (22), we can see that the matrix and vector multiplication is mainly performed by using several FFT and IFFT operations. Thus the time cost equals O(n2 log(n)). Moreover, there is no need to build the huge matrix H and thus the memory cost for the frequency domain implementation is O(n2). Alternative choices for modeling K and the resulting computational methods can be found in [31, 39, 40].
For the two real scalars s1 and s2, based on (18), s1 is updated by numerically solving the following minimization problem (assuming ϕ1, ϕ2, s2 fixed)
| (23) |
Here we set ub = 0.2 which is a upper bound of s1. Next, update s2 by numerically solving the following minimization problem (assuming ϕ1, ϕ2, s1 fixed)
| (24) |
By using the constraint 0 < s2 ≤ s1, the level set function s1 would catch the brighter objects as shown in Section 5.1. We update s1 and s2 once for every ten updates to the level set functions. This change reduces computation load and makes little difference to the final results.
4. Morphological refinement
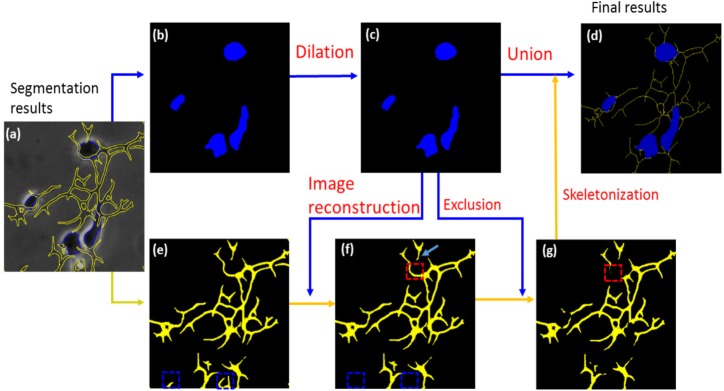
An example of the results of our approach to identify somas and dendrites is provided in Fig. 8(b) and (e) respectively. As is typical for problems of this type [27, 41], a degree of post processing can be helpful to refine the accuracy of the basic segmentation methods. Toward this end, the final soma results are obtained by a morphological dilation as seen in Fig. 8(b). The structuring element of the dilation is a disk with radius equals two pixels. To get rid of tubular structures which are not connected to and far away from somas, morphological reconstruction is used. Morphological reconstruction is a useful method for selecting meaningful components from a binary image [42, 43]. Morphological reconstruction eliminates the mask components that do not overlap with the marker. We assume that dendrites always connect to somas. Thus in the neuron images, the mask is the segmented dendrites as in Fig. 8(e) and the marker is the segmented somas as in Fig. 8(c).
Fig. 8.
Illustration of morphological operations
The effect of morphological reconstruction in our case (Fig. 8) can be seen in by comparing the regions denoted by dash blue rectangles in (e) and (f). By excluding somas (c) from (f), the dendrites are obtained as shown in (g). Lastly the final results with both somas and dendrite traces are obtained by the combination of (c) and the skeletonization of (g). The dilation operation improves the final results in two aspects. Firstly, some dendrites which are just one or two pixels away from somas can be connected to somas. An example is denoted by light blue arrow in (f). Secondly, some false dendrites around soma boundaries can be removed. This effect is visualized by comparing the regions denoted by red dash rectangles in (f) and (g). To summarize, the series of the morphological operations as presented in Fig. 8 have several benefits: firstly, it reduces the false tubular structure; secondly, it guarantees that all dendrites are connected to but not overlap with somas by the exclusion operation.
5. Experiment and discussion
To evaluate the validity of our new method, we conducted two experiments. The first one is based on synthetic images and is intended to demonstrate the feasibility and advantage of our new approach. The second experiment is based on real PCM neuron images of E18 rat cerebral cortical tissue to study the effect of Ivermectin(IVM) to the development of neuron growth [19]. The experiment was approved by Tufts University Institutional Animal Care and Use Committee and complies with the NIH Guide for the Care and Use of Laboratory Animals (IACUC No.B2011 − 45).
There are three parameters, km, rm and Nm, in the airy function formulation (6). All PCM images are collected from rat cortical neuron cultures using a Zeiss Axiovert S100 with an 32× with NA = 0.40 (type LD A-Plan) objective at the resolution of 1728 × 1296. The parameter rm, the ratio of the inner radius to the outer radius of the phase ring, can be read or measured directly which is 0.85 in our case. The parameters km and Nm depend on the hardware specification of the specific microscope and wavelengths of image light [25, 26]. As indicated in [3], wrong parameters generate unsatisfactory restoration results. In addition, restoration results achieve the best using the correct parameters and they are stable around the correct parameters. Thus grid search is used to estimate km and Nm by evaluating restoration results on several images manually. In our case, the parameters km and Nm are estimated as 0.128 and 15 respectively. The set of parameter values is used for both the synthesized images and the real PCM image data in this section.
5.1. Synthetic image illustration
In this section, we use synthetic images to demonstrate the advantages of our method over Yin’s method in [2, 3] and to justify our use of two level set functions instead of one. Representing both somas and dendrites of the neuron image to be recovered by a Single Level Set (SLS) formulation
| (25) |
fails to allow for their simultaneous identification. The SLS model can be simplified from the DLS model (7) by assuming s2 = 0. Thus all calculations and implementations of the SLS model can be obtained from that of the DLS model by setting s2 = 0.
The synthetic image consists of a bright square and a less bright line as in Fig. 9. The size of square is 30 × 30 and the width of the line is 1 pixel. The square in the true phase retardation image of has the intensity 0.18, the tubular structure has the intensity 0.06 and the standard deviation of the Gaussian noise in the right image of Fig. 9 is 0.02. Here we defined PSNR as
where Iclean and Inoisy are the PCM images with and without noises as displayed in Fig. 9(b) and (c) respectively. In addition, MSE(Iclean, Inoisy) are the mean square error between the noise and clean PCM images.
Fig. 9.
Synthesized images. (a): a true phase retardation image; (b): the simulated PCM image without noise; (c): the simulated PCM image with Gaussian noise (PSNR = 15dB)
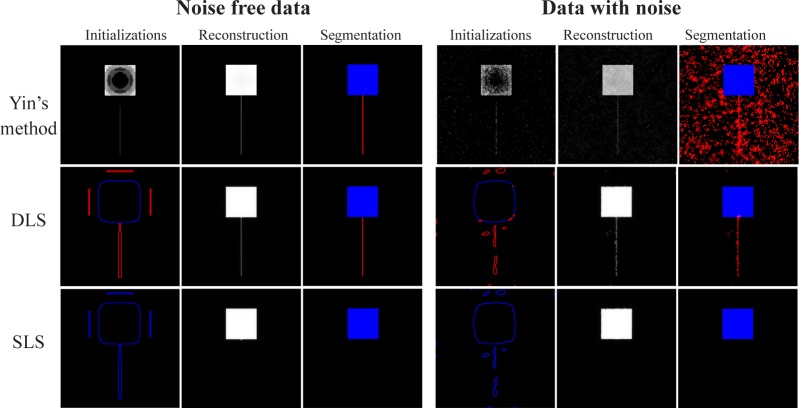
In Fig. 10, the initializations for Yin’s method are obtained directly from the data using the methods in [2, 3] while the initializations for level set formulations are curves obtained using our initialization method in Section 3.4. The radius of the local standard deviation for the square initialization is set to 20 while the standard deviation of the Gaussian template for the steering filter for tubular enhancement ranges from 0.5 to 3 as noise increases. The parameters for weight of the tubular term (16) are set as a = 5, b = 0.2. The parameters in Algorithm 1 are set as follows: r1 = 15, r2 = 1, λ1 = 1, λ2 = 1 and λ3 = 0.0015. In order to make a direct comparison, no morphological refinements is used for the synthetic images.
Fig. 10.
Results comparison among Yin’s model [2, 3] and the Single Level Set (SLS) and the Double Level Sets (DLS) model for Fig. 9(b) and (c) above. Columns 1-3: Initializations, reconstruction results and segmentation results. Rows 1-3: Yin’s model, SLS and DLS model (top to bottom) for noise free data. Rows 4-6: Yin’s model, SLS and DLS model (top to bottom) for data with noise.
For DLS model, the blue curves and the red curves are the initializations for the square and the line structure respectively. For SLS model, all initial curves are blue without distinguishing the square and the line structure and segmentation results only obtain the square. Yin’s method and DLS method both work well in the case without noise. The major advantage of DLS model over Yin’s method is well illustrated for the case with noise. In principle, Yin’s method does an acceptable job for reconstruction by significantly reducing the halo artifacts. In addition, we evaluate the mean square error (MSE) for the reconstructions with respect to different peak signal to noise ratios (PSNR) (20 simulations per PSNR) for Yin’s method, SLS method and DLS method as included in Fig. 11. From Fig. 11, we can see that SLS performs worst for most cases due to the missing of the line structure. In high PSNR cases, both DLS and Yin’s method perform quite well and DLS model outperforms Yin’s method slightly. As PSNR decreases, Yin’s method deteriorates quickly which can also be seen in Fig. 10.
Fig. 11.
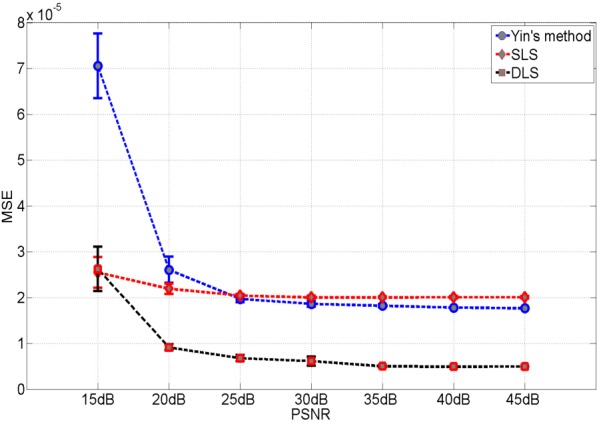
Mean square error of the reconstruction results
For the purpose of image analysis and understanding, the segmentation still needs to be performed on the recovered images for Yin’s method. Moreover, in noisy cases above, simple thresholding skills such as [18] are not capable of recovering the linear structures. While for DLS, no further segmentation is required since the regions {x|ϕ1(x) > 0} and {x|ϕ2(x) > 0} already correspond to results for the square and the line respectively.
5.2. Application to real PCM images
In this section, we apply our method on real PCM images of neurons. The parameters for curve initialization for all real PCM images are set as stated in Section 3.4. Through parameters in Algorithm 1, we set the local radii r1 = 15 and r2 = 2. The parameters λ1,λ2 and λ3 are set to 5, 80 and 16 respectively. The curve evolution process stops either after 500 iterations or if the region size change of ϕ1 > 0 and ϕ2 > 0 is less than 5 pixels between two adjacent iterations. We determine these parameters by manually evaluating the performance of the algorithm using ten images which are not used in the evaluation process below. Finally the parameters for morphological refinements are set as introduced in Section 4. Lastly, the parameters for weight of the tubular term (16) are set as a = 20,b = 0.5.
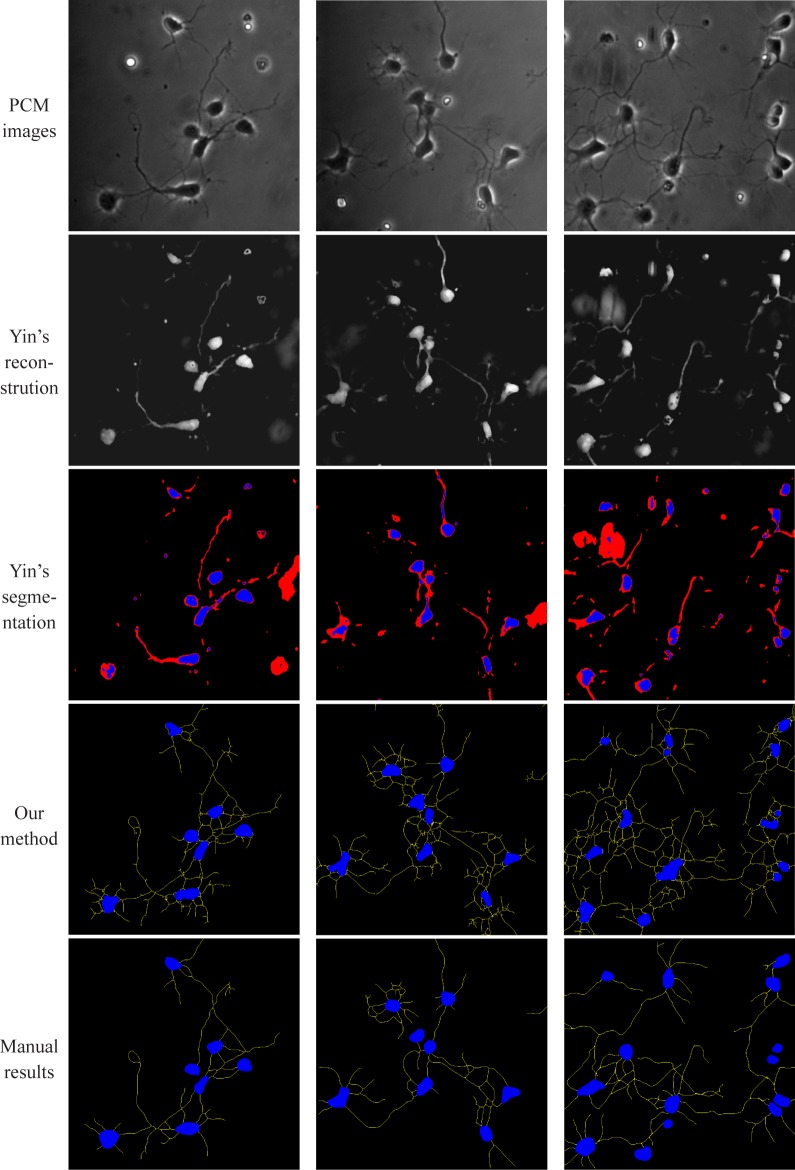
Results of our proposed method, the approach of Yin et al. in [2, 3] and manual annotation are presented in Fig. 12. In general, Yin’s method (both before and after Otsu-based thresholding [18]) works well in identifying high contrast somas and proves less capable of finding the dendrites. This performance though is to be expected given that the work in [2, 3] was specifically intended to localize cell bodies rather than extended, thin structures such as the dendrites in our data sets. In contrast, our method better recovers the dendrites and yields similar results for the somas. For the dendrites, our method produces more segments than manual results which is not unusual. Actually, even using the same software or algorithm, dendrite tracing results might be different due to different parameter setting or manual interaction. Thus, dendrites segmentation or tracking is usually not evaluated by absolute dendrite length [27, 44]. Later in this section, we present quantitative validation results based on Pearson’s correlation for dendrites as in [27]. In addition, the growth trend of dendrites matches well in the context of the IVM effect evaluation.
Fig. 12.
Segmentation results comparison. Columns: different PCM images. Rows (top to bottom): PCM images, Yin’s reconstruction results, Yin’s segmentation results, final results of our method and manual results respectively.
In order to quantitatively evaluate our segmentation results, 8 groups of PCM images of E18 rat cerebral cortical tissue were collected. In addition, 4 of these 8 groups are treated with IVM and the other 4 are control groups. Each group consists of 4 images taken at 0 hour, 2 hour, 4 hour, 6 hour and 24 hour for the same sample respectively. One group of the PCM images as well as the segmented results is included in Fig. 13. For the purpose of validation, we manually annotated somas of the 40 PCM images (8 groups multiply 5 images per group) and also dendrites traced manually by using NeuronJ [45]. The manual annotation process takes 5 to 10 minutes to annotate the somas and 30 to 45 minutes to trace the dendrites for one image in a completely hand-operated way. For our approach, no more manual operation is needed except parameter setting. Currently, for a 1728 × 1296 image, our method costs about 30 minutes using unoptimized Matlab codes on a Dell Precision T1600 PC with Quad Core 3.1GHz and 4GB RAM.
Fig. 13.
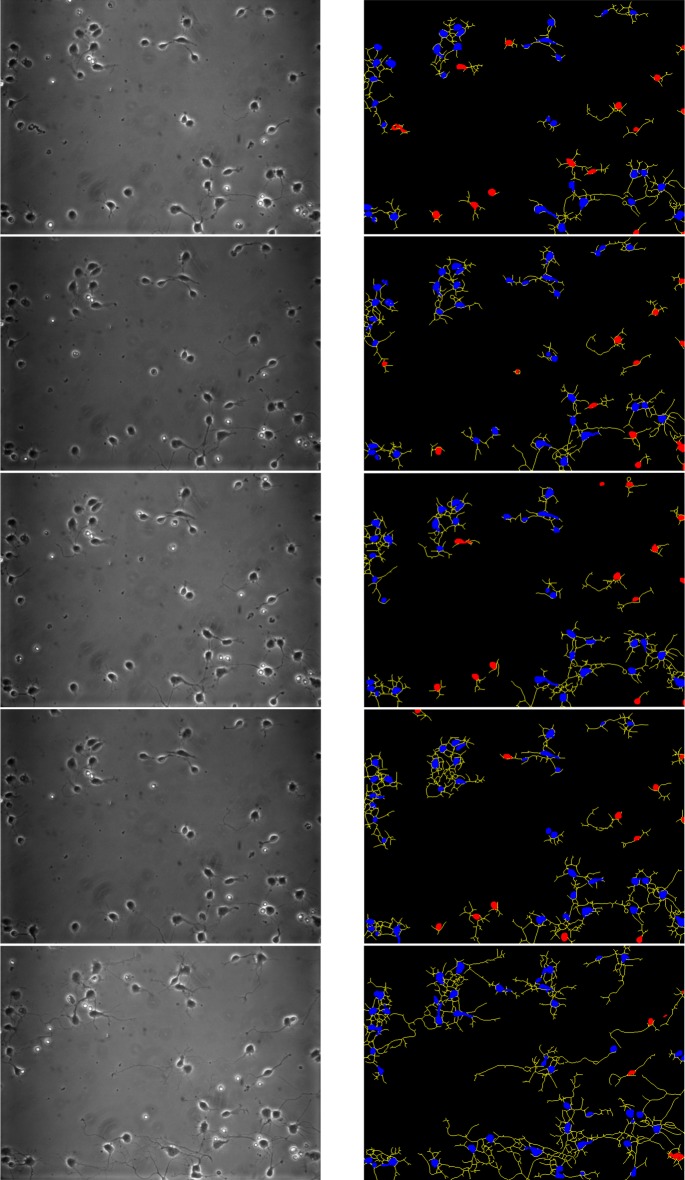
A group of images. Left column: PCM images; Right Column: segmentation results based on our method. Blue areas indicate connected somas, read areas denote isolated somas and yellow lines represent dendrites. Rows (top to bottom): 0, 2, 4, 6 and 24 hour respectively.
As in [19], we categorize somas into isolated somas and connected somas in order to study the neuronal growth. The isolated somas are defined as the somas which are not connected to other somas by dendrites and are further than 10 pixels from other somas [19]. As indicated in the right column of Fig. 13, the isolated somas detected by our approach are denoted by red areas. From Fig. 13, we can see that dendrites are growing and connecting more somas as time passes. In addition, the ratio of total soma number to isolated soma number is used as a metric to evaluate weather IVM suppress the neuronal growth as in [19]. Thus we need to perform evaluation on the segmentation of both isolated somas and all somas.
We use several metrics to evaluate soma segmentation. The first metric is called the accuracy (ACC) proposed in [2, 3]. We use P and N to denote soma pixels and background pixels (including dendrites) respectively. The true positive (TP) represents pixels that are both identified manually and our method. The false positive (FP) are pixels labeled by our method but not manually. The false negative (FN) denotes pixels that are segmented manually but not by our method. In addition, |·| represents the number of pixels. Then the accuracy is defined as
The second metric is the Dice coefficient which is defined as
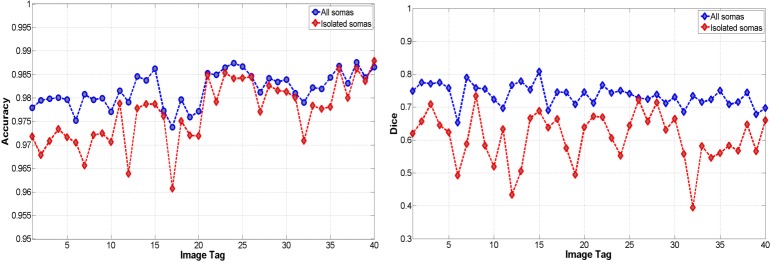
The ACC and DICE values of all somas and isolated somas for all 40 images are included in Fig. 14. We can see that the accuracies for all somas and the isolated somas are above 0.97 and 0.96 respectively. In addition, most of the dice coefficients range from 0.7 to 0.8 and 0.5 to 0.7 for all somas and isolated somas respectively. We see that the performance for isolated somas is a little worse. This though is not unexpected as identifying isolated somas is dependent on dendrite segmentation. Both false positive dendrites and false negative dendrites might cause incorrect isolated somas classification. Thus incorrect dendrite segmentation might degrade isolated soma segmentation results. Still all these values in Fig. 14 indicate that our method generates rather similar results as manual processing with very little manual effort.
Fig. 14.
Quantitative comparison between the proposed method and manual results for somas. Left: ACC results; Right: Dice results.
In addition to ACC and DICE which are defined by comparing pixels, we also get the soma numbers for validation as in [27]. From Fig. 15, we can see that our method is consistent with manual results for both isolated somas and total somas at all time points. The total soma numbers almost remain unchanged and the trend of isolated soma numbers is decreasing through different times suggesting that dendrites grow and connect to more somas as time goes by.
Fig. 15.
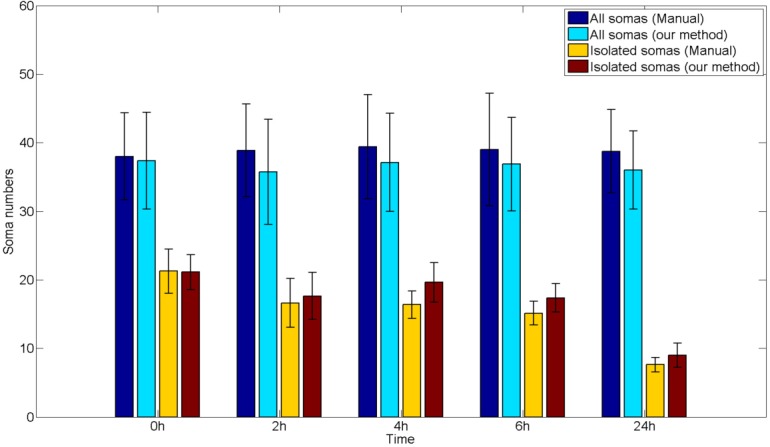
Soma numbers comparison.
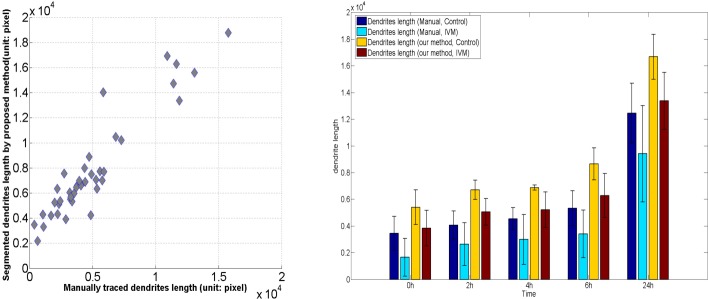
For dendrites evaluation, we also present dendrite length according to the control and IVM group at different time points in Fig. 16. We can see that our methods yields longer dendrites for both the control group and drug group at all time points. As mentioned in [27], different methods might generated different results for dendrites length. Thus the correlation is always used to validate dendrite segmentation [27]. In addition, the measured dendrites length using the proposed method as well as manual results for all 40 images are included in Fig. 16. The correlation between the two sets of results are 0.94 indicating the consistency of our method and manual results. Moreover, we can find that for both our method and manual results at all time points, the control group has fewer dendrites than that of the drug group suggesting that IVM suppresses the growth of neural cells.
Fig. 16.
Quantitative comparison between the proposed method and manual results for dendrites. Left: The x axis represents the manually traced dendrite length; the y axis denotes the segmented dendrites length using the proposed method. Each dot represents a results for each PCM image. Right: Comparison for dendrites at different time points and different groups
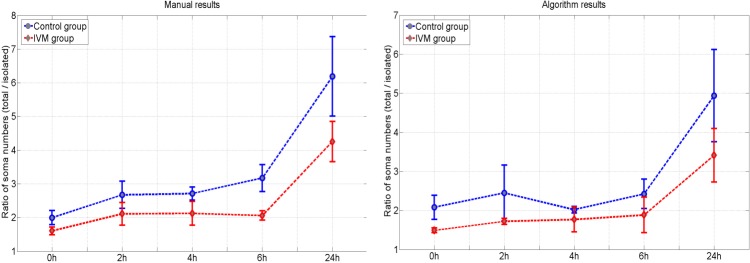
Finally, we check the ratio of all soma numbers to isolated soma numbers as displayed in Fig. 17. As already indicated in [19], manual results suggest IVM suppresses the neural growth and connectivity. Here we use repeated measures ANOVA test [46] to accommodate the drug and control group and the five time points. The statistical test result indicates that there is a significant (p = 0.0031) difference between the drug and control groups for manual results. For our method, the repeated measures ANOVA test also indicates that the ratios in the control group are significantly larger than that of the drug group (p = 0.0137).
Fig. 17.
Ratio of all soma numbers to isolated soma numbers. Left: manual results; Right: proposed method.
In summary, experimental results demonstrate that our method produces very similar segmentation results with manual annotation for somas. For dendrites, our method yields consistent results with manual results. In addition, our method can be applied to investigate IVM effect by investigating the significant difference of the ratio of all soma numbers to isolated soma numbers in both control group and drug group as time passes.
6. Conclusion and future work
In this paper, we introduce a parametric image model using the level set framework for the purpose of the PCM image restoration/segmentation. Then we present an optimization problem merging both image restoration and segmentation and give its solutions. Based on the segmentation method just mentioned, we introduce a pipeline for PCM neuron image analysis which is automatic and the first to segment somas and trace dendrites simultaneously for the PCM neuron images. The technical advantages of our method have been well demonstrated by comparing to other state of the art methods using both synthetic and real PCM images. Moreover, our approach is shown to be feasible for the study of IVM effect to neural growth and development.
We are going to build a regularization term to couple the somas and dendrites in the variational formulation (8). Usually for the multi-level set formulation, constraints need to be imposed to avoid overlap [30,47–49]. In the neuron application, no clear boundaries exist between the soma and dendrites for a neuron. Normal overlap penalty term such as [30] would separate somas and dendrites which is not we want for the neural connectivity evaluation. Thus building a regularization term which can avoid overlap between somas and dendrites and also connect them is an interesting problem and also one of the future works.
Currently, the coefficient s1 and s2 in (7) are two scalars which means the phase retardation image θ (x) is a piecewise constant model [22]. By extending s1 and s2 to be spatial variant fields s1(x) and s2(x), θ (x) can be extended to a piecewise smooth model [47] which could better model neural cells over the whole image domain. Moreover, we may also investigate the integration of machine learning techniques such as in [50] in modeling θ (x) within the level set framework.
One important future direction is to develop methods for the optimal selection of the parameters such as λ1, λ2 and λ3 to further reduce manual interaction. Another important area of future work should be devoted to accelerate our method via: using faster programming languages such as C++; using fast level set implementation techniques such as [51]; using parallel computing techniques such as Graphics Processing Unit (GPU).
Phase contrast microscopy belongs to a type of microscopy called partially coherent microscopies [25,26] which does not need fluoresce or staining for specimens. Besides phase contrast microscopy, dark field and differential interference contrast (DIC) microscopy are also examples of spatially partially coherent microscopies. A key issue here is the difference in the point spread functions among these microscopes which in turn give rise to data-domain artifacts that also differ from those seen in this study. While we believe that the basic, two-level set approach pursued here can be used in the context of these other microscopes, changes and adaptation will certainly be required to apply these ideas to other cell lines as well as partially coherent modalities.
Acknowledgments
The authors would like to thank the reviewers for their insightful comments that help improve the manuscript significantly. This study was supported by German Research Council (DFG, OE 541/2-1), National Institutes of Health (NIH)10.13039/100000002 via grants R01 AR005593 and R01 AR061988 and National Science Foundation (NSF)10.13039/100000001 award 1347191. Office of Electricity Delivery and Energy Reliability (OE)10.13039/100006130
References and links
- 1.Zernike F., “How I discovered phase contrast,” Science 121, 345–349 (1955). 10.1126/science.121.3141.345 [DOI] [PubMed] [Google Scholar]
- 2.Yin Z., Li K., Kanade T., Chen M., “Understanding the Optics to Aid Microscopy Image Segmentation,” MICCAI, 6361 209–217 (2010). [DOI] [PubMed] [Google Scholar]
- 3.Yin Z., Kanade T., Chen M., “Understanding the phase contrast optics to restore artifact-free microscopy images for segmentation,” MedIA 16, 1047–1062 (2012). [DOI] [PMC free article] [PubMed] [Google Scholar]
- 4.Li K., Miller E. D., Weiss L. E., Campbell P. G., Kanade T., “Online tracking of migrating and proliferating cells imaged with phase-contrast microscopy,” IEEE CVPR workshop, 65 (2006). [Google Scholar]
- 5.Ersoy I., Bunyak F., Palaniappan K., Sun M., Forgacs G., “Cell spreading analysis with directed edge profile-guided level set active contours,” MICCAI, 5241 376–383 (2008). [DOI] [PMC free article] [PubMed] [Google Scholar]
- 6.Bradhurst C. J., Boles W., Xiao Y., “Segmentation of bone marrow stromal cells in phase contrast microscopy images,” IEEE Inter. Conf. Image Vis. Computing, 1–6 (2008). [Google Scholar]
- 7.Ambuhl M. E., Brepsant C., Meister J., Verkhovsky A. B., Sbalzarini I. F., “High-resolution cell outline segmentation and tracking from phase-contrast microscopy images,” J. Microscopy 245, 161–170 (2012). 10.1111/j.1365-2818.2011.03558.x [DOI] [PubMed] [Google Scholar]
- 8.Can A., Shen H., Turner J. N., Tanenbaum H. L., Roysam B., “Rapid automated tracing and feature extraction from retinal fundus images using direct exploratory algorithms,” IEEE Trans. Inf. Tech. Biomed. 3, 125–138 (1999). 10.1109/4233.767088 [DOI] [PubMed] [Google Scholar]
- 9.Frangi R. F., Niessen W. J., Vincken K. L., Viergever M. A., “Multiscale vessel enhancement filtring,” MICCAI, 1496 130–137 (1998). [Google Scholar]
- 10.Lorigo L. M., Faugeras O. D., Grimson W. E. L., Kervien R., Kikinis R., Nabavi A., Westin C. F., “CURVES: Curve evolution for vessel segmentation,” MedIA 5, 195–206 (2001). [DOI] [PubMed] [Google Scholar]
- 11.Krissian K., “Model based detection of tubular strucutres in 3D images,” Comput. Vis. Image Und. 80, 130–171 (2000). 10.1006/cviu.2000.0866 [DOI] [Google Scholar]
- 12.Vasilevskiy A., “Flux maximizing geometric flows,” IEEE Trans. PAMI 24,1565–1578 (2002). 10.1109/TPAMI.2002.1114849 [DOI] [Google Scholar]
- 13.Vaughn J. E., “Fine structure of synaptogenesis in the vertebrate central nervous system,” Synapse 3, 255–285 (1989). 10.1002/syn.890030312 [DOI] [PubMed] [Google Scholar]
- 14.Gerstein G. L., Bedenbaugh P., Aertsen M. H., “Neuronal assemblies,” IEEE Trans. Biomed. Eng. 36, 4–14 (1989). 10.1109/10.16444 [DOI] [PubMed] [Google Scholar]
- 15.Meijering E., “Neuron tracing in perspective,” Cytometry Part A 77, 693–704 (2010). 10.1002/cyto.a.20895 [DOI] [PubMed] [Google Scholar]
- 16.Al-Kofahi O., Radke R. J., Roysam B., Banker G., “Automated semantic analysis of changes in image sequences of neurons in culture,” IEEE Trans. on Biomed. Eng. 53, 1109–1123 (2006). 10.1109/TBME.2006.873565 [DOI] [PubMed] [Google Scholar]
- 17.Vestergaard J. S., Dahl A. L., Holm P., Larsen R., “Pipeline for tracking neural progenitor cells,” MICCAI Workshop WCV, 7766 155–164 (2012). [Google Scholar]
- 18.Otsu N., “A threshold selection method from gray-level histograms,” IEEE Trans. Sys. Man. Cyber. 9, 62–66 (1979). 10.1109/TSMC.1979.4310076 [DOI] [Google Scholar]
- 19.Ozkucur N., Quinn K. P., Pang J., Georgakoudi I., Miller E., Levin M., Kaplan D. L., “Membrane potential depolarization causes alterations in neuron arrangement and connectivity in cocultures,” Brain and Behav. 5, e00295 (2005). [DOI] [PMC free article] [PubMed] [Google Scholar]
- 20.Osher S. J., Fedkiw R. P., Level Set Methods and Dynamic Implicit Surfaces(Springer-Verlag, 2002). [Google Scholar]
- 21.Sethian J. A., Level Set Methods and Fast Marching Methods: Evolving Interfaces in Computational Geometry, Fluid Mechanics, Computer Vision, and Materials Science(Cambridge University Press, 1999). [Google Scholar]
- 22.Chan T. F., Vese L. A., “Active contours without edges,” IEEE Trans. Image Process. 10, 266–277 (2001). 10.1109/83.902291 [DOI] [PubMed] [Google Scholar]
- 23.Sagan H., Introduction to the Calculus of Variations (Courier Dover Publications, 2012). [Google Scholar]
- 24.Murphy D., Fundamentals of Light Microscopy and Electronic Imagings(Wiley, 2001). [Google Scholar]
- 25.Born M., Wolf E., Principles of Optics: Electromagnetic Theory of Propagation, Interfence and Diffraction of Light(Cambridge University Press, 1999). 10.1017/CBO9781139644181 [DOI] [Google Scholar]
- 26.Mehta S. B., Oldenbourg R., “Image simulation for bilogical microscopy: microlith,” Biomed. Opt. Express 5, 1822–1838 (2014). 10.1364/BOE.5.001822 [DOI] [PMC free article] [PubMed] [Google Scholar]
- 27.Ho S-Y, Chao C-Y, Huang H-L, Chiu T-W, Charoenkwan P., Hwang E., “NeurphologyJ: An automatic neuronal morphology quantification method and its application in pharmacological discovery,” BMC Bioinformatics 12, 1471–2105 (2011). 10.1186/1471-2105-12-230 [DOI] [PMC free article] [PubMed] [Google Scholar]
- 28.Lankton S., Tannenbaum A., “Localizing region-based active contours,” IEEE Trans. Image Process. 17, 2029–2039 (2008). 10.1109/TIP.2008.2004611 [DOI] [PMC free article] [PubMed] [Google Scholar]
- 29.Gooya A., Liao H., Matsumiya K., Masamune K., Masutani Y., Dohi T., “A variational method for geometric regularization of vascular segmentation in medical images,” IEEE Trans. Image Process. 17, 1295–1312 (2008). 10.1109/TIP.2008.925378 [DOI] [PubMed] [Google Scholar]
- 30.Zimmer K., Oliver-Marin J., “Compled Parametric Active Contours,” IEEE Trans. on PAMI 27, 1838–1842 (2005). 10.1109/TPAMI.2005.214 [DOI] [PubMed] [Google Scholar]
- 31.Vogel C. R., “Computational methods for inverse problems,” SIAM (2002).
- 32.Wang Y., Yang J., Yin W., Zhang Y., “A new alternating minimization algorithm for total vairation image reconstruction,” SIAM J. Imaging Sciences 1, 248–272 (2008). 10.1137/080724265 [DOI] [Google Scholar]
- 33.Li C., Kao C.Y, Gore J.C., Ding Z., “Minimization of region-scalable fitting energy for image segmentation,” IEEE Trans. Image Process. 17, 1940–1949 (2008). 10.1109/TIP.2008.2002304 [DOI] [PMC free article] [PubMed] [Google Scholar]
- 34.Yezzi A., Tsai A., Willsky A., “A fully global approach to image segmenation via coupled curve evolution equation,” J. Vis. Comm. Image Rep. 13, 195–216 (2002). 10.1006/jvci.2001.0500 [DOI] [Google Scholar]
- 35.Caselles V., Kimmel R., Sapiro G., “Geodesic active contours,” IJCV 22, 61–79 (1997). 10.1023/A:1007979827043 [DOI] [Google Scholar]
- 36.Wu K., Gauthier D., Levine M., “Live cell image segmentation,” IEEE Trans. on Biomed. Eng. 42, 1–12 (1995). 10.1109/10.362924 [DOI] [PubMed] [Google Scholar]
- 37.Freeman W., Adelson E., “The design and use of steerable filters,” IEEE Trans. PAMI 13, 891–906 (1991). 10.1109/34.93808 [DOI] [Google Scholar]
- 38.Kittler J., Illingworth J., “Minimum error thresholding,” Pattern Recogn. 19, 41–47 (1986). 10.1016/0031-3203(86)90030-0 [DOI] [Google Scholar]
- 39.Ng M. K., Chan R. H., Tang W. C., “A fast algorithm for deblurring models with Neuman boundary conditions,” SIAM J. Sci. Comput. 21, 851–8666 (1999). 10.1137/S1064827598341384 [DOI] [Google Scholar]
- 40.Serra-Capizzano S., “A note on Antireflective boundary Conditions and fast deblurring models,” SIAM J. Sci. Comput. 25, 1307–1325 (2004). 10.1137/S1064827502410244 [DOI] [Google Scholar]
- 41.Nam D., Mantell J., Bull D., Verkade P., Achim A., “A novel framework for segmentation of secretory granules in electron micrographs,” MedIA 18, 411–424(2014). [DOI] [PubMed] [Google Scholar]
- 42.Gonzalez R. C., Woods R. E., Digital Image Processing(Prentice Hall, 2007). [Google Scholar]
- 43.Gonzalez R. C., Woods R. E., Eddins S. L., Digital Image Processing using MATLAB (Gatesmark Publishing, 2009). [Google Scholar]
- 44.Dehmelt L., Poplawski G., Hwang E., Halpain S., “NeuriteQuant: An open source toolkit for high content screens of neuronal morphogenesis,” BMC Neurosci. 12, 100 (2011). 10.1186/1471-2202-12-100 [DOI] [PMC free article] [PubMed] [Google Scholar]
- 45.Meijering E., Jacob M., Sarria J.-C.F., Steiner P., Hirling H., Unser M., “Design and validation of a tool for neurite tracing and analysis in fluorescence microscopy images,” Cytometry Part A 58A, 167–176 (2004). 10.1002/cyto.a.20022 [DOI] [PubMed] [Google Scholar]
- 46.Davis C. S., Statistical Methods for the Analysis of Repeated Measurements(Springer, 2002). [Google Scholar]
- 47.Vese L., Chan T., “A multiphase level set framework for image segmentation using the Mumford and Shah model,” IJCV 50, 271–293 (2002). 10.1023/A:1020874308076 [DOI] [Google Scholar]
- 48.Vazquez-Reina A., Miller E., Pfister H., “Multiphase geometric couplings for the segmentation of neural processes,” IEEE Conf. CVPR, 2020–2027 (2009). [Google Scholar]
- 49.Pang J., Driban J. B., McAlindon T. E., Tamez-Pena J. G., Fripp J., Miller E. L., “On the use of directional edge information and coupled shape priors for segmentation of magnetic resonance images of the knee,” IEEE J. of Biomed. and Health Inform. 19, 1153–1167 (2015). [DOI] [PMC free article] [PubMed] [Google Scholar]
- 50.Su H., Yin Z., Huh S., Kanade T., “Cell segmentation in phase contrast microscopy images via semi-supervised clustering over optics-related feataures,” MedIA 17, 746–765 (2013). [DOI] [PubMed] [Google Scholar]
- 51.Shi Y., Karl W. C., “A real-time algorithm for the approximation of level-set-based curve evolution,” IEEE Trans. Image Process. 17, 645–656 (2008). 10.1109/TIP.2008.920737 [DOI] [PMC free article] [PubMed] [Google Scholar]


