Abstract
Three-part differential white blood cell counts are used for disease diagnosis and monitoring at the point-of-care. A low-cost, miniature achromatic microscope was fabricated for identification of lymphocytes, monocytes, and granulocytes in samples of whole blood stained with acridine orange. The microscope was manufactured using rapid prototyping techniques of diamond turning and 3D printing and is intended for use at the point-of-care in low-resource settings. The custom-designed microscope requires no manual adjustment between samples and was successfully able to classify three white blood cell types (lymphocytes, granulocytes, and monocytes) using samples of peripheral whole blood stained with acridine orange.
OCIS codes: (170.2520) Fluorescence microscopy, (170.3880) Medical and biological imaging, (170.1470) Blood or tissue constituent monitoring
1. Introduction
The white blood cell (WBC) differential is one component of a complete blood count (CBC), an evaluation performed for standard blood work-ups. The WBC differential count is essential at the point-of-care when screening for quantitative abnormalities in otherwise morphologically normal white blood cell populations, a condition which may occur with certain infectious diseases, such as Dengue fever [1–3]. Three-part WBC differentials identify and quantify lymphocytes, monocytes, and granulocytes. The three part WBC differential has been shown to be a reliable clinical benchmark when compared to conventional differential counts or five part white blood cell counts [4–7].
At the point of care, especially in developing countries, having immediate access to WBC differential results aids clinicians in selecting appropriate treatment, such as the proper choice of antibiotics to treat a disease [8]. For example, an increased or decreased total white blood cell count (WBC) may indicate abnormal bone marrow pathology [9]. Leukocytosis with an associated lymphocyte count may indicate the presence of a microbial or viral infection [10]. Clinicians may also use the WBC biomarker to mitigate risks of improper treatment and identify patients in need of immediate treatment and a closer follow-up [11]. Two commonly used techniques for WBC differentials, flow cytometry and optical methods such as fluorescence imaging and light scattering, have replaced manual cell counting by a laboratory technician with a microscope and hemacytometer [6, 12, 13]. Many flow-based counting devices are impractical for point of care use due to their high cost and infrastructure requirements [14].Typical image based counting methods, despite shortcomings such as a small field of view, require less complex sample preparation, and have the potential to be miniaturized. Small field of view necessitates a technician to acquire multiple fields of view to get an accurate differential and complete count. For optical evaluation, the readily available, nonspecific fluorescent dye acridine orange may be used to stain samples of whole blood [13, 15–17]. Acridine orange (AO) is a stain that may be applied directly to an undiluted wet sample without rinsing and can be used to provide a diagnosis within approximately ten minutes [14, 18]. Acridine orange binds strongly to double stranded DNA, and when bound its excitation maximum is 502 nm and its emission maximum is 525 nm. It also binds strongly to RNA and single stranded DNA, with a shifted excitation maximum of 460 nm and an emission maximum of 650 nm. It is hydrophobic and neutral in pH and therefore can easily diffuse through cell membrane and cell nucleus membrane to bind to RNA and DNA. The WBC cell nucleus is stained green with small quantities of red because of double stranded DNA and single stranded RNA, while the cell cytoplasm is stained predominantly red because of the presence of RNA and lysosomes [13]. Differentiation is performed by quantifying signal from 525 nm and 650 nm channels.
Commercially available points of care devices for clinical use in the United States include the Chempaq, the HemoCue WBC, and the HemoCue WBC Diff. These devices use impedance cell counting and spectrophotometric measurement of hemoglobin concentration in a small sample (20 microliters) of blood [7, 19]. The HemoCue WBC measures total WBC count but does not provide a differential [1]. The Chempaq provides the user with a differential output and has a coefficient of variation <15% for lymphocyte and granulocyte counts, but has poor monocyte correlation when compared to the Beckman Coulter LH 750, used as a reference standard [20]. The HemoCue WBC DIFF performs a five-part WBC differential, but retails for more than $1000 and has a per test cost of $3.52, making it undesirable for low-resource areas. There remains need for a low-cost point of care instrument that has the capability to accurately perform monocyte classification, since this group of cells is typically harder to identify even with commonly used hematology analyzers.
An achromatic miniature microscope, optimized for the peak emission maxima of acridine orange bound to DNA and RNA (525 nm and 650 nm, respectively), was designed for the observation and classification of white blood cells in undiluted whole blood samples stained with acridine orange. The custom microscope objective was fabricated out of plastic via single point diamond turning for rapid prototyping purposes. Single point diamond turning produces plastic lenses with optical quality surface roughness [21–23]. Plastic substrates for the custom fabricated lenses were carefully selected to minimize axial chromatic aberration. The plastic objective was integrated into all-plastic, 3D-printed housing. Once the objective was initially adjusted to the proper working distance using the 3D-printed optomechanics, the system required no further manual adjustments to refocus the optics between different samples. Because the sample consists of fluorescently stained undiluted blood, only one field of view (1.2 mm) was necessary to capture statistically significant information (>100 WBCs/FOV) regarding quantities of various white blood cell types. The digital microscope classifies WBC types (lymphocytes, monocytes, granulocytes) based on the ratio of red to green intensity within each cell, rather than morphology. The sections that follow describe the optical design and fabrication of a custom designed, all-plastic prototype of an achromatic miniaturized microscope for identification of white blood cells in whole blood for use at the point-of-care in resource-limited settings.
2. Experimental methods
2.1 Optical design of miniature objective
An optical schematic of the miniature objective designed for classification of white blood cells is shown in Fig. 1.
Fig. 1.
Optical schematic of the miniature achromatic objective.
The objective was custom designed using Zemax® (Radiant Zemax, Redmont, WA, USA). A summary of the basic optical parameters of the microscope is presented in Table 1.
Table 1. Summary of optical parameters of miniature fluorescent microscope.
| NA (object side) | 0.35 |
| Magnification | −4.5x |
| Telecentric object space | Yes |
| Object side Field Of View diameter | 1.2 [mm] |
| Objective working distance | 1.33 [mm] |
| Design wavelengths | 525,650 [nm] |
| Total length of optical system | 78.95 [mm] |
The optical prescription data of the microscope objective is given in Table 2 The microscope objective has a numerical aperture (NA) of 0.35, focal length of 11 mm and a 1.2 mm diameter Field of View (FOV). The field of view was designed to be greater than 1 mm so that at least 130 cells would be present in each field for statistical significance when quantifying three-part white blood cell differential.
Table 2. Optical prescription data of miniature microscope Radii, thicknesses and semi-diameters are in units of [mm].
| Surface | Radii | Thickness | Material | Semi-diameter | Conic |
Higher Order Aspheric Terms |
|
|---|---|---|---|---|---|---|---|
| 6th Order Term | 8th Order Term | ||||||
| 0 (Sample) | ∞ | 0.200 | Seawater | 0.600 | |||
| 1 (Slide) | ∞ | 0.100 | BK7 | 0.654 | |||
| 2 | ∞ | 1.326 | 0.678 | ||||
| 3 (Coverslip) | ∞ | 0.150 | BK7 | 1.164 | |||
| 4 | ∞ | 0.300 | 1.199 | ||||
| 5 (Lens 1) | −3.3960 | 4.714 | PMMA | 1.218 | 2.329 | −9.622E-0 | −3.423E-006 |
| 6 | −3.3219 | 1.147 | 2.698 | −0.338 | |||
| 7 | ∞ | 7.405 | 2.957 | ||||
| 8 (Lens 2) | 20.538 | 6.500 | Polystyrene melt | 3.777 | 0.711 | ||
| 9 | 4.434 | 0.300 | NOA 61 | 3.678 | −1.682 | ||
| 10 (Lens 3) | 4.341 | 6.500 | PMMA | 3.678 | −1.637 | 1.697E-005 | −6.041E-007 |
| 11 | −10.003 | 3.816 | 3.850 | −1.199 | |||
| 12(Em. filter) | ∞ | 4.754 | BK7 | 3.681 | |||
| 13 | ∞ | 10.000 | 3.610 | ||||
| 14 (IR filter) | ∞ | 1.000 | D263T_BROAD | 3.382 | |||
| 15 | ∞ | 30.736 | 3.367 | ||||
| 16 | −50.000 | 2.664 | |||||
The magnification of the microscope is −4.5x. The objective has a maximum clear aperture diameter of 7.700 mm. It is 27 mm long as measured from front lens to final lens surface. The elements following the objective in the optical schematic shown in Fig. 1 include the emission filter (BLP-1-532R-25, Semrock, USA) and the IR filter on the detector (Flea3, Point Grey Research Inc., Canada). The total length of the optical system is 78.95 mm as measured from sample to detector plane.
The design was optimized at seven field points, distributed along the Y-field object axis from 0 mm to 0.6 mm. The modular transfer function (MTF) and spot diagram plots for each wavelength (525 nm and 650 nm) are shown in Fig. 2. These diagrams indicate that diffraction limited performance was expected for all field points and wavelengths in nominal working conditions, achieved through use of aspheric components and one achromatic doublet. To retain a simple and compact design, the design was corrected for axial chromatism only. Additionally, lateral chromatism may be numerically corrected in post-processing of images.
Fig. 2.
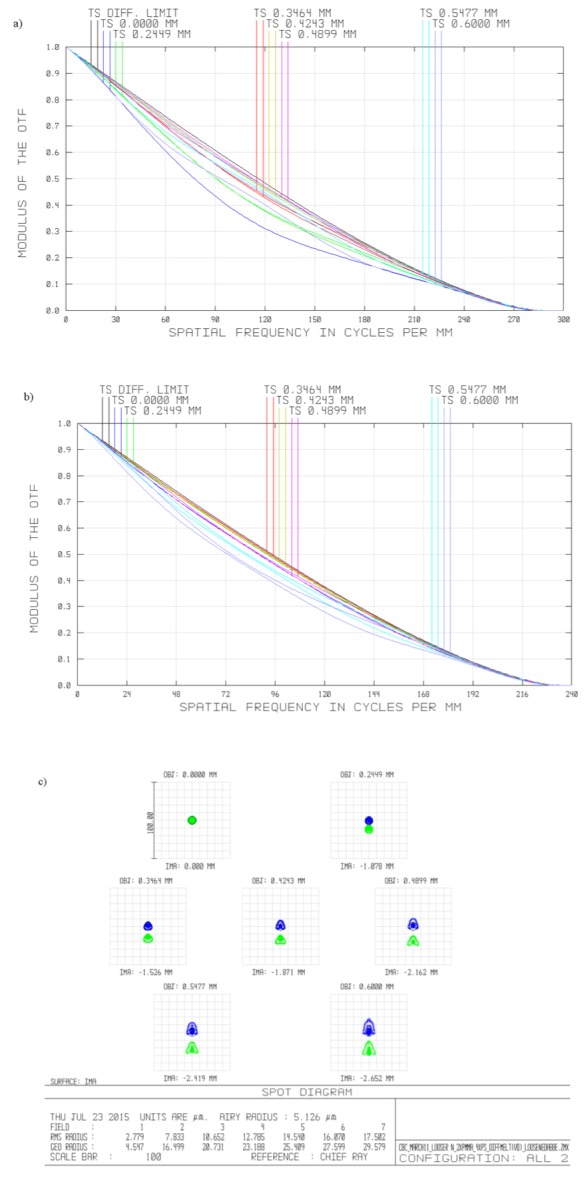
Performance metrics of the miniature tunable fluorescent microscope for nominal working conditions: (a) modulation transfer function for expected performance at 525 nm, (b) modulation transfer function for expected performance at 650 nm, (c) spot diagram for expected performance at 525 nm (shown in blue) and 625 nm (shown in green). All plots are for image surface for design wavelength of 590nm, for following object points: 0.0mm, 0.25mm, 0.35mm, 0.45 mm, 0.50 mm, 0.55 mm, 0.6 mm. Airy disk radii for 525 nm and 650 nm: 4.179 and 5.126µm, respectively.
The achromatic design was optimized for two wavelengths, 525 nm and 650 nm, which correspond to the peak emission wavelengths of acridine orange bonded to double stranded DNA and RNA/single stranded DNA, respectively. The objective is comprised of three aspheric lenses, which are easier to manufacture via diamond turning than with traditional manufacturing methods. Two lenses are made of Poly(methyl methacrylate) (PMMA) and one lens is made of polystyrene. These materials were chosen due to their well-documented machinability on diamond turning machines and low autofluorescence [21]. To achieve achromatic performance, the design contains only one achromatic doublet, consisting of a polystyrene lens and a PMMA lens. The lenses comprising the doublet are affixed with NOA 61 optical glue (Norland, New Jersey, USA). The glue is set using UV light to permanently bond the lenses.
Proper characterization of the lens substrate materials is critical to accurately model the chromatic performance of the system. Note in Table 2 the material of the second lens in the objective is listed as “polystyrene melt” rather than “polystyrene”. The original system prescription was modeled in Zemax using the default “polystyrene” material properties from the software’s glass catalogue. Measurements obtained on an Abbe refractometer (DR-M2, Atago, USA) did not match the refractive index data listed in Zemax. The refractive index of materials varies with batch and between manufacturers. This was observed experimentally since the refractive index measurements of our selected batch of polystyrene fell outside the default refractive index and Abbe number tolerance values used to optimize the design. We also measured the PMMA batch and found that our experimental (PMMA measurements agreed with the values given in the Zemax catalogue). Table 3 displays the default refractive index values for polystyrene as defined in the Zemax glass catalogues as well as the refractive index values measured for the selected batches of material on the Abbe refractometer. The default refractive index tolerances used in the group are ± 0.001. The differences in measured and default polystyrene refractive index values for the chosen batch of polystyrene fell outside of the tolerance boundaries, therefore prompting a modification of the material properties in the Zemax models with a best-fit curve based on the Schott formula using the refractive index measurements taken at four wavelengths shown in Table 3.
Table 3. Measured vs. reported refractive index values for polystyrene and PMMA.
| Polystyrene | PMMA | |||||
| λ (nm) | Measured | Reported (Zemax) | Difference | Measured | Reported (Zemax) | Difference |
| 486 | 1.5964 | 1.6041 | 0.0077 | n/a* | 1.4978 | n/a |
| 546 | 1.5884 | 1.5950 | 0.0066 | 1.4934 | 1.4938 | 0.0004 |
| 589 | 1.5834 | 1.5915 | 0.0079 | 1.4910 | 1.4917 | 0.0007 |
| 656 | 1.5778 | 1.5850 | 0.0072 | 1.4883 | 1.4892 | 0.0009 |
*value outside measurement range of Abbe refractometer
The Abbe number (Vd) was calculated using the equation:
| (1) |
where nD, nF, and nC are the refractive indices of polystyrene at the Fraunhofer spectral lines (589.3 nm, 486.1, and 656.3 nm, respectively). Abbe numbers are shown in Table 4.
Table 4. Calculated vs. reported (in Zemax) Vd for polystyrene and PMMA.
| Polystyrene | PMMA | |
|---|---|---|
| Vd (calculated) | 31.366 | n/a* |
| Vd (reported) | 30.867 | 57.441 |
| % change | 1.16% | n/a |
*value for nD outside measurement range of Abbe refractometer
During the design process, the default refractive index tolerance value used in the group ( ± 0.001) was modified to ± 0.002 for NOA 61 optical glue and ± 0.004 for polystyrene and PMMA and the Abbe number tolerance value was loosened from ± 1% to ± 2% to allow to match measured values for the selected batch of material and to allow use of materials from other sources if necessary. The revised tolerance parameters are displayed in Table 5.
Table 5. Tolerance parameters of the miniature fluorescent microscope.
| Parameter | Radii [%] |
Thickness [mm] |
Element Decentration [mm] |
Element Tilt [°] |
Surface Decenter Tilt [mm] |
Irregularity [Fringes] |
Abbe [%] |
N [a.u.] |
| Value | ±0.5% | ± 0.02 | ± 0.02 | ± 0.20 | ± 0.02 | ± 0.2 | ± 2 | ± 0.004*, ±0.002** |
*index tolerances loosened to ± 0.004 for PMMA and polystyrene lenses
**index tolerances loosened to ± 0.002 for NOA 61 optical glue
Based on 1,000 runs of Monte-Carlo simulations, it was estimated that the miniature objective would achieve diffraction limited performance on-axis with 50% probability and there would be a 50% of chance of reaching diffraction limited performance within the field of view enclosed by a disk of radii of 0.42mm (70% of object height). Using RMS wavefront as the criterion, the estimated change in performance due to manufacturing tolerances calculated using the Root Sum Square (RSS) algorithm was estimated to be 0.041 and the total estimated system performance (nominal + change) was estimated to be 0.144. The Rayleigh criterion-defined resolution of the system was 0.89 mm at 525 nm and 1.1 mm at 650 nm. Because the sample target (white blood cells) was larger than the theoretical diffraction limit by a factor of approximately ten, the expected system performance was determined to be suitable for the application.
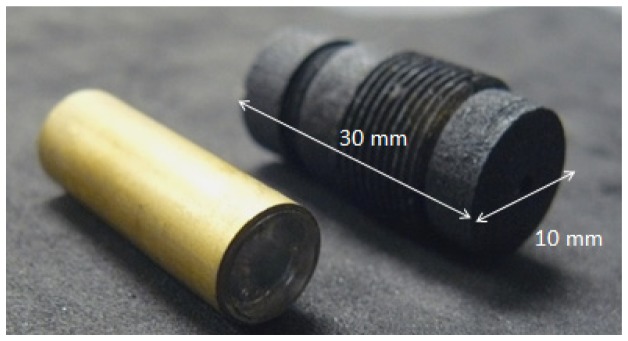
The microscope objective was manufactured on the Precitech Optimum 2400 (Ametek, Precitech, Keene, NH, USA) diamond turning lathe. Pellets of optical grade plastics were mounted on the diamond turning machine using ER16-UP (Rego-Fix, Tenniken, Switzerland) collets housed in a custom vacuum chuck compatible holder. Diamond turning paths were generated using the Diamond Turning Path Generator (DTPG v2.54, Precitech, NH, USA) program based on the Zemax lens drawings. A brass spacing feature was diamond turned to space the singlet lens from the achromatic doublet. The lenses and brass spacing feature were stacked inside a larger brass tube. The outer diameter of all lenses and the brass spacer was manufactured to meet tight tolerances to fit within the inner diameter of the outer brass tube. Figure 3 illustrates the assembled objective in the brass tubing (left) and the 3D printed threaded objective holder (right).
Fig. 3.
Assembled plastic objective inside brass tubing (left). 3D printed threaded objective holder (right).
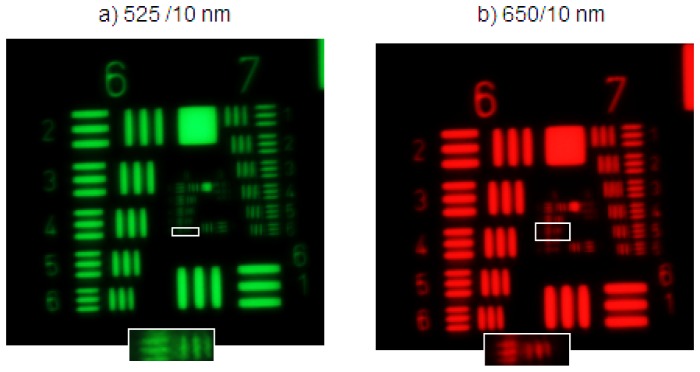
The microscope objective was tested at 520 nm and 650 nm using a white light source (MWWHL3, Thorlabs, USA) and two 10 nm bandpass filters (Stock No: #65-639 and #65-656 Edmund Optics, USA) that were manually exchanged. A high resolution, negative 1951 USAF resolution test (Stock No: #55-622, Edmund Optics, NJ, USA) was used to assess the microscope performance. Based on the Rayleigh criterion, the microscope should out resolve the resolution target at both wavelengths. The distance between the objective and the USAF target was stationary between wavelengths. For as designed chromatic performance, the resolution for both wavelengths would be the same. Figure 4 shows a magnified image of the target at both wavelengths. The resolution at 525 nm was found to be group 8 element 6, corresponding to 456.1 lp/mm. At 650 nm the resolution was group 8 element 4, corresponding to 362.0 lp/mm. A magnified image of the smallest resolvable element at each wavelength is shown in Fig. 4(a) and Fig. 4(b) as insets. The system was accepted because the minimum resolvable line pair was adequate to resolve the target sample.
Fig. 4.
Images of high resolution USAF target taken with the miniature 0.35 NA achromatic objective. (a) Image acquired at 525 nm, (b) Image acquired at 650 nm. Magnified inlays of the smallest resolvable elements are shown outlined in each image. Contrast has been enhanced for presentation purposes.
The use of a 0.35 NA objective allows us to acquire properly exposed images over the period of 400 ms, which falls below the exposure time experimentally found to rapidly photobleach the fluorescent dye (1500 ms). The limited depth of field (6 µm at 525 nm) of the optics may cause some of the fluorescently stained WBC to appear blurred on the camera. This will be discussed further in the section 2.3. However, to correctly classify WBC into three groups (lymphocytes, monocytes, granulocytes) we only need to distinguish between individual WBCs and compare their respective relative ratio of fluorescence in two mutually separated emission channels centered at 525 nm and 650 nm. Because we do not perform any morphological analysis, we can successfully process blurred images of WBCs up to the point when adjacent WBCs starts to overlap. Since typically, even in case of patients in severe illness, density of WBCs in non-concentrated smears is low, we decided to deliberately leave nominal, as designed NA of the system, in order to avoid photobleaching as well as reduce data acquisition time.
2.2 Sample cartridge design
Capillary blood was obtained from healthy adult donors and immediately imaged. Blood samples were prepared using a novel cartridge design [24] consisting for layers of tape and a glass cover slip on a glass slide. The cartridge spreads approximately 20 µL of blood into a thin layer of 88 µm directly from a finger prick. Acridine orange is dried in the cartridge and automatically dissolves upon the introduction of the blood sample to a final concentration of [10 µg/mL], staining the white blood cells in the sample.
2.3 Optomechanical design
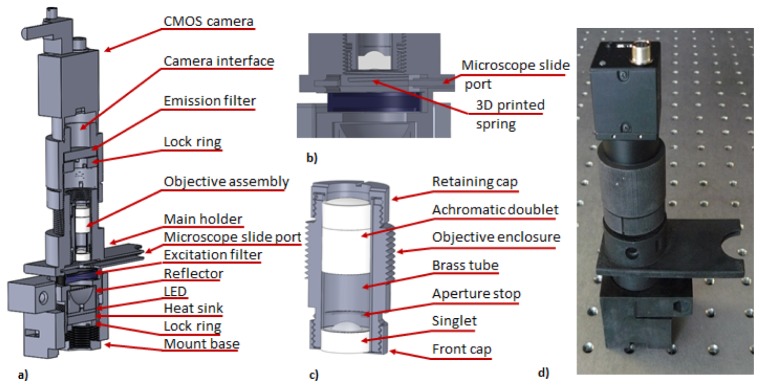
The optomechanical assembly of the miniature WBC microscope is presented in Fig. 5. We designed mechanical components of the system in SolidWorks (Dassault Systèmes SolidWorks Corp., USA). All custom parts of the WBC assembly were 3D printed (ProJet HD 3000, 3D Systems, USA) and painted black using matt enamel (Matte Black 33, Humbrol, UK) to attenuate stray light.
Fig. 5.
(a) Optomechanical schematic of the miniature WBC microscope, (b) cross-section through sample chamber with 3D printed microscope slide positioning springs, (c) details of the optomechanical assembly of the prototype of the WBC objective, (d) photograph of assembled 3D printed WBC microscope is shown on an optical bench. The spacing between the holes is 1 inch for reference.
The mount base, located at the bottom of the system, has four ports for mounting bolts that are designed to mount the assembly within the system enclosure (not shown). The main holder (Fig. 5(a)) is screwed into the mount base in order to allow for height adjustment of the microscope slide port. The illumination system is mounted beneath the microscope slide port and is comprised of the LED and the catadioptric reflector. A 5mm thick round aluminum disk, placed in contact with bottom part of the LED, serves as a heat sink. The illumination assembly is fixed by threaded 3D printed locking ring marked in Fig. 5(a). Samples are inserted through microscope slide port. The sample chamber has 3D printed springs, depicted in Fig. 5(b), that provide downward pushing force. The force effectively fixes the distance between the sample and the microscope optics.
The WBC optical system is mounted within the holder depicted in Fig. 5(c). Both objectives that comprise optical assembly are mounted within brass tube that is subsequently inserted into objective enclosure. The aperture stop is made of laser cut black construction paper and is mounted within a diamond cut recess in brass spacer. Front and retaining cups are threaded and when locked provide an axial clamping force that fixes the position of both lenses within the objective assembly. The WBC objective is screwed into the main holder using a custom 3D printed thread (1 mm pitch, 0.87 mm thread tooth height) and its position is adjusted in reference to the sample at the assembly stage. Thread printing dimensions were adjusted to provide tight fit between the objective enclosure and sample holder in order to immobilize optical assembly. The emission filter (BLP-1-532R-25, Semrock, USA) is mounted using a locking ring within custom 3D printed camera interface module, located directly above the optical assembly. The 3D printed camera interface module has an integrated C-mount thread that is used to fix a Flea3 (Point Grey Research Inc., Canada) image detector. The position of the camera is controlled by 3D printed custom threaded connection (1 mm pitch and 0.87 mm thread tooth height) between camera interface and main holder. The position of the camera module is locked in respect to main module using commercially available worm-drive clamp tightened around external surface of the camera interface module. Figure 5(d) shows a photograph of the assembled 3D printed system.
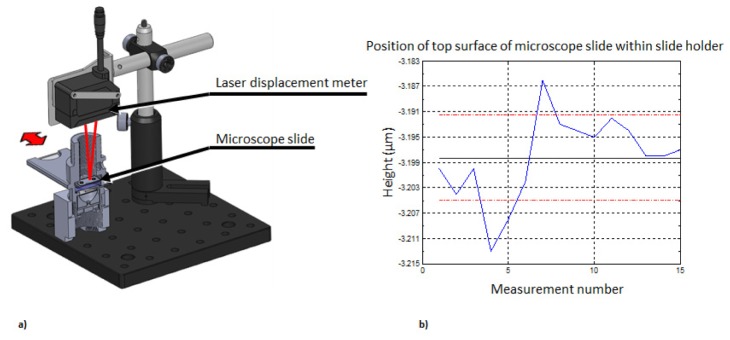
The optical system of the WBC microscope has object side NA = 0.35. For the shorter design wavelength of 525 nm the depth of field of the optical system is 6 μm. Consequently, the sample must be placed 1.3 mm (nominal working distance) beneath the microscope objective with ± 3 μm tolerance in order to acquire focused images of fluorescently stained white blood cells. Repeatability of the insertion of a sample microscope slide in 3D printed enclosure is tested in an experimental system depicted in Fig. 6(a). A laser-based displacement meter (IL-030, Keyence Corp, Osaka, Japan) is used to measure distance between micrometer and top/proximal surface of cover slip glass that encapsulates sample chamber. The laser displacement meter is set to acquire data with relative speed of 2 and a moving average window width to 4096 samples to avoid random fluctuation of indicated distance. A sample microscope slide is inserted into the measurement chamber fifteen times, each time removing it completely from the sample slit. The measured distance between the laser displacement meter and cover slip mounted on top of the microscope slide is graphically presented in Fig. 6(b). Mean height is measured to be −3.198 mm and standard deviation is σ = 0.007 mm. Displacement measurements were also performed between ten different cartridges by recording the distance between the micrometer and the top surface of the cover slide. The measured height variation between ten different cartridges had a standard deviation of σ = 0.009 mm.
Fig. 6.
(a) Schematic of measurement system used to evaluate sample insertion repeatability. (b) Slide insertion repeatability test: blue line – measured distance, black line – mean distance, red lines – ± 1σ standard deviation boarder lines.
The measured deviation of position of the sample relative to fixed position of the optical system is nearly twice larger than depth of field of the optical system. Optical system depth of field is inversely proportional to NA2, and its throughput is directly proportional to NA2. Reducing the system’s numerical aperture results in a larger depth of field, but at the expense of lowering the system’s light collection efficiency. Subsequently, optical systems with reduced NA suffer from a lower Signal to Noise Ratio (SNR), due to inherent statistical properties of light acquisition with solid-state detectors, if image acquisition time is not increased. Since fluorescently stained white blood cells fluoresce weakly (due to limited quantum efficiency of the acridine orange dye and inherent low efficiency of fluorescent process), we decided to sacrifice image quality to reduce data acquisition time necessary to record images with sufficient signal to noise ratio.
2.4 Cost analysis
Cost burden in relation to point-of-care instrumentation is two-fold, and depends on the one-time cost of the instrumentation as well as the cost of associated consumables, such as cuvettes. For example, the HemoCue WBC DIFF analyzer, marketed as a point-of-care reader, retails for approximately $1300, but the per-test cost (per-cuvette) is $3.59. An ideal per-test cost for a low resource setting is well below the $1.00 mark [25]. By using a basic slide and coverglass as the sample chamber as well as small quantities (20 microliters) of acridine orange, the per test cost estimate for our device comes to less than $0.50 for low volume production and less than $0.01 for high volume quantities (the sum of the cost of a glass slide and acridine orange in microliter quantities).
The cost of fabricating the custom optics can be analyzed based upon the assumption of low, mid and high-volume production [26].The spacer and housing material for an objective is made from standard hypodermic tubing cut to length using a diamond saw. The total cost of each objective assembly, including housing, spacer, and lenses is estimated to be $20 / objective for volumes above ten thousand units.
For prototype quantities (<50 units), the use of diamond turning can produce lenses two orders of magnitude more costly than injection molding, but without the initial investment of designing molds for the lenses. At higher volume production quantities (≥10,000), the use of injection molding becomes more beneficial, significantly decreasing the costs of the objectives.
The miniature optics interface with a variety of electronic and opto-electronic components. The Luxeon high power LEDs diode (SR-01-B0040, Quadica Developments Inc., Ontario, Canada) are priced in retail at approximately $8.86 if bought in quantities below 10 units, dropping to $0.50 at quantities greater than 1,000. The system is controlled by a $20 microcontroller (Arduino, Italy), a $200 board-level computer (JNP93-2930, Jetway, USA), and $60 solid state drive (SSD) (SV300S37A/120G, Kingston, USA). A cost breakdown of the optics, electronics, and housing for low-volume production is shown in Table 6, below.
Table 6. Cost of complete optical detection hardware for prototype device and conservative cost estimate for mass production.
| Component | Cost / part for Prototype: |
Estimated cost / for part Volume:~10,000 units |
|---|---|---|
| LED light source | Luxeon Rebel LED $8.86 | ~$6.20 |
| Power supply (5V, 12 A) | $15 | ~$10 (power supply) |
| Image Sensor | Color CMOS (FL3-U3-88S2C-C, Pointgrey, USA) $895 |
~$515 (depending on bit depth & sensor size). Cost includes design and manufacturing. If off the shelf, can be significantly lower. |
| Housing/Optomechanics | $500 (3D printed) | ~$2.00 |
| Optical System | $500 (labor, diamond turning) $250/filter (1Semrock excitation fitler and 1 Semrock emission filter) |
~$20 (lenses, housing, spacers) ~10 (filters) |
| Control Unit | $280 (microcontroller, computer, SSD) | ~$50 |
| Approx. $2699 | Approx. $613 |
Table 6 illustrates that in production of volumes on the order of 10,000, the device may be manufactured for roughly half the price of commercially available point of care readers such as the HemoCue WBC Diff. Additionally, our per-test cost estimate (<$0.50 in low volume quantities and <$0.01 in high volume production) reduces the cost burden compared to the commercially available HemoCue WBC Diff, which has a per test cost of $3.52. The reduction in the per-test cost coupled with the reduction in device cost is important for use in low-resource environments.
2.5 Image acquisition
Preliminary samples of white blood cells in whole blood stained with acridine orange were imaged with the miniature microscope and on the miniature microscope within ten minutes of sample preparation. All images acquired with the miniature microscope were captured using Pointgrey FlyCap Software (Pointgrey Inc., Canada). The high-power LED is driven by a constant current LED driver (Product ID: 03021-D-E-700, BuckPuck, LEDdynamics, USA). Power was measured in an area that matched the optical power meter detector diameter (Model 130C, Newport, USA). The illumination system consists of a 470 nm LED (SR-01-B0040, Quadica Developments Inc., Ontario, Canada) mounted within a catadioptric reflector (Fraen 9°, Quadica Developments Inc., Ontario, Canada) and excitation filter (FF01-470/28-25, Semrock, USA). The power measured at the sample plane was 23.1 mW/cm2 at 470 nm. A typical image (FOV = 1.13 mm2) acquired at a gain of 1 and an exposure time of 400 ms is shown in Fig. 7. There must be a minimum of 100 cells in a field of view to get statistically meaningful differential data. The relatively large (1.2 mm) field of view of our microscope is intended to visualize at least 200 cells in a general patient population assuming a Poisson distribution the coefficient of variation will be 2001/2 or ~14 cells [27].
Fig. 7.
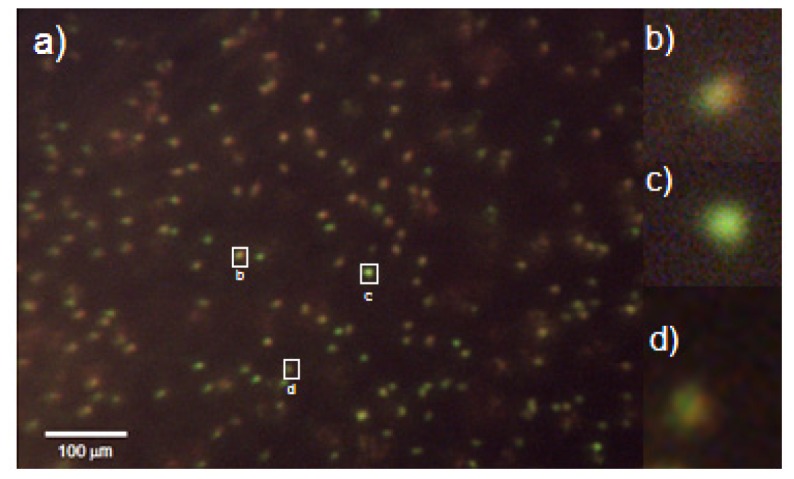
(a) Image of acridine orange taken at 400 ms exposure stained white blood cells in whole blood. Image acquired with the miniature all-plastic objective. (b) Magnified image of granulocyte. (c) Magnified image of a lymphocyte. (d) Magnified image of a monocyte. Contrast has been enhanced for presentation purposes. Red-to-green ratios were calculated using raw data.
Some of the WBCs visible in example image depicted in Fig. 7 are out of focus. This is due to combined effect of manufacturing limitations of the microscope sample holder and sample slide. Additionally, note that the depth of field of our system is limited by the NA of the system to 6µm and is smaller than the depth of the sample chamber. The un-sharp images of WBCs do not affect WBC count and differential as long as images of individual cells do not overlap, because we do not perform any morphological analysis of the cellular structure, we are only interested in relative fluorescence between two mutually separated channels. Figure 7(b) depicts a typical image of a granulocyte. The red-to-green ratio of this granulocyte is 0.993. Figure 7(c) shows a typical image of a lymphocyte. The red-to-green ratio of this cell is 0.595. By recording each cell’s red-to-green ratio, we see two distinct groups of cells and we are able to classify the white blood cells into lymphocytes (lowest red-to-green ratios) or granulocytes (highest red-to-green ratios). Monocytes (cells with red-to-green ratios that fall in the middle of the other two groups) are the most difficult to identify via visual inspection. A magnified image of a monocyte is shown in Fig. 7(d). The red-to-green ratio of this monocyte is 0.741. Future work will entail developing an automated algorithm to identify and quantify these three cell types.
We have performed analysis of a single venous sample artificially manipulated to achieve 11 independent samples with WBC counts ranging from 4200 to 8400 WBC/uL. Each sample was measured and analyzed in triplicate and compared to the Beckman Coulter AcT Diff2 hematology analyzer. Figure 8 shows the cumulative percentage of samples falling within a certain deviation from the gold standard value. It can be seen that all samples fall within ± 20% of the WBC count as determined by the AcT Diff2 hematology analyzer. Further, 72.7% of the samples fell within ± 15% of the true WBC count and therefore meet the requirements for CLIA (Clinical Laboratory Improvement Amendments) waived devices.
Fig. 8.
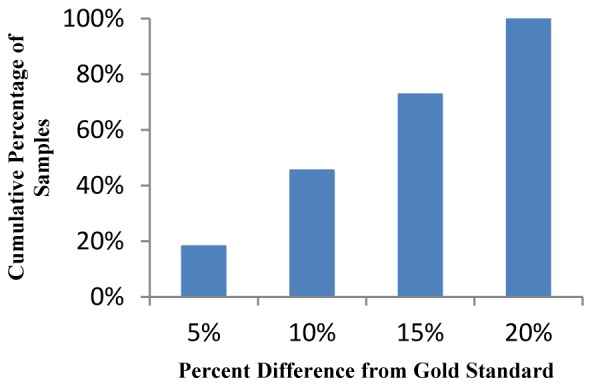
Cumulative percentage of samples falling within percent difference from gold standard measurement on AcT Diff2 hematology analyzer.
Discrepancies in differential data can be attributed to the early stage algorithm we are using. Overall, however, because all samples fell within ± 20% of the WBC count as determined by the AcT Diff2 hematology analyzer and 72.7% met CLIA requirements, we believe that further development of the processing algorithm will lead to differential counts and variations comparable to those of the AcTDiff 2.
3. Conclusions
We developed a prototype of a miniature all-plastic achromatic microscope to identify monocytes, lymphocytes, and granulocytes based on the ratio of red to green intensity within each cell. The microscope was successfully able to capture images of white blood cells in whole blood stained with acridine orange. Also, 72.7% of the samples fell within ± 15% of the true WBC count, therefore meeting the requirements for CLIA waived devices. The microscope housing and objective were fabricated using the rapid prototyping techniques of 3D printing and single point diamond turning, respectively. The all plastic microscope is intended for use in the field for point-of-care applications and requires no manual adjustment of the optics. We were able to reach micrometric level of mechanical repeatability in an optomechanical system that was exclusively 3D printed using UV curable epoxy. We achieved this goal by including 3D printed plastic springs into the sample chamber and incorporating into the mechanical design manufacturing tolerances characteristic for our 3D printer. The use of low cost components such as LEDs, reflectors, and USB detectors, combined with the all-plastic housing and lenses will allow for future versions of the prototype to be mass-produced. Future work will entail developing an automated algorithm for WBC identification and comparing our differential counts to those obtained using commercially available benchtop hematology analyzers.
Acknowledgments
Funded by a grant from the Bill & Melinda Gates Foundation through the Grand Challenges in Global Health initiative.
References and links
- 1.Buttarello M., Plebani M., “Automated blood cell counts: state of the art,” Am. J. Clin. Pathol. 130(1), 104–116 (2008). 10.1309/EK3C7CTDKNVPXVTN [DOI] [PubMed] [Google Scholar]
- 2.Osei-Bimpong A., Jury C., McLean R., Lewis S. M., “Point-of-care method for total white cell count: an evaluation of the HemoCue WBC device,” Int. J. Lab. Hematol. 31(6), 657–664 (2009). 10.1111/j.1751-553X.2008.01093.x [DOI] [PMC free article] [PubMed] [Google Scholar]
- 3.Shi W., Guo L., Kasdan H., Tai Y. C., “Four-part leukocyte differential count based on sheathless microflow cytometer and fluorescent dye assay,” Lab Chip 13(7), 1257–1265 (2013). 10.1039/c3lc41059e [DOI] [PubMed] [Google Scholar]
- 4.Charache S., Nelson L., Keyser E., Metzger P., “A Clinical Trial of Three-Part Electronic Differential White Blood Cell Counts,” Arch. Intern. Med. 145(10), 1852–1855 (1985). 10.1001/archinte.1985.00360100114019 [DOI] [PubMed] [Google Scholar]
- 5.Blumenreich M. S., Clinical Methods: The History, Physical, and Laboratory Examinations (Butterworths, 1990). [PubMed] [Google Scholar]
- 6.Vercruysse D., Dusa A., Stahl R., Vanmeerbeeck G., de Wijs K., Liu C., Prodanov D., Peumans P., Lagae L., “Three-part differential of unlabeled leukocytes with a compact lens-free imaging flow cytometer,” Lab Chip 15(4), 1123–1132 (2015). 10.1039/C4LC01131G [DOI] [PubMed] [Google Scholar]
- 7.Briggs C., Kimber S., Green L., “Where are we at with point-of-care testing in haematology?” Br. J. Haematol. 158(6), 679–690 (2012). 10.1111/j.1365-2141.2012.09207.x [DOI] [PubMed] [Google Scholar]
- 8.Casey J. R., Pichichero M. E., “A comparison of 2 white blood cell count devices to aid judicious antibiotic prescribing,” Clin. Pediatr. (Phila.) 48(3), 291–294 (2008). 10.1177/0009922808327106 [DOI] [PubMed] [Google Scholar]
- 9.Leguit R. J., van den Tweel J. G., “The pathology of Bone marrow failure,” Histopathology 57(5), 655–670 (2010). 10.1111/j.1365-2559.2010.03612.x [DOI] [PubMed] [Google Scholar]
- 10.Estridge B. H., Reynolds A. P., Walters N. J., Basic Haematology (Delmar-Thompson Learning, 2000). [Google Scholar]
- 11.Paladino L., Subramanian R. A., Bonilla E., Sinert R. H., “Leukocytosis as prognostic indicator of major injury,” West. J. Emerg. Med. 11(5), 450–455 (2010). [PMC free article] [PubMed] [Google Scholar]
- 12.Houwen B., “The differential cell count,” Lab. Hematol. 7, 89–100 (2001). [Google Scholar]
- 13.Zheng M., Lin J. C., Kasdan H., Tai Y., “Fluorescent labeling, sensing, and differentiation of leukocytes from undiluted whole blood samples,” Sens. Actuators B Chem. 132(2), 558–567 (2008). 10.1016/j.snb.2007.11.031 [DOI] [Google Scholar]
- 14.Smith Z. J., Gao T., Chu K., Lane S. M., Matthews D. L., Dwyre D. M., Hood J., Tatsukawa K., Heifetz L., Wachsmann-Hogiu S., “Single-step preparation and image-based counting of minute volumes of human blood,” Lab Chip 14(16), 3029–3036 (2014). 10.1039/C4LC00567H [DOI] [PubMed] [Google Scholar]
- 15.Hare J. D., Bahler D. W., “Analysis of Plasmodium falciparum growth in culture using acridine orange and flow cytometry,” J. Histochem. Cytochem. 34(2), 215–220 (1986). 10.1177/34.2.2418101 [DOI] [PubMed] [Google Scholar]
- 16.Vink J. P., Laubscher M., Vlutters R., Silamut K., Maude R. J., Hasan M. U., DE Haan G., “An automatic vision-based malaria diagnosis system,” J. Microsc. 250(3), 166–178 (2013). 10.1111/jmi.12032 [DOI] [PubMed] [Google Scholar]
- 17.Horning M. P., Delahunt C. B., Singh S. R., Garing S. H., Nichols K. P., “A paper microfluidic cartridge for automated staining of malaria parasites with an optically transparent microscopy window,” Lab Chip 14(12), 2040–2046 (2014). 10.1039/c4lc00293h [DOI] [PubMed] [Google Scholar]
- 18.Keiser J., Utzinger J., Premji Z., Yamagata Y., Singer B. H., “Acridine Orange for malaria diagnosis: its diagnostic performance, its promotion and implementation in Tanzania, and the implications for malaria control,” Ann. Trop. Med. Parasitol. 96(7), 643–654 (2002). 10.1179/000349802125001834 [DOI] [PubMed] [Google Scholar]
- 19.Ekberg B. A., Larsen U. D., Andersen N. F., “A real point-of-care system for complete blood counting,” Point Care 4(1), 64–65 (2005). 10.1097/01.poc.0000157179.68080.1d [DOI] [Google Scholar]
- 20.Rao L. V., Ekberg B. A., Connor D., Jakubiak F., Vallaro G. M., Snyder M., “Evaluation of a new point of care automated complete blood count (CBC) analyzer in various clinical settings,” Clin. Chim. Acta 389(1-2), 120–125 (2008). 10.1016/j.cca.2007.12.006 [DOI] [PubMed] [Google Scholar]
- 21.Kyrish M., Utzinger U., Descour M. R., Baggett B. K., Tkaczyk T. S., “Ultra-slim plastic endomicroscope objective for non-linear microscopy,” Opt. Express 19(8), 7603–7615 (2011). 10.1364/OE.19.007603 [DOI] [PMC free article] [PubMed] [Google Scholar]
- 22.Baumer S., Handbook of Plastic Optics, 2nd ed. (Wiley-VCH, 2005). [Google Scholar]
- 23.Kobayashi A., Hirakawa K., “Ultraprecision machining of plastics. Par 1 Polymethylmethacrylate,” Polym. Plast. Technol. Eng. 22(1), 15–25 (1984). 10.1080/03602558408070029 [DOI] [Google Scholar]
- 24.Majors C. E., Pawlowski M. E., Tkaczyk T., Richards-Kortum R. R., “Low - Cost Disposable Cartridge for Performing a White Blood Cell Count and Partial Differential at the Point - of - Care,” in Health Innovations and Point-of-Care Technologies Conference, Seattle, WA, 2014, pp. 10–13. 10.1109/HIC.2014.7038862 [DOI] [PMC free article] [PubMed] [Google Scholar]
- 25.Wu G., Zaman M. H., “Low-cost tools for diagnosing and monitoring HIV infection in low-resource settings,” Bull. World Health Organ. 90(12), 914–920 (2012). 10.2471/BLT.12.102780 [DOI] [PMC free article] [PubMed] [Google Scholar]
- 26.Pierce M. C., Weigum S. E., Jaslove J. M., Richards-Kortum R., Tkaczyk T. S., “Optical systems for point-of-care diagnostic instrumentation: analysis of imaging performance and cost,” Ann. Biomed. Eng. 42(1), 231–240 (2014). 10.1007/s10439-013-0918-z [DOI] [PMC free article] [PubMed] [Google Scholar]
- 27.Shapiro H. M., “Cellular astronomy--a foreseeable future in cytometry,” Cytometry A 60(2), 115–124 (2004). 10.1002/cyto.a.20067 [DOI] [PubMed] [Google Scholar]


