Abstract
Real-time imaging of human brain has become an important technique within neuroimaging. In this study, a fast and efficient sensitivity map generation based on Finite Element Models (FEM) is developed which utilises a reduced sensitivitys matrix taking advantage of sparsity and parallelisation processes. Time and memory efficiency of these processes are evaluated and compared with conventional method showing that for a range of mesh densities from 50000 to 320000 nodes, the required memory is reduced over tenfold and computational time fourfold allowing for near real-time image recovery.
OCIS codes: (110.6960) Tomography, (170.2655) Functional monitoring and imaging, (170.3010) Image reconstruction techniques, (170.3660) Light propagation in tissues
1. Introduction
Real-time brain imaging of human brain is an important technique within neuroimaging which has been used in the study of brain activation during interactive tasks [1, 2], analysis of networks between different functional brain regions during complex movements and emotions [3–6], and monitoring whole brain state for spontaneous activation such as sleep, and changes between tiredness and alertness [7]. It provides the possibility of observing brain processes during physical and mental experience, guiding medical and behavioural therapies and assisting the rehabilitation of some disorders and diseases such as depression, schizophrenia, and stroke [8–10]. Since immediate feedback is available during the imaging process, some brain–computer interfacing (BCI) systems are designed based on real time brain imaging [4, 11–13]. The BCI systems analyse brain activity data and react to the findings in real-time. It is an alternative communication and environment control tool for disabled patients.
Electroencephalography (EEG) and Near-Infrared Spectroscopy (NIRS) are the most commonly used real-time brain imaging techniques. They have been used to track and classify brain activities during complex motor tasks, such as alternating bilateral self-paced finger tapping task; monitoring brain activation during different stages of sleep [4]; and develop BCI environmental control systems [11, 12]. However, EEG and NIRS lack spatial information, and have limitations on the region-based analysis. Real-time functional MRI (fMRI) is a 3D brain imaging technique which has been used to observe the self-regulation of activity in circumscribed regions and emotion networks, and has also been used to analyse the neuro-feedback of treatment for patients with attention deficit and hyperactivity disorder (ADHD) [5, 13–17]. However, MRI is not suitable for patients with electronic implants such as pacemaker and has some limitations for infants and patients with claustrophobia, the application of real-time fMRI is also limited.
Diffuse optical tomography (DOT) is a relatively new neuroimaging technique that monitors brain activities using measurements of transmitted and reflected near infrared light from the surface of the head. It is a low-cost, portable imaging system as compared to other brain imaging techniques and can be used for infants and hospitalised patients [18, 19]. The recovery of brain activity in DOT is divided into two main steps: the generation of the forward model and the inverse process for the recovery. Currently, the DOT recovery process for the whole head can take several hours becoming more computationally expensive as the size of the region of interest (domain) and number of source and detectors increases. Real-time DOT imaging therefore relies on the reduction of processing time and previous studies of fast DOT recovery have been largely focused on the inverse process. The reduction of recovered parameter density based on a coarse reconstruction basis and adaptive meshing algorithms have been shown to increase the time-efficiency for the recovery process [20–23]. A sensitivity matrix reduction method (where the sensitivity matrix is defined as the sensitivity of the NIR measurement data to small changes in optical properties) for the inverse process has also been used to reduce the processing time [24]. Since the inverse problem is highly under-determined, gradient-based optimisation schemes and modified singular value decomposition are also used to increase the efficiency in inverse processing [25–28]. Parallelisation is one of the most common time reduction methods with efficient DOT recovery with both CPU and GPU based parallelisation were analysed previously [29–32] highlighting their advantage providing a systematic method of their incorporation is utilised. Although most previous studies are focused on reducing the calculation time of the inverse process, the generation of the forward model and its associated sensitivity matrix for parameter recovery are also worth investigating.
This study is focused on a unique and efficient generation of the sensitivity matrix using the finite element model for image reconstruction (inverse model) of a complicated inhomogeneous model such as the human brain with the high-density diffuse optical tomography (HD-DOT) system. Two efficient generation processes are developed and evaluated based on a reduced sensitivity matrix and the parallelisation of the calculation process. Time and memory efficiency of these novel efficient generation processes are evaluated based on comparison with the conventional generation process.
2. Methods
2.1 Sensitivity matrix
Model-based image reconstruction in DOT relies on the use of a model, typically a numerical model based on the finite element model (FEM) to simulate the NIR light propagation within a medium. The volumetric mesh generation of a FEM of the human head, either subject specific or atlas-based has been discussed in detail elsewhere [33, 34] and are shown to be achievable on a relatively fast (typically minutes) time-scale. Through the use of a HD-DOT system for the imaging of the whole surface of the cortex, typically FEM with meshes containing over 300,000 nodes are needed to capture, in sufficient detail, the geometry and internal structures of the head. Additionally, our current whole-head clinical system contains ~3500 source/detector pairs for each wavelength (750 and 850 nm) of operation which using conventional techniques (discussed below) are very computationally expensive, as maps of brain activations are derived through the direct calculation and inversion of a wavelength dependant sensitivity matrix [35].
The sensitivity matrix, also known as the Jacobian or weight matrix, contains a set of sensitivity values which are defined as the sensitivity of NIR boundary data of each measurement to a small change in optical property of each mesh node.
The sensitivity of NIR boundary data to the optical property can thus be represented as:
| (1) |
where is the changes in tissue property, is the resulting change in boundary data, and J is the sensitivity matrix. A continuous wave (CW) DOT system with single wavelength is used in this study and the sensitivity matrix is focused on changes in the absorption coefficient based only on intensity measurements:
| (2) |
where lnI is the log amplitude of boundary data, is the absorption property at a given wavelength, NN is the number of nodes in the FEM mesh and NM is the number of measurement. Since DOT is a highly under-determined and ill-posed problem (NN >> NM), the image recovery step can be defined as:
| (3) |
where
is the Tikhonov regularisation parameter, β is the spatial regularisation factor, with , where diag() is either a vector containing the diagonal values of matrix or a diagonal matrix created from a vector, and I is and identity matrix [35–37].
The Jacobian is formed using the Adjoint method [38], which takes advantage of reciprocity to construct the matrix entries from the forward model fluence calculations, and is highly efficient as compared to perturbation methods [39]. Using this approach and assuming a Continuous Wave (CW) system with a given FEM mesh, the Sensitivity for intensity measurements due to absorption for each node can be calculated based all its adjacent connecting nodes. For a given source (i) and detector (j) pair, the sensitivity value at a node (r) is calculated based on the fluence in the adjacent node (k) due to source i, the corresponding Adjoint fluence in the adjacent node (k) due to detector j, and the associated finite element basis (shape) function for the node (r) and the adjacent node (k). The Sensitivity can be calculated as [38]:
| (4) |
where is the fluence due to source i at nodes k of an element τ associated with a mesh node r and is the corresponding Adjoint fluence due to detector j with uk being the associated finite element basis (shape) function. If the forward solution is obtained on a regular voxel grid, where all the FEM nodal spacing is equal and the FEM elements area/volume are also constant, this expression can be simplified to the multiplication of the two fluence values for the node (r):
| (5) |
However, for a FEM mesh consisting of non-uniform element size and basis functions, this calculation cannot be simplified and the summation as outlined in Eq. (4) must be calculated for all nodal sensitivity values taking into account the finite element basis function for each node; a computationally time consuming task, as it will involve repeated summation and multiplication for each FEM nodal sensitivity calculation. Nonetheless, this simplification (Eq. (5)) can be utilized to provide an approximation of the sensitivity values to allow the determination of an effective Region of Interest (ROI) for image reconstruction, as it only involves a point by point multiplication for each nodal value calculations.
Previous studies have shown that only nodes within the region being imaged, which have sensitivity values higher than 1% of the maximum absolute value can affect the DOT recovery [22]. Based on this criterion, it is therefore possible to use the approximation (Eq. (5)) to provide the ‘effective’ ROI for which the more accurate sensitivity matrix can be calculated (Eq. (4)) for only the required ROI, therefore dramatically reducing the computational burden. This assumption can be used when the FEM mesh resolution and element area are such that the created mesh is near-uniform in element size, which is the case in our models using our meshing algorithms outlined elsewhere [34].
Consider, for example a single source/detector pair on a full head model (optical properties shown in Table 1 [40]) and the associated sensitivity matrix calculated using both Eqs. (4) and (5), referred to as ‘Original’ and ‘Approximated’ matrices respectively, Fig. 1. For each sensitivity distribution, contour plots of relative magnitude based on maximum absolute magnitudes ranging from 10 – 0.0001% is shown. As evident, the discrepancies between the two sensitivity matrices are largest for the higher threshold of 10% and smallest for the lower threshold of 0.0001%.
Table 1. Head tissue optical properties at 750 nm.
| µa (mm-1) / µ’s (mm-1) / Refractive Index | |
|---|---|
| Scalp | 0.0170 / 0.74 / 1.33 |
| Skull | 0.0116 / 0.94 / 1.33 |
| Cerebrospinal fluid (CSF) | 0.004 / 0.3 / 1.33 |
| Gray Matter | 0.0180 / 0.84 / 1.33 |
| White Matter | 0.0167 / 1.19 / 1.33 |
Fig. 1.
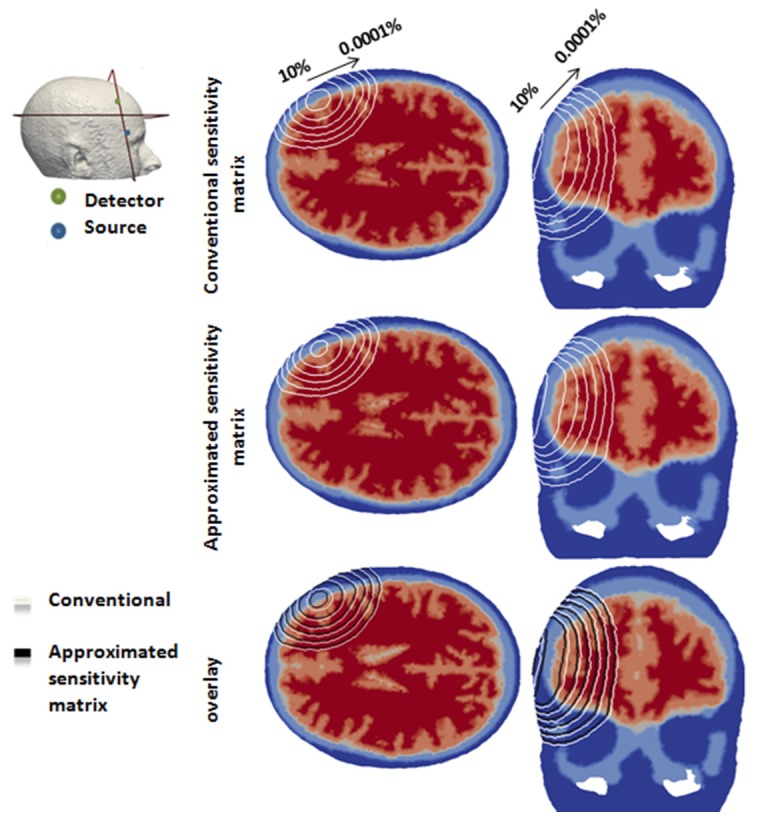
An example of the sensitivity calculated for a given source/detector pair on a full head model using conventional and approximated method. Each contour line represents 10 – 0.0001% of the maximum absolute sensitivity value.
2.2 Efficient sensitivity matrix
In order to calculate the sensitivity matrix in an efficient framework, without loss of information while reducing the computational burden, the efficient sensitivity matrix calculation can be summarised using the following steps:
-
1.
For all source/detectors, calculate the fluence (the so called direct and adjoint fields)
-
2.
For all source/detector pairs, calculate the sensitivity values for all nodes using Eq. (5). Note that this is computationally efficient, given that it is a simple point by point multiplication.
-
3.
Determine common nodes within the ROI for all source/detector pairs, within the FEM mesh that have a sensitivity above a chosen threshold value.
-
4.
Calculate the absolute sensitivity value for all nodes within the ROI using Eq. (4).
It is important to point out however, that although using this method, only a portion of the Sensitivity matrix is calculated, which will be shown to be the only effective region for this application of HD-DOT, it still requires the full head fluence calculations due to the complex light propagation in scattering tissue.
2.3 Sparse representation
Using the scheme outlined above and given that the majority of nodes within the FEM mesh will have zero contribution to the sensitivity matrix, one further advantage can be taken for the storage of this otherwise large matrix, using ‘sparse matrix’ representation. Given that only a certain portion of the FEM mesh nodes will have a ‘sensitivity’ contribution for each source/detector pair, only such values need to be stored within the memory for the inverse problem, Eq. (3), where only the row/column index and value for each non-zero entry are stored, thus significantly reducing the memory requirements for an HD-DOT imaging set-up. Consider for example, a FEM head mesh containing ~300,000 nodes with ~3,500 measurement pairs. The sensitivity matrix, using conventional non-sparse representation, (Eq. (2)) will require 8.4 GBytes of RAM for storage where the sensitivity of all nodes within the FEM mesh are calculated and stored, regardless of their significant contribution to the source/detector pairs. However, using the approximation scheme outlined above, together with sparse representation, the same Sensitivity matrix can be stored using sparse representation, where only nodal values above a certain threshold are stored using only ~0.8 GBytes of RAM. Additionally, sparse matrices also have significant advantages in terms of computational efficiency. Unlike operations with full matrices, operations with sparse matrices do not perform unnecessary low-level arithmetic, such as zero-adds. The resulting efficiencies can lead to dramatic improvements in execution time for algorithms working with large amounts of sparse data.
2.4 Parallelisation in the sensitivity generation process
Parallelisation, which computes multiple processes simultaneously, is one of the most common methods to reduce the processing time. For example, a process paralleled with 10 Central processing units (CPU) is ten time faster than based on single CPU. The generation of the sensitivity matrix can also benefit from parallelisation. There are two main calculations within the forward model to which parallelisation can be applied to: (1) The calculation of light fields (direct and adjoint) is processed for each sources and detectors separately, therefore calculations for multiple sources and detectors can be run in parallel simultaneously and (2) The calculation of sensitivity matrix which itself is based on light fields (Eq. (5)) is also processed on a measurement pair basis and can hence also be parallelised.
Both the parallelisation and the reduction based on the ROI (using Eq. (5)) for the calculation of the sensitivity matrix can increase the efficiency of the calculation process. Therefore the two efficient calculation processes of the sensitivity matrix based on the two factors are: (1) The calculation of the reduced sensitivity matrix without parallelisation and (2) the calculation process of a reduced sensitivity matrix with parallelisation on sources and detectors for light fields and sensitivity values calculations. The accuracy and efficiency of these two efficient processes are evaluated and compared with the conventional sensitivity generation process.
2.5 Simulated study
2.5.1 Mesh resolution model accuracy
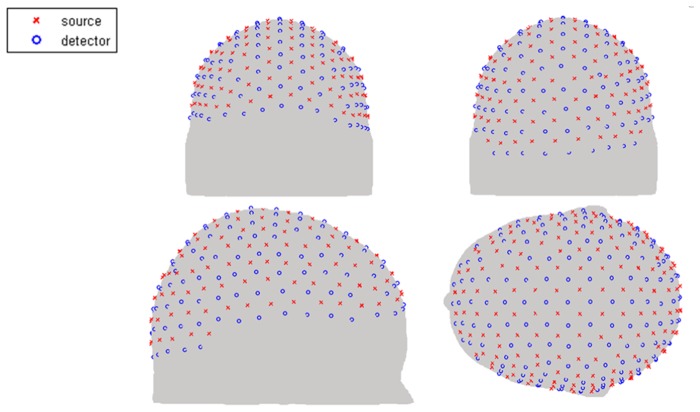
Throughout this work, we have utilised NIRFAST, an open source light propagation model and image reconstruction toolbox (www.nirfast.org), which utilised linear 3D tetrahedral elements based on the Diffusion Approximation [34, 41]. A feature of FEM based image reconstruction and light propagation models is that the accuracy of the fluence solution is a function of the chosen mesh resolution and the corresponding finite element basis function. In theory, the solution of FEM approaches the true solution as the area of each FEM elements nears zero; therefore for a given model, the mesh with highest nodal resolution should be more accurate. The problem of mesh resolution versus computational model then becomes two folds: for a complex multi-layered mesh, whereby fine structural features need to be represented a high density FEM mesh is required, but for fast computational models, a low density mesh is better suited. Numerical errors due to FEM mesh resolutions have previously been discussed together with algorithms which take into account such numerical model errors as unknown and recoverable parameters [42]. For the purpose of this work, and to highlight the need for high density meshes together with fast and efficient computational models, a multi-layered high density mesh with ~400000 nodes corresponding to ~2450000 linear tetrahedral elements is used as ground truth. Additionally, eight multi-layered FEM meshes with different node densities are generated based on the same subject containing a total of ~50000 to ~320000 nodes corresponding to ~290000 to ~1930000 linear tetrahedral elements. Each model contains 5 tissue regions (skin, skull, Cerebrospinal fluid (CSF), grey matter and white matter) with the optical properties for each tissue type assigned based on a single wavelength (750 nm) model, Table 1. A high-density (HD) source-detector cap is placed on the surface of each head mesh covering the entire cortex [Fig. 2] containing 158 sources and 166 detectors which are distributed uniformly across the source-detector cap. This gives rise to 3478 measurements, where the 1st to 4th nearest neighbour measurements corresponding to 1.0, 2.2, 3.0, and 3.6 cm source-detector distance respectively are used for the sensitivity matrix calculation [18]. The sensitivity matrices for each model using Eq. (4) are generated based on the same subject and compared to the high resolution (ground truth mesh) sensitivity matrix to calculate percentage accuracy on a nodal basis. The region of interest (ROI) for this evaluation is limited to the grey matter region only and the sensitivity values are mapped onto a high resolution uniform grid using linear interpolated functions for analysis.
Fig. 2.
High-density source and detector positions for the whole-head HD-DOT.
2.5.2 Threshold value
The calculation of the reduced sensitivity matrix is based on the chosen threshold for the effective ROI. A simulation experiment is designed for the determination and selection of a suitable threshold. A layered mesh with ~320000 nodes, corresponding to ~1930000 linear tetrahedral elements is generated based on an MRI scan of a subject head which contains 5 tissue regions (skin, skull, CSF, grey matter and white matter) with the optical properties for each tissue type assigned based on a single wavelength (750 nm) model [Table 1] As in previous case, a high-density (HD) source-detector cap is placed on the surface of the head mesh covering the entire cortex [Fig. 2] containing 158 sources and 166 detectors which are distributed uniformly across the source-detector cap giving 3478 measurement pairs.
The sensitivity matrix as outlined in Section 2.2 is calculated based on 5 different thresholds (10%, 1%, 0.1%, 0.01% and 0.001%) and is stored as a sparse matrix. The conventional full sensitivity matrix is also calculated to allow a direct comparison of accuracy which is determined as the percentage error between the new sensitivity matrix (outlined in section 2.2) and the conventional full sensitivity matrix.
2.5.3 Full-field imaging and parameter recovery
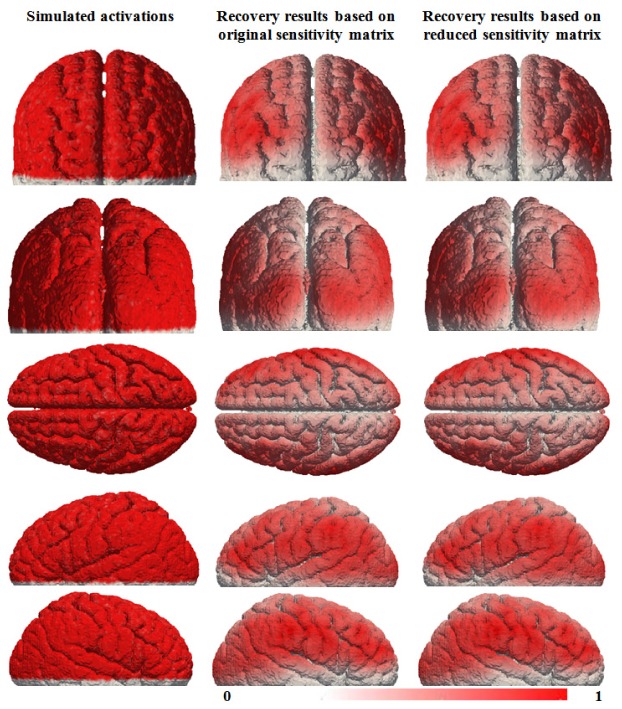
For the analysis of the recovery result based on the reduced sensitivity matrix, a simulation experiment is designed for the recovery of brain activity within the whole cortex. Whole cortex activation, which here is a simulated brain activation that models the same changes in optical coefficients throughout the entire cortex region, is simulated within the same subject mesh as the previous experiment. Boundary data are generated based on the same HD-DOT source-detector cap with noise added to simulate a clinical situation. The brain activation which is modelled as a unit change in optical property (∆y in Eq. (1) is reconstructed (using Eq. (3) based on either the original sensitivity matrix or the reduced sensitivity matrix with a threshold of 0.001%. The recovered results from the two sensitivity matrices, , are evaluated and compared.
2.5.4 Computational speed and memory requirements
The final simulation experiment is designed for the evaluation of the time and memory efficiency of the two efficient sensitivity generation processes outlined in section 2.4. Eight multi-layered FEM meshes with different node densities are generated based on the same subject. The eight meshes contain a total of ~50000 to ~320000 nodes corresponding to ~290000 to ~1930000 linear tetrahedral elements. The original and the reduced sensitivity matrices are generated for each mesh and the computational speed and memory requirements using each specific technique is calculated. All computational models are performed using MATLAB R2012b on a Workstation running 64 bit Linux (Ubuntu 12.04 LTS) with 16 GBytes RAM using 2 six-core AMS Opteron Processors at 800 MHz.
Memory efficiency of the sensitivity calculation processes as proposed, are evaluated based on the comparison of required memory of the reduced sparse sensitivity matrices and the original sensitivity matrices from the eight meshes. Time efficiency of the proposed sensitivity calculations are also evaluated based on the comparison of average processing times as compared to the conventional sensitivity generation process. For each mesh, all the sensitivity generation processes are performed five times, and the average processing time of each is calculated. Reductions in processing time and memory storage requirements are presented.
3. Result and discussions
Quantitative evaluation of the accuracy of the sensitivity matrix is analysed based on eight different resolution meshes generated from the same subject. The eight meshes each have a different density with the number of nodes varying from 50000 to 320000. The sensitivity matrix is generated for each mesh and used together with a reference sensitivity matrix as generated from a high-density mesh with ~400000 nodes based on the same subject. The accuracy of the sensitivity matrices for each of the eight meshes is evaluated based on the comparison with the reference sensitivity matrix, defined as:
| (6) |
where is error of the sensitivity matrix, is sensitivity matrix of the subject mesh and is the reference sensitivity matrix.
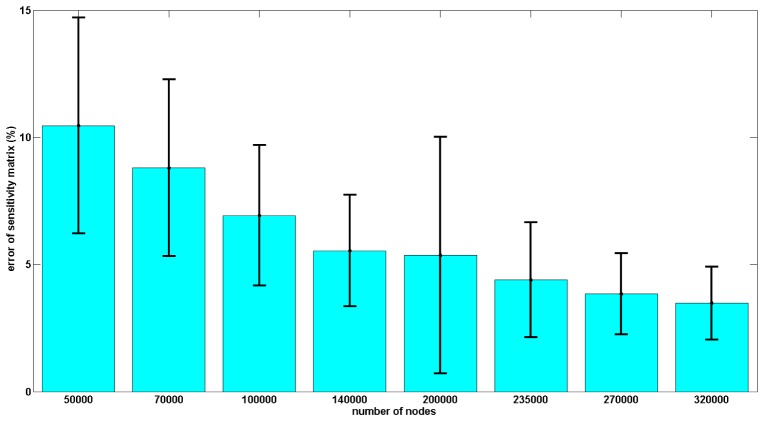
The ROI for this evaluation is defined as the grey matter region of the reference high-resolution sensitivity matrix. The nodal average sensitivity errors in ROI for the 8 meshes are shown in Fig. 3. The accuracy of the sensitivity matrix increases as the density of the nodes in the mesh increases. The sensitivity matrix based on mesh with 320000 nodes has the smallest sensitivity error (~4%) and the sensitivity matrix based on mesh with 50000 nodes has the largest sensitivity error (~10%). This highlights the need for the use of high resolution meshes for model-based HD-DOT and hence the requirement in improving the computational speed.
Fig. 3.
Accuracy of the sensitivity matrix as a function of FEM mesh nodal density with respect to ground truth (high density mesh). The accuracy is calculated on a node by node basis and error bars represent the variation across the whole model with the ROI.
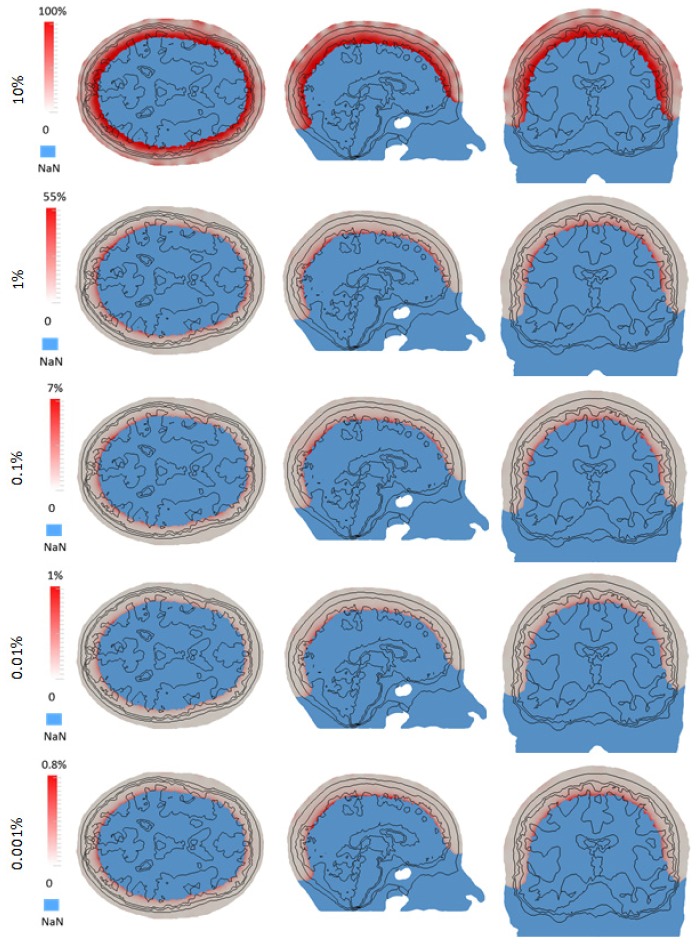
Calculation of the reduced sparse sensitivity matrix relies on the approximate sensitivity matrix (Eq. (5)) and the associated threshold value chosen to find the nodes within the ROI. The accuracy of this reduced and sparse sensitivity matrix is evaluated based on the HD source and detector cap with multiple measurements, as compared to the full conventional matrix for different threshold values. Five reduced and sparse sensitivity matrices based on different thresholds (10%, 1%, 0.1%, 0.01% and 0.001% of the maximum sensitivity value) and the original sensitivity matrix, are generated using the same mesh. The accuracy of the sensitivity matrices as a percentage error (on nodal basis) using different threshold are calculated with respect to the original matrix and shown in Fig. 4. For all five reduced sparse sensitivity matrices, deeper tissue such as the grey matter has higher sensitivity error than shallower tissue such as the skin. The maximum sensitivity error in the ROI decreases as the threshold for the reduced sensitivity matrix decreases. Reduced sensitivity matrix based on the 10% threshold has a 100% maximum sensitivity error in the ROI and reduced sparse sensitivity matrix based on 0.001% threshold has a 0.8% maximum sensitivity error. Note that, as shown in Fig. 1, the total sensitivity diminished as a function of depth and therefore all area deep within the head, where the total sensitivity due to all source/detector combinations was less than 1% of the absolute maximum sensitivity was not considered to be within the ROI and represented as ‘NaN’ for this analysis.
Fig. 4.
An example of sensitivity error for reduced sparse sensitivity matrices with different thresholds as compared to conventional full matrix.
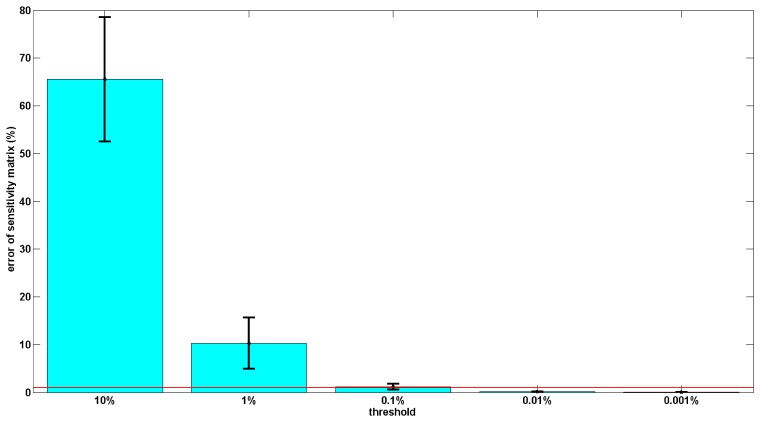
The average sensitivity errors of the 5 reduced sensitivity matrices for the grey matter within the ROI is shown in Fig. 5. The average sensitivity error within the ROI (effectively of the grey matter) decreases as the threshold chosen for the calculation of the reduced sparse sensitivity matrix decreases. The reduced sparse sensitivity matrix, based on 10% threshold, has ~65% average sensitivity error and is the least accurate sensitivity matrix. The most accurate of the five reduced sensitivity matrices is the reduced sensitivity matrix based on 0.001% threshold, which has ~0.02% sensitivity error. To ensure the sensitivity values in the entire effective region are accurate, a threshold of 0.001% of the maximum absolute sensitivity value is therefore used for the generation of reduced sensitivity matrix in this study.
Fig. 5.
Accuracy evaluation of the reduced sparse sensitivity matrices with different thresholds as compared to conventional full matrix. The red line represents the 1% sensitivity threshold.
For the evaluation of the recovery accuracy of the reduced sparse sensitivity matrix, whole cortex activation is simulated and recovered using both the proposed reduced sparse sensitivity matrix and the original sensitivity matrix. The normalized recovery results based on these two sensitivity matrices are shown in Fig. 6. Recovery results based on the original sensitivity matrix and reduced sensitivity matrix are visually the same, and they are located in the same region as the simulated activations demonstrating that the reduced sensitivity matrices can be an acceptable alternative for the original sensitivity matrices.
Fig. 6.
Recovery result of whole cortex.
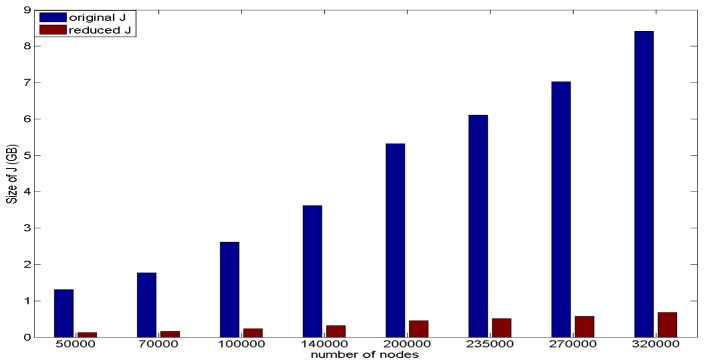
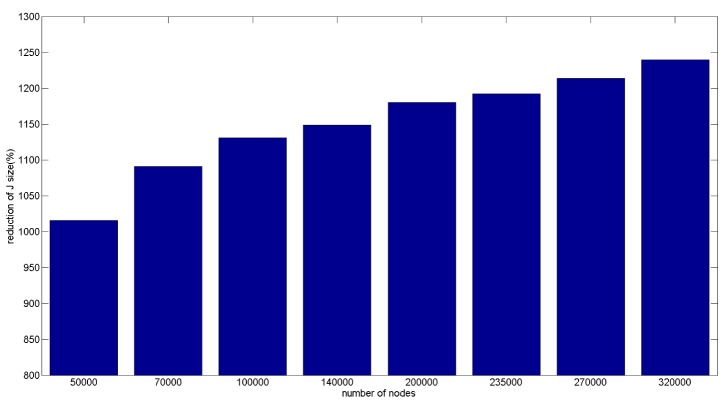
Memory efficiency of the proposed sparse sensitivity calculation is evaluated based on storage memory reduction of the reduced sparse sensitivity matrix as compared to the full conventional matrix. This is performed based on the reduced sparse sensitivity matrices from the eight different resolution meshes and the comparison with the original sensitivity matrix from the same corresponding mesh, shown in Fig. 7. For both sensitivity matrices, storage memory increases as the number of nodes in the mesh increases. The mesh with 320000 nodes has the largest RAM requirements for storage with the original sensitivity matrix requiring ~8.4 GBytes and the corresponding largest reduced sensitivity matrix requiring ~0.7 GBytes. The percentage memory reduction of the reduced sensitivity matrixes based on the eight meshes is shown in Fig. 8. The memory reductions of all eight meshes are over tenfold and with the reduction increasing as the number of nodes in the mesh increases. The reduced sensitivity matrix based on the mesh with 320000 nodes has the largest reduction factor amongst the eight meshes (~1240%) and the reduced sensitivity matrix based on mesh with 50000 nodes has the smallest reduction factor (~1020%). Therefore the reduced sensitivity matrix is more memory efficient compared to the original sensitivity matrix, based on the same mesh.
Fig. 7.
Size of the sensitivity matrix for 8 meshes.
Fig. 8.
Reduction of size of the sensitivity matrix for 8 meshes.
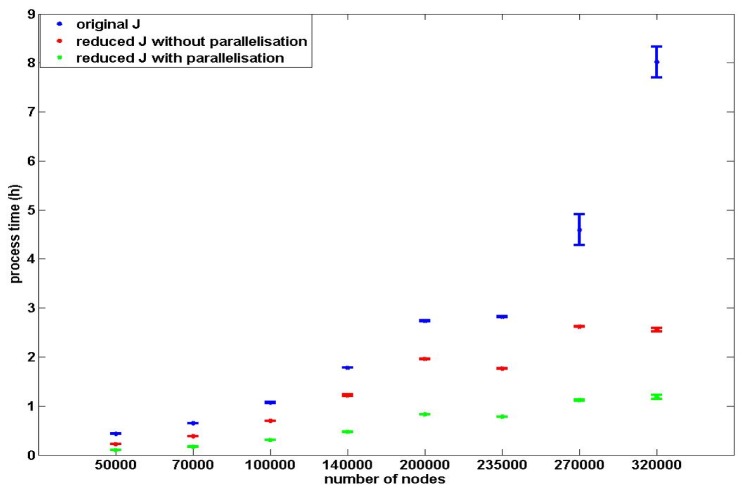
The reduced sensitivity matrix utilising parallelisation in the calculation process has also been investigated. The generation of the sensitivity matrix is divided into two steps: 1) generation of the light fields for all sources and detectors, and 2) calculation of the sensitivity matrix based on the light fields from the previous step. Parallelisation can be applied to both steps and the total computational processing time for both steps are evaluated separately based on the eight meshes outlined above. Using parallelisation for the generation of light field only, Fig. 9, the process time varies from <5 minutes to ~1.5 hours and tends to increase as the node density of the mesh increase and the utilization of parallelisation on generation of light filed has ~300% reduction on processing time for high density meshes. For the generation of the sensitivity matrix, once the light fields have been calculated, the processing time using conventional methods varies from <20 minutes to ~6 hours, Fig. 10, and it increases as the node density of the meshes increase. The calculation of reduced sparse sensitivity matrix has ~230% reduction on process time as compared to the conventional full matrix calculation and utilization of parallelisation on generation of sensitivity matrix provides additional ~200% reduction on processing time.
Fig. 9.
Processing time of the light field generation.
Fig. 10.
Processing time of the sensitivity matrix generation only from calculated light fields and the reduction based on parallelisation and reduced sensitivity matrix.
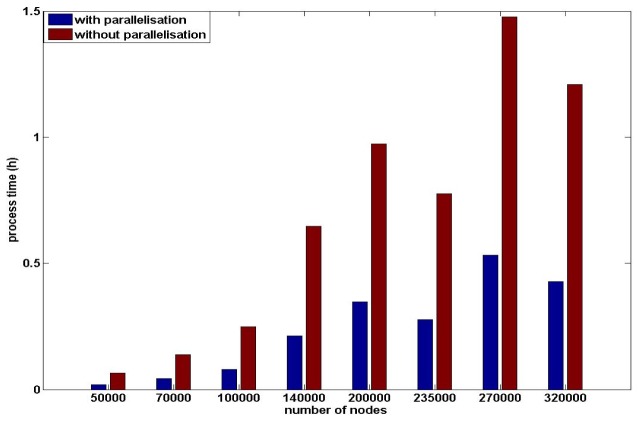
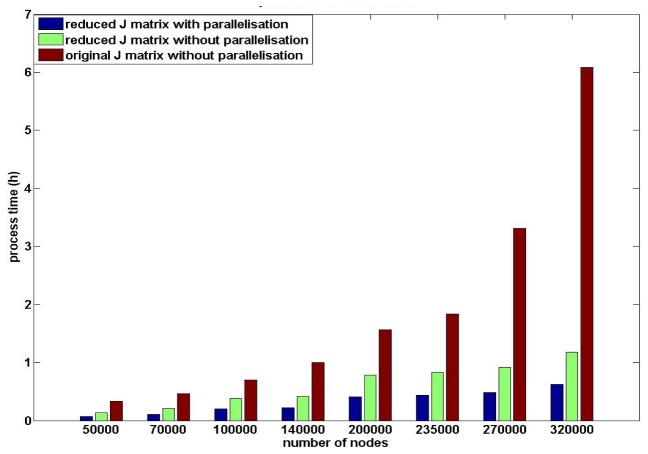
The utilisation of parallelisation for the field calculations, as well as sensitivity matrix calculation, together with application of the proposed reduced sparse calculations, are compared with conventional non-parallelised calculations, Fig. 11 to provide an overall whole model computational analysis. For each mesh density, the reduced sparse sensitivity calculations using both parallelisation or not, are more time efficient than the conventional generation process. For the same sensitivity matrix generation process, processing time increases as the node density of the mesh increases. Since the storage memory of the original sensitivity matrix using meshes with 270000 nodes and 320000 nodes are close to the hardware memory limitation of the machine, processing time of the original sensitivity matrices increased dramatically due to memory swap allocations. The mesh with 320000 nodes has the longest processing time for the conventional generation process (~470 minutes) and for the efficient proposed process with parallelisation is ~65 minutes. The mesh with 50000 nodes has the shortest process time for the conventional generation process (~30 minutes) and ~7 minutes using the proposed process.
Fig. 11.
Total processing time of sensitivity generation processes.
There isn’t a clear linear relationship between the reduction in processing time and the nodes density of the meshes. Except for the mesh with 270000 nodes and 320000 nodes, a 25 fold reduction of the processing time of each mesh (5 reduced sensitivity generation processes × 5 conventional generation processes) are similar for each sensitivity generation process. The models with 270000 and 320000 nodes with the sensitivity matrices larger than 7 GByte, which approach the memory limitation of the hardware (8 GBytes) during the conventional sensitivity generation process involve the swap memory in the calculation process, leading to a dramatic increase in processing time. However, it is well known that an increase in a number of parameters to be recovered (i.e. mesh resolution) the inverse problem becomes more ill-conditioned [24, 43–45], therefore there is a trade-off between recovery accuracy, mesh resolution and computation time. For all eight meshes, the efficient sensitivity generation process without parallelisation has ~170% reduction of process time and the efficient sensitivity generation process with parallelisation has ~400% reduction of process time. Therefore, the proposed sensitivity generation process with parallelisation is the most time efficient generation process.
4. Conclusion
Efficient sensitivity generation processes as outlined here rely on the reduced sparse sensitivity matrix representation and parallelisation in the generation process. One of the main steps in the generation of the reduced sensitivity matrix is the selection of the approximate efficient regions. Every node in the ROI should have a sensitivity value higher than the 1% of the maximum absolute sensitivity value and the approximated ROI should cover the entire efficient region as defined by this criteria, since any nodes with less than 1% contribution are not likely to contribute to parameter recovery. Approximate ROIs are selected based on threshold of an approximated and computationally fast sensitivity matrix (Eq. (5)), therefore the threshold value can affect the accuracy of the reduced sensitivity matrix. Based on evaluation results, accuracy of the reduced sparse sensitivity matrix increases as the threshold decreases. Compared to the original sensitivity matrix, the reduced sparse sensitivity matrix based on 0.001% threshold has less than 0.8% maximum sensitivity error in the ROI and ~0.02% average sensitivity error within grey matter, which is the sampled area using our HD-DOT setup. To ensure the sensitivity accuracy in the ROI the reduced sensitivity matrix based on 0.001% threshold is therefore used in this study.
The effect of FEM mesh resolution on accuracy of the sensitivity matric is also presented. It is shown that as the node density of the mesh increases, the numerical accuracy of the sensitivity matrix also increases, highlighting the need for use of high resolution meshes for model based parameter recovery. The sensitivity matrices based on the mesh with 320000 nodes has the smallest sensitivity error (~4%) and the sensitivity matrixes based on the mesh with 50000 nodes has the biggest sensitivity error (~10%).
The effect of using a reduced sparse sensitivity matrix on brain activation recovery is evaluated based on simulated whole cortex (flat field) activation. Recovery results based on the original sensitivity matrix and the reduced sparse sensitivity matrix are compared for the whole cortex, and there is no visual difference on the recovery results based on the two matrices. Therefore, the reduced sparse sensitivity matrix is an acceptable alternative of the original sensitivity matrix.
Compared to the original sensitivity matrix, the reduced sparse sensitivity matrix has clear advantages on the memory and computational time efficiency for the generation process. Based on eight meshes of varying node resolution, storage memory of the original sensitivity matrix and the reduced sparse sensitivity matrix both increase as the node density of the mesh increases. The memory reduction of the reduced sensitivity matrix is over tenfold for all 8 meshes and it increases as the node density of the mesh increases. The mesh with 320000 nodes has the biggest original sensitivity matrix (~8.4 GB) and the biggest reduced sparse sensitivity matrix (~0.7 GB), yet providing the largest memory reduction of memory requirements (~1240%), such that it is possible to calculate and store these matrices for parameter recovery on simple hardware.
Two efficient calculations of the reduced sparse sensitivity matrix are also investigated based on parallelisation within the generation process itself. Processing time for meshes of different resolutions, for both light field calculations as well as the sensitivity matrix calculations have shown that, as expected, parallelisation based on multiple CPUs provide an enhanced computational speed. For all example meshes of varying resolution, the process time increases as the node density of the mesh increases, but there is no linear relationship between the node density of the mesh and the reduction of the processing time, which in part is due to hardware limitation and the use of swap memory in extreme cases. The mesh with 320000 nodes has the longest processing time for the conventional calculation (~470 minutes) and longest processing time for the proposed calculation process with parallelisation (~65 minutes). The mesh with 50000 nodes has the shortest processing time for the (~30 minutes) and shortest processing time for the proposed process with parallelisation (~7 minutes). For all eight meshes, the reduction of the processing time is ~170% using the proposed process without parallelisation and ~400% with parallelisation. Since there are some delicate structures in human brain such as the small folds in the gyri that cannot be represented by low density meshes, the structure of the meshes can become more complex when reaching certain limitations of the node density, again highlighting the need for the utilisation of high density FEM meshed for model based parameter recovery.
Acknowledgments
This work has been funded by the National Institutes of Health (NIH) Grant R01EB009233-2, RO1-CA132750 and Autism Speaks Meixner Translational Postdoctoral Fellowship 7962.
References and links
- 1.Sanfey A. G., Rilling J. K., Aronson J. A., Nystrom L. E., Cohen J. D., “The neural basis of economic decision-making in the Ultimatum Game,” Science 300(5626), 1755–1758 (2003). 10.1126/science.1082976 [DOI] [PubMed] [Google Scholar]
- 2.Walter H., Abler B., Ciaramidaro A., Erk S., “Motivating forces of human actions,” Brain Res. Bull. 67(5), 368–381 (2005). 10.1016/j.brainresbull.2005.06.016 [DOI] [PubMed] [Google Scholar]
- 3.Singer T., “The neuronal basis of empathy and fairness,” Novartis Found. Symp. 278, 20–40 (2007). 10.1002/9780470030585.ch3 [DOI] [PubMed] [Google Scholar]
- 4.Müller K. R., Tangermann M., Dornhege G., Krauledat M., Curio G., Blankertz B., “Machine learning for real-time single-trial EEG-analysis: from brain-computer interfacing to mental state monitoring,” J. Neurosci. Methods 167(1), 82–90 (2008). 10.1016/j.jneumeth.2007.09.022 [DOI] [PubMed] [Google Scholar]
- 5.deCharms R. C., Christoff K., Glover G. H., Pauly J. M., Whitfield S., Gabrieli J. D., “Learned regulation of spatially localized brain activation using real-time fMRI,” Neuroimage 21(1), 436–443 (2004). 10.1016/j.neuroimage.2003.08.041 [DOI] [PubMed] [Google Scholar]
- 6.Johnston S., Linden D. E. J., Healy D., Goebel R., Habes I., Boehm S. G., “Upregulation of emotion areas through neurofeedback with a focus on positive mood,” Cogn. Affect. Behav. Neurosci. 11(1), 44–51 (2011). 10.3758/s13415-010-0010-1 [DOI] [PubMed] [Google Scholar]
- 7.Sitaram R., Lee S., Ruiz S., Rana M., Veit R., Birbaumer N., “Real-time support vector classification and feedback of multiple emotional brain states,” Neuroimage 56(2), 753–765 (2011). 10.1016/j.neuroimage.2010.08.007 [DOI] [PubMed] [Google Scholar]
- 8.Ruiz S., Lee S., Soekadar S. R., Caria A., Veit R., Kircher T., Birbaumer N., Sitaram R., “Acquired self-control of insula cortex modulates emotion recognition and brain network connectivity in schizophrenia,” Hum. Brain Mapp. 34(1), 200–212 (2013). 10.1002/hbm.21427 [DOI] [PMC free article] [PubMed] [Google Scholar]
- 9.Sitaram R., Veit R., Stevens B., Caria A., Gerloff C., Birbaumer N., Hummel F., “Acquired Control of Ventral Premotor Cortex Activity by Feedback Training: An Exploratory Real-Time FMRI and TMS Study,” Neurorehabil. Neural Repair 26(3), 256–265 (2012). 10.1177/1545968311418345 [DOI] [PubMed] [Google Scholar]
- 10.Craig A. D., “How do you feel? Interoception: the sense of the physiological condition of the body,” Nat. Rev. Neurosci. 3(8), 655–666 (2002). 10.1038/nrn894 [DOI] [PubMed] [Google Scholar]
- 11.Coyle S. M., Ward T. E., Markham C. M., “Brain-computer interface using a simplified functional near-infrared spectroscopy system,” J. Neural Eng. 4(3), 219–226 (2007). 10.1088/1741-2560/4/3/007 [DOI] [PubMed] [Google Scholar]
- 12.Mason S. G., Bohringer R., Borisoff J. F., Birch G. E., “Real-time control of a video game with a direct brain--computer interface,” J. Clin. Neurophysiol. 21(6), 404–408 (2004). 10.1097/01.WNP.0000146840.78749.79 [DOI] [PubMed] [Google Scholar]
- 13.Weiskopf N., Mathiak K., Bock S. W., Scharnowski F., Veit R., Grodd W., Goebel R., Birbaumer N., “Principles of a brain-computer interface (BCI) based on real-time functional magnetic resonance imaging (fMRI),” IEEE Trans. Biomed. Eng. 51(6), 966–970 (2004). 10.1109/TBME.2004.827063 [DOI] [PubMed] [Google Scholar]
- 14.LaConte S. M., Peltier S. J., Hu X. P. P., “Real-time fMRI using brain-state classification,” Hum. Brain Mapp. 28(10), 1033–1044 (2007). 10.1002/hbm.20326 [DOI] [PMC free article] [PubMed] [Google Scholar]
- 15.Thesen S., Heid O., Mueller E., Schad L. R., “Prospective acquisition correction for head motion with image-based tracking for real-time fMRI,” Magn. Reson. Med. 44(3), 457–465 (2000). [DOI] [PubMed] [Google Scholar]
- 16.Weiskopf N., Veit R., Erb M., Mathiak K., Grodd W., Goebel R., Birbaumer N., “Physiological self-regulation of regional brain activity using real-time functional magnetic resonance imaging (fMRI): methodology and exemplary data,” Neuroimage 19(3), 577–586 (2003). 10.1016/S1053-8119(03)00145-9 [DOI] [PubMed] [Google Scholar]
- 17.Beauregard M., Lévesque J., “Functional magnetic resonance imaging investigation of the effects of neurofeedback training on the neural bases of selective attention and response inhibition in children with attention-deficit/hyperactivity disorder,” Appl. Psychophysiol. Biofeedback 31(1), 3–20 (2006). 10.1007/s10484-006-9001-y [DOI] [PubMed] [Google Scholar]
- 18.Ferradal S. L., Liao S. M., Eggebrecht A. T., Shimony J. S., Inder T. E., Culver J. P., Smyser C. D., “Functional imaging of the developing brain at the bedside using diffuse optical tomography,” Cereb. Cortex 93, 320 (2015). [DOI] [PMC free article] [PubMed] [Google Scholar]
- 19.Liao S. M., Ferradal S. L., White B. R., Gregg N., Inder T. E., Culver J. P., “High-density diffuse optical tomography of term infant visual cortex in the nursery,” J. Biomed. Opt. 17(8), 081414 (2012). 10.1117/1.JBO.17.8.081414 [DOI] [PMC free article] [PubMed] [Google Scholar]
- 20.Joshi A., Bangerth W., Sevick-Muraca E., “Adaptive finite element based tomography for fluorescence optical imaging in tissue,” Opt. Express 12(22), 5402–5417 (2004). 10.1364/OPEX.12.005402 [DOI] [PubMed] [Google Scholar]
- 21.Paulsen K. D., Jiang H., “Enhanced frequency-domain optical image reconstruction in tissues through total-variation minimization,” Appl. Opt. 35(19), 3447–3458 (1996). 10.1364/AO.35.003447 [DOI] [PubMed] [Google Scholar]
- 22.Guven M., Yazici B., Kwon K., Giladi E., Intes X., “Effect of discretization error and adaptive mesh generation in diffuse optical absorption imaging,” Inverse Probl. 23(3), 1135–1160 (2007). 10.1088/0266-5611/23/3/018 [DOI] [Google Scholar]
- 23.Paulsen K. D., Jiang H., “Spatially Varying Optical Property Reconstruction Using a Finite Element Diffusion Equation Approximation,” Med. Phys. 22(6), 691–701 (1995). 10.1118/1.597488 [DOI] [PubMed] [Google Scholar]
- 24.Eames M. E., Pogue B. W., Yalavarthy P. K., Dehghani H., “An efficient Jacobian reduction method for diffuse optical image reconstruction,” Opt. Express 15(24), 15908–15919 (2007). 10.1364/OE.15.015908 [DOI] [PubMed] [Google Scholar]
- 25.Arridge S., Schweiger M., “Gradient-based optimisation scheme for optical tomography,” IEEE Trans. Med. Imaging 18, 262–271 (1999). 10.1109/42.764902 [DOI] [PubMed] [Google Scholar]
- 26.Hielscher A. H., Klose A. D., Hanson K. M., “Gradient-based iterative image reconstruction scheme for time-resolved optical tomography,” IEEE Trans. Med. Imaging 18(3), 262–271 (1999). 10.1109/42.764902 [DOI] [PubMed] [Google Scholar]
- 27.Tsai J.-J., Chen N.-J., Fang W.-C., Chen J.-S., “Fast Image Reconstruction Algorithm For Continuous Wave Diffuse Optical Tomography,” IEEE/NIH Life Science Systems and Applications Workshop 93(2011). 10.1109/LISSA.2011.5754164 [DOI] [Google Scholar]
- 28.Gupta S., Yalavarthy P. K., Roy D., Piao D., Vasu R. M., “Singular value decomposition based computationally efficient algorithm for rapid dynamic near-infrared diffuse optical tomography,” Med. Phys. 36(12), 5559–5567 (2009). 10.1118/1.3261029 [DOI] [PubMed] [Google Scholar]
- 29.Yi X., Wang X., Chen W., Wan W., Zhao H., Gao F., “Full domain-decomposition scheme for diffuse optical tomography of large-sized tissues with a combined CPU and GPU parallelization,” Appl. Opt. 53(13), 2754–2765 (2014). 10.1364/AO.53.002754 [DOI] [PubMed] [Google Scholar]
- 30.Schweiger M., “GPU-accelerated finite element method for modeling light transport in diffuse optical tomography,” Int. J. Biomed. Imaging 2011, 403892 (2011). 10.1155/2011/403892 [DOI] [PMC free article] [PubMed] [Google Scholar]
- 31.Alerstam E., Svensson T., Andersson-Engels S., “Parallel computing with graphics processing units for high-speed Monte Carlo simulation of photon migration,” J. Biomed. Opt. 13(6), 060504 (2008). 10.1117/1.3041496 [DOI] [PubMed] [Google Scholar]
- 32.Lu Y., Chatziioannou A. F., “A Parallel Adaptive Finite Element Method for the Simulation of Photon Migration with the Radiative-Transfer-Based Model,” Commun. Numer. Methods Eng. 25(6), 751–770 (2009). 10.1002/cnm.1167 [DOI] [PMC free article] [PubMed] [Google Scholar]
- 33.Wu X., Eggebrecht A. T., Ferradal S. L., Culver J. P., Dehghani H., “Quantitative evaluation of atlas-based high-density diffuse optical tomography for imaging of the human visual cortex,” Biomed. Opt. Express 5(11), 3882–3900 (2014). 10.1364/BOE.5.003882 [DOI] [PMC free article] [PubMed] [Google Scholar]
- 34.Jermyn M., Ghadyani H., Mastanduno M. A., Turner W., Davis S. C., Dehghani H., Pogue B. W., “Fast segmentation and high-quality three-dimensional volume mesh creation from medical images for diffuse optical tomography,” J. Biomed. Opt. 18(8), 086007 (2013). 10.1117/1.JBO.18.8.086007 [DOI] [PMC free article] [PubMed] [Google Scholar]
- 35.Eggebrecht A. T., Ferradal S. L., Robichaux-Viehoever A., Hassanpour M. S., Dehghani H., Snyder A. Z., Hershey T., Culver J. P., “Mapping distributed brain function and networks with diffuse optical tomography,” Nat. Photonics 8(6), 448–454 (2014). 10.1038/nphoton.2014.107 [DOI] [PMC free article] [PubMed] [Google Scholar]
- 36.Zeff B. W., White B. R., Dehghani H., Schlaggar B. L., Culver J. P., “Retinotopic mapping of adult human visual cortex with high-density diffuse optical tomography,” Proc. Natl. Acad. Sci. U.S.A. 104(29), 12169–12174 (2007). 10.1073/pnas.0611266104 [DOI] [PMC free article] [PubMed] [Google Scholar]
- 37.Zhan Y., Eggebrecht A. T., Culver J. P., Dehghani H., “Image quality analysis of high-density diffuse optical tomography incorporating a subject-specific head model,” Front. Neuroenergetics 4, 6 (2012). 10.3389/fnene.2012.00006 [DOI] [PMC free article] [PubMed] [Google Scholar]
- 38.Arridge S. R., Schweiger M., “Photon-measurement density functions. Part 2: Finite-element-method calculations,” Appl. Opt. 34(34), 8026–8037 (1995). 10.1364/AO.34.008026 [DOI] [PubMed] [Google Scholar]
- 39.Arridge S. R., Schotland J. C., “Optical tomography: forward and inverse problems,” Inverse Probl. 25(12), 123010 (2009). 10.1088/0266-5611/25/12/123010 [DOI] [Google Scholar]
- 40.Eggebrecht A. T., White B. R., Ferradal S. L., Chen C., Zhan Y., Snyder A. Z., Dehghani H., Culver J. P., “A quantitative spatial comparison of high-density diffuse optical tomography and fMRI cortical mapping,” Neuroimage 61(4), 1120–1128 (2012). 10.1016/j.neuroimage.2012.01.124 [DOI] [PMC free article] [PubMed] [Google Scholar]
- 41.Dehghani H., Eames M. E., Yalavarthy P. K., Davis S. C., Srinivasan S., Carpenter C. M., Pogue B. W., Paulsen K. D., “Near infrared optical tomography using NIRFAST: Algorithm for numerical model and image reconstruction,” Commun. Numer. Methods Eng. 25(6), 711–732 (2009). 10.1002/cnm.1162 [DOI] [PMC free article] [PubMed] [Google Scholar]
- 42.Arridge S. R., Kaipio J. P., Kolehmainen V., Schweiger M., Somersalo E., Tarvainen T., Vauhkonen M., “Approximation errors and model reduction with an application in optical diffusion tomography,” Inverse Probl. 22(1), 175–195 (2006). 10.1088/0266-5611/22/1/010 [DOI] [PubMed] [Google Scholar]
- 43.Yalavarthy P. K., Dehghani H., Pogue B. W., Paulsen K. D., “Critical computational aspects of near infrared circular tomographic imaging: Analysis of measurement number, mesh resolution and reconstruction basis,” Opt. Express 14(13), 6113–6127 (2006). 10.1364/OE.14.006113 [DOI] [PubMed] [Google Scholar]
- 44.Hansen P. C., Rank-Deficient and Discrete Ill-Posed Problems: Numerical Aspects of Linear Inversion (Siam, Philadelphia, 1998), vol. 4. [Google Scholar]
- 45.Molinari M., Cox S. J., Blott B. H., Daniell G. J., “Efficient non-linear 3D electrical tomography reconstruction,” Proceedings of the 2nd World Congress on Industrial Process Tomography 424–432 (2001). [Google Scholar]


