Abstract
Cell imaging using low-light techniques such as bioluminescence, radioluminescence, and low-excitation fluorescence has received increased attention, particularly due to broad commercialization of highly sensitive detectors. However, the dim signals are still regarded as difficult to image using conventional microscopes, where the only low-light microscope in the market is primarily optimized for bioluminescence imaging. Here, we developed a novel modular microscope that is cost-effective and suitable for imaging different low-light luminescence modes. Results show that this microscope system features excellent aberration correction capabilities and enhanced image resolution, where bioluminescence, radioluminescence and epifluorescence images were captured and compared with the commercial bioluminescence microscope.
OCIS codes: (110.0180) Microscopy, (040.3780) Low light level, (260.3800) Luminescence, (170.3880) Medical and biological imaging
1. Introduction
The development of highly sensitive photon sensor arrays has opened new research avenues for probing cell biology via luminescent reporters. Luminescence assays, as opposed to fluorescence, require no external illumination, where endogenous luminescence of most wild-type cells can be detected with virtually no background albeit the extremely low emission signals [1–3]. The two most common low emission luminescence signals are bioluminescence (emission of light due to endogenous enzymatic reactions) and chemiluminescence (emission of light by exogenous sensing probes), where luminometer-based assays have been developed to measure bio- or chemi-luminescence for sensitive detection of analytes in bulk samples [4]. A third form of luminescence that can be used to probe into molecular processes is radioluminescence, or scintillation. Similar to bio- or chemi-luminescence detection, radioluminescence detection is the basis for liquid scintillation counting, which is used to quantify the presence of a radiolabeled probe in a sample [5]. While these bulk assays are very sensitive, they do not have the spatial resolution to distinguish between individual cells or cell compartments.
In order to enhance the resolution of the aforementioned signals, bioluminescence and chemiluminescence microscopy techniques have been developed as a means to probe cellular and subcellular processes [6–8]. Moreover, a technique known as radioluminescence microscopy (RLM) has been recently developed to quantify the biological transport of small molecules tagged with radionuclides in real-time [9,10]. The mechanism of RLM is similar to previously developed gamma cameras, in which the scintillator is coupled to the sensor via two camera lenses [11,12], but the unique magnification of RLM allows it to detect radionuclides on the single cell level. The principle of RLM is to label cells cultured in vitro with radionuclides and collect radioactive decay data by positioning a scintillating crystal in close proximity to the cell surface. Each radionuclide decay produces a pulse of optical light that can be detected using a sensitive microscope. Because radioisotopes can tag any type of small molecules, radioluminescence imaging enables studying of individual cell responses to various radiopharmaceuticals.
For imaging low-light luminescence signals, different imaging systems have been utilized and have evolved over the years. In the earlier years, photomultiplier tubes were used to amplify the dim bioluminescence signals at a single-pixel resolution [13,14] or video cameras attached to image intensifiers for a picture resolution [15]. Charge-coupled devices (CCDs) were later introduced to capture dim images with cooled detectors to minimize thermal noise for low noise applications [16,17] and intensified charge-coupled devices (ICCDs) for real-time applications [17,18]. Electron multiplying charge-coupled device (EMCCD) is the most recent photon-sensitive camera developed that allows imaging of dim signals while maintaining high quantum efficiency [19]. The reader is encouraged to refer to a review paper by Welsh et al. for the general overview of low-light microscopy [20].
In addition to the improvement in photon detectors, a bioluminescence microscope has been recently introduced to promote further advancement in imaging low-light signals [21–23]. The LV200 (Olympus) is a commercial bioluminescence microscope featuring greatly enhanced light collection capabilities by using a short-focal-length tube lens. However, the system is primarily intended for bioluminescence microscopy (no epi-fluorescence illumination) and is rather costly given the capabilities. Moreover, since the tube lens in the microscope is commercially unavailable, it is difficult for laboratories to replicate the high-brightness, short-focal-length tube set-up in a custom and modular platform.
In this paper, we introduce a novel approach for building a low-light microscope system (LLM) suitable for weak-excitation fluorescence, bioluminescence, chemiluminescence, and radioluminescence imaging. In the proposed system, the microscope’s tube lens is replaced with a commercially available microscope objective lens (CFI Plan Apochromat λ 4× , Nikon), placed backwards in the optical path. We selected the Nikon λ 4× for its high numerical aperture, long working distance and excellent distortion, spherical and chromatic aberration correction. We also designed the system to enable epi-illumination during fluorescence imaging, which provides enhanced image quality compared to trans-illumination used on the LV200. The performance of the modular LLM was evaluated by testing distortion, spherical and chromatic aberration correction and light collecting capabilities. Afterwards, luminescence and low-light fluorescence images were captured and compared to images taken with the commercial LV200 system. While the LLM system had slightly more vignetting than the LV200, epifluorescence, bioluminescence and radioluminescence images show that the system is well suited for imaging low-light luminescence in cells.
2. Lens selection
2.1 Tube lens
For bioluminescence and radioluminescence microscopy, the low-light luminescence signals originate from the imaging plane. Thus, the brightness of the microscope system, a function of the light gathering power, is analogous to that of a trans-illumination microscope:
| (1) |
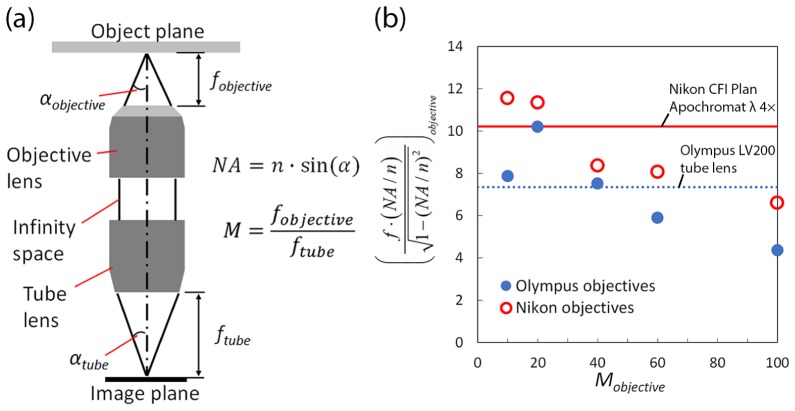
The image brightness of a typical infinity-corrected system (Fig. 1(a)) can be increased up to a certain point by increasing the numerical aperture of the objective. To further increase image brightness, the magnification M of the microscope must be reduced while maintaining its numerical aperture. However, in a conventional microscope, lower magnification objectives (e.g. 10× ) generally have reduced numerical aperture (e.g. 0.3). Therefore, we reduce the effective magnification of the objective system by acting on the tube lens rather than the objective itself following a method first suggested by Ogoh et al [21]. This approach relies on the fact that the magnification of an infinity corrected optical system is a function of both the tube lens and the objective,
Fig. 1.
(a) Schematic diagram of a typical ininity-corrected system and (b) graphical representation of Eq. (2b). The solid line represents the value of the f = 50mm, NA = 0.2 tube lens (Nikon λ 4 × objective) and the dotted line represents f·NA of the f = 36mm, NA = 0.2 lens (LV200 tube lens).
| (2a) |
Based on the relationship between the magnification M and the light cone half-angle α, the minimum required NA of the tube lens NAtube in order to prevent loss in image brightness is,
| (2b) |
Since the tube lens generally features low NA(<<1), the left-hand side of the equation can be assumed as f·NA. It should be noted that Ogoh et al. assumes a small NA for the right-hand side of the equation as well, further simplifying the equation to be NAtube ≥ (NAobjective/M). However, for the case where the objective NA/n ~1, particularly for oil immersion lenses, Eq. (2b) should be used to identify the proper tube lens specification.
Another selection criterion to be considered is the tube lens working distance. As the flange focal distance (distance from detector to mounting thread in the camera) of a C-mount is 17.52mm, the tube lens working distance should be greater than the flange focal distance.
Based on Fig. 1(b), a graphical representation of Eq. (2b), and a minimum working distance WD of 17.52 mm, we selected Nikon λ 4x objective lens (f = 50 mm, WD = 20 mm and NA = 0.2) as the low-light microscope tube lens (hitherto addressed as LLM50). The Nikon lens is an infinity-corrected Plan Apochromat objective lens that features excellent chromatic/spherical aberration and flatness correction capabilities. Since the LLM50 is an infinity-corrected system, a dichroic mirror and emission filter can be placed in the optical path for epifluorescence illumination. In order to evaluate the performance of the LLM50, we compared the results with the same setup, but with tube lens replaced with the LV200 36 mm tube lens (LLM36), and with the LV200 itself. Table 1 represents the specification comparison of LLM50 with LLM36 and LV200 systems.
Table 1. Comparison chart of the low-light microscope specifications.
| LLM50 | LLM36 | LV200 | |
|---|---|---|---|
| Tube lens | Nikon λ 4 × Objective Lens |
LV200 Tube Lens | LV200 Tube Lens |
| Compatible objective lens | Unrestricted | Unrestricted | Olympus |
| Detector | Hamamatsu ImagEM C9100-13 |
Hamamatsu ImagEM C9100-13 |
Hamamatsu ImagEM C9100-14 |
| Illumination mode | Trans-illumination, Epifluorescence |
Trans-illumination, Epifluorescence |
Trans-illumination |
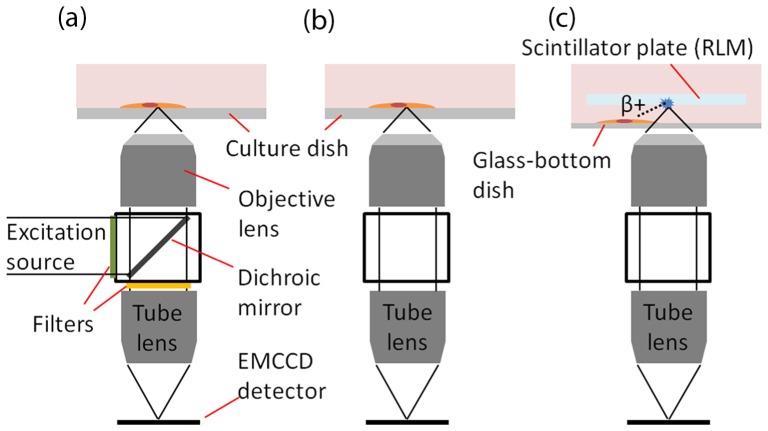
In the LLM50, the Nikon λ lens is secured under the microscope objective lens in an inverted direction (Fig. 2), and is positioned 20mm (its working distance) above the EMCCD (ImagEM C9100-13, Hamamatsu). The actual spacing between the Nikon Lambda and the C-mount camera flange is (working distance of Nikon λ 4 × ) – (flange focal distance) = 20 mm – 17.52 mm ≈2.5 mm. Since the distance between the tube lens and the camera detector is a crucial parameter, the EMCCD is mounted on a micrometer and is carefully positioned.
Fig. 2.
Schematic diagram of the low-light luminescence microscope (LLM) setup. The microscope can capture three distinct types of images: (a) low-excitation fluorescence imaging if dichroic mirror is inserted, (b) bioluminescence imaging if dichroic mirror is removed and (c) radioluminescence imaging if scintillating crystal is placed above cell during bioluminescence mode.
2.2 Objective lens
In order to effectively enhance the image brightness for low-light imaging, it is necessary to select microscope objectives with the highest possible NA. The objective lenses are selected from two major brands, Nikon and Olympus. However, as can be seen in the previous graph (Fig. 1(b)), a number of objectives have larger lens aperture radii than tube lens for both LLM50 and LLM36, thus affecting the numerical apertures of those objectives (Fig. 3).
Fig. 3.
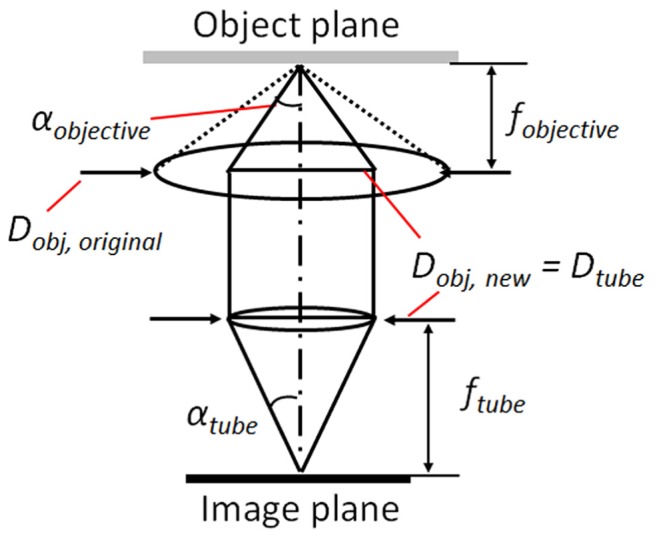
Schematic diagram depicting the reduction in effective NA of an objective lens coupled to tube lens with a small pupil diameter.
In this case, the effective numerical aperture of the objective lens should be modified based on the tube lens pupil diameter,
| (3a) |
where the objective effective numerical aperture NAobj,new can then be modified to,
| (3b) |
Table 2 represents the original NA of the objective lens and the corrected NA. If the pupil diameter of the tube lens does not sufficiently collect light that emerges from the objective lens, the corrected NA values are indicated in parenthesis. According to the table, it is expected that the LLM50 generally experiences less loss in NA than the LLM36 and LV200.
Table 2. Numerical aperture evaluation of different microscope objective manufacturers.
|
Olympus Objective Lens |
Nikon Objective Lens |
|||||
|---|---|---|---|---|---|---|
| Model |
NA |
Model |
NA |
|||
| LLM50 | LLM36 | LLM50 | LLM36 | |||
| UPLSAPO 10X | 0.4 (-) | 0.4 (0.38) | CFI S Fluor 10 × | 0.5 (0.45) | 0.5 (0.34) | |
| UPLSAPO 20X | 0.75 (-) | 0.75 (0.63) | CFI Plan Apo λ 20 × | 0.75 (0.71) | 0.75 (0.59) | |
| UPLSAPO 40X | 0.9 (-) | 0.9 (0.85) | CFI Plan Apo λ 40 × | 0.75 (-) | 0.75 (-) | |
| UPLFLN 40XO | 1.3 (-) | 1.3 (1.29) | CFI Plan Fluor 40 × | 1.3 (-) | 1.3 (1.25) | |
| UPLSAPO 60XO | 1.35 (-) | 1.35 (-) | CFI Plan Apo λ 60 × | 1.4 (-) | 1.4 (1.38) | |
| UPLSAPO 100XO | 1.4 (-) | 1.4 (-) | CFI Plan Apo λ 100 × | 1.45 (-) | 1.45 (-) | |
*Values for LV200 are identical to those of LLM36 coupled to Olympus objective lenses.
The modified NA values can then be applied to Eq. (1) to estimate the theoretical brightness of the microscopes. Since the Nikon λ lens has significantly shorter focal length than standard microscopy tube lens (ftube = 200 mm for Nikon and ftube = 180 mm for Olympus), the estimated brightness of the LLMs are significantly enhanced due to the reduction in effective magnification. Figure 4 represents the brightness index comparison of different objective – tube lens pairs. In the similar M = 10 × regime, the LLM50 is ~700% brighter than conventional microscopes. However, as the effective magnification increases, the brightness amplification effect diminishes.
Fig. 4.
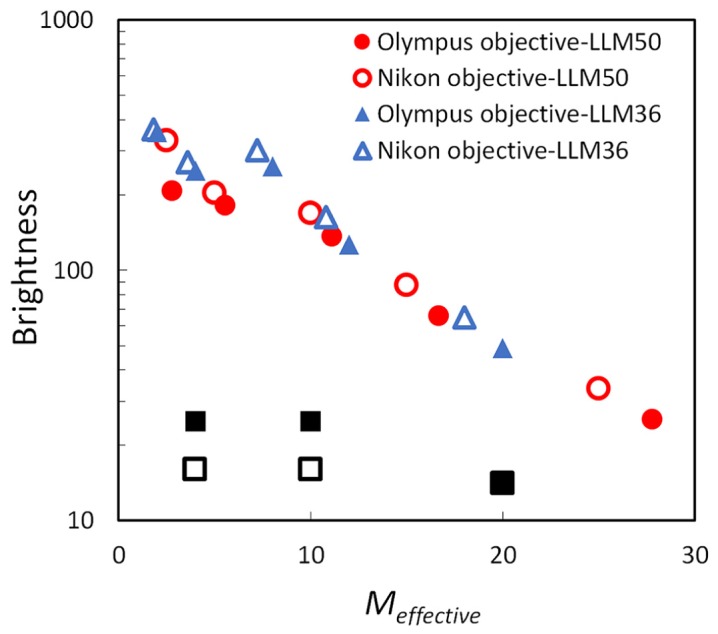
Comparison of image brightness with different microscope lens and tube lens manufacturer combinations based on Eq. (1). The tube lens specifications used for the LV200 (or LLM36) is f = 36mm and NA = 0.2 and for the LLM50 (Nikon λ 4 × lens) is f = 50mm and NA = 0.2. The square symbols (■,□) represent the magnification with the standard commercial microscopes for Olympus and Nikon, respectively (4 × , 10 × and 20 × ). Since the tube lens focal length for the Nikon λ is longer than the LV200 tube lens, the LLM50 has a higher magnification than the LV200 if the same microscope objective is used.
It should be noted that the microscope objective NA is not necessarily identical to the specified values when imaging through multiple mediums. This is mainly due to the mismatch in refractive indexes of the different mediums [24]. However, we assume that the NA is identical to the original specifications since the subject is not the scope of this research.
3. Materials and methods
3.1 Brightness evaluation
The performance of the LLM50 is evaluated once the low-light microscope is assembled as described in the previous sections. In order to minimize the background light contamination, the LLM50 is placed inside a custom light-tight box (Stanford Photonics, Inc.). Brightness or light gathering power of the LLM50 is quantified using a 10 μm-thin Lu2O3:Eu scintillator plate (RMD, Inc.) [25] attached to an Am-241 alpha point source (Isotope Products Laboratories). The Am-241 source emits ~5.3 MeV alpha particles, with a very narrow energy distribution (full width half maximum of ~31 keV). Since the alpha particle emission is omnidirectional, the scintillation light due to ionizing radiation occurs as randomly localized flashes (spots). In order to collect enough events to evaluate the brightness, 1,000 images were captured at 100 ms exposure time.
The brightness is evaluated by estimating the number of optical photons reaching the detector, which is calculated as,
| (4) |
where C is the conversion factor (5.8 ADU/electron for ImagEM C9100-13 and 6.3 ADU/electron for ImagEM C9100-14), I is the intensity value of individual pixels in the flash, is the average of 1,000 dark images, N is the number of pixels in each flash, GAnalog is the analog gain settings, GEM is the EM gain settings and QE is the quantum efficiency of the camera (approximated as 0.9). It should be noted that GEM was measured experimentally for both cameras by taking the ratio of a background-free image signal, with and without the EM gain enabled.
The brightness of the LLM50, or the ability to deliver photons to the detector, is evaluated for three different objective lenses mounted on the system (selection based on availability): Olympus 40 × lens (oil immersion, UPLFLN 40XO), Nikon 40 × lens (air, Plan Fluor) and Nikon 20 × lens (air, CFI Plan Apochromat λ).
3.2 Optical distortion evaluation
The LLM50 is also tested for optical distortion and is compared with the LLM36 and the LV200 as reference. Distortion correction of the LLM50 is observed by imaging a 100 μm × 100 μm square grid calibration target (R1L3S3P, Thorlabs), where the level of distortion is assessed by measuring the curvature of a straight grid line. An Olympus 40 × oil-immersion objective (UPLFLN 40XO, Olympus) is used to image the target images, where the images are taken in trans-illumination mode under a bright field light source (OSL1 Fiber Illuminator, Thorlabs).
While spherical/chromatic aberration is also tested with the target grid results, it should be noted that since the EMCCD is a monochromatic detector, it is not distinguishable between the spherical aberration and the axial chromatic aberration. However, sharp image results will suggest that both aberrations are corrected for.
3.3 Low-light microscopy imaging
Three different types of microscopy were performed with the LLM50, namely radioluminescence, bioluminescence and low-light fluorescence. The same experiments are repeated with the LV200 microscope system. While our goal is to evaluate the two tube lenses, it must be noted that the LV200 and the LLM system are equipped with two different EMCCD cameras (ImageEM C9100-14 and C9100-13, Hamamatsu, respectively). The difference in pixel size (13 μm vs. 16 μm) was accounted for in all comparisons.
Radioluminescence imaging is performed by imaging scintillation signals from radioactive cells. MDA-MB-231 human breast cancer cells were incubated with 2-deoxy-2-[18F] fluorodeoxyglucose (FDG), a glucose analog labeled with the positron-emitting radioisotope 18F (half-life of 109 minutes). The cells are first plated on a glass-bottom imaging dish, at a low confluency to facilitate identification of single cells. In order to maximize the glucose uptake of individual cells, the cells are left in low glucose DMEM (Gibco) for ~30 minutes. The media is then removed and 200 μl of a mixture of glucose-free media and FDG (~0.2 mCi/ml) is added. To remove residual activity, the imaging dish is rinsed with PBS three times and is filled with 1 ml of glucose-free DMEM media, and a CdWO4 scintillator (1 cm × 1 cm × 500 μm) is gently immersed in the media, above the cells. To ensure that the scintillator is fully submerged, pressure is gently applied with a tweezer. The dish is then placed on the microscope stage and the cells are brought into focus using brightfield mode. Once the dish is in focus, the camera is set to EMCCD mode with a 30 ms exposure, 4 × 4 binning, and maximum EM gain. A total of 10,000 images are taken in order to reconstruct a high-quality image.
Bioluminescence is imaged in luciferase-expressing 4T1 murine cells by adding 20 μl luciferin (D-Luciferin, Sigma), a substrate that reacts with the luciferase under the presence of ATP in the cells [20,26], and incubating the cells for 10 minutes. The images were captured after 10 minutes because the initial brightness signal is non-linear when the recombinant firefly luciferin is first applied, but then starts to degrade steadily after ~10 minutes [23]. The cells were imaged using the LLM50, with an exposure time of 30 seconds. Since the emission signal is low, the EMCCD mode was enabled using the full range of the detector’s sensitivity.
Fluorescence imaging is performed by imaging GFP-expressing 4T1 cells with the matching filter cube set (excitation: BP470-490, Olympus; emission: BA515-560HQ, Olympus; dichroic: TechSpec 495 nm, Edmund Optics) and the EMCCD exposure time set to 100 ms. Since the LLM50 features epifluorescence imaging, the brightness is given by
| (5) |
Because the effective magnification Meffective is reduced while maintaining the same objective lens NA, the brightness can be significantly enhanced without increasing the light source power.
4. Results and discussion
The performance of the LLM50 has been evaluated based on the criteria explained in the previous section. However, in order to better compare the two systems, additional performance tests have been performed by 1) imaging with our modular microscope system, but mounted with the LV200 tube lens (LLM36) and 2) imaging with the LV200 system itself. The reason for repeating the experiment with the Olympus 36 mm tube lens substituted for the Nikon λ tube lens is to allow parallel performance comparison of the two tube lenses, where all the microscope components remain unchanged except for the tube lens.
4.1 Magnifying power comparison
The effective magnification Meffective was measured with the Olympus 40 × oil immersion lens by imaging a 100 μm × 100 μm square grid. Since the pixel size of the EMCCD is known, Meffective is defined as the ratio between the detector pixel size and the grid length/measured pixels. Results comparing the estimated and measured Meffective are shown in Table 3, where the calculated values and measured values agree well with each other. It should be noted that the magnification is not conventional if the microscope objective – tube lens combination is from different manufacturers. This is due to the fact that objective lenses from different manufacturers have different focal lengths, despite the same magnification (e.g. fNikon, 40 × = 5mm vs. fOlympus, 40 × = 4.5mm). Since the Meffective is the ratio between the focal lengths of the tube lens and objective lens, the magnification will naturally yield unconventional values if the microscope objectives and tube lens manufacturers do not match.
Table 3. Effective magnification using a 100 μm × 100 μm square target grid.
| Tube lens focal length | Moriginal | Avg. target square length – measured | Detector size | Meffective - calculated | Meffective - measured |
|---|---|---|---|---|---|
| 50 mm (LLM50) | 40 × | 70.3 px | 16 μm/px | 11.1 × | 11.2 × ± 2% |
| 36 mm (LLM36) | 40 × | 50.8 px | 16 μm/px | 8 × | 8.1 × ± 2% |
| 36 mm (LV200) | 40 × | 61.8 px | 13.3 μm/px | 8 × | 8.2 × ± 4% |
4.2 Brightness evaluation
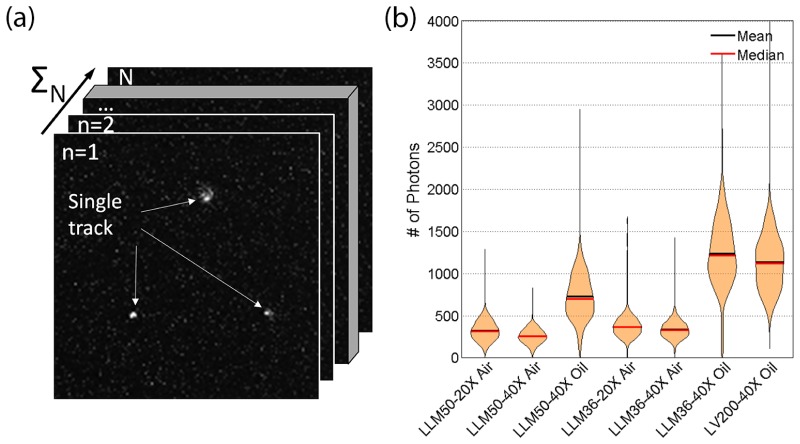
The brightness of the LLM50 equipped with different objective lenses is evaluated using a radioactive alpha source coupled to a 10 μm-thin Lu2O3:Eu scintillator. An example of a scintillation images is shown in Fig. 5(a), where each bright spot represents individual ionization tracks. The number of photons is quantified for each event and is represented as violin plots (Fig. 5(b)) [27]. The 20 × and 40 × air objective lenses have similar brightness since they have the same NA of 0.75. On the other hand, the 40 × oil immersion lens is significantly brighter than the other two lenses. For oil immersion lenses, however, the mean and median deviate from the peak value due to the broadening of the distribution. This indicates that there may be loss of light near the edge of the field of view (vignetting).
Fig. 5.
(a) Example of raw scintillation image. The individual tracks are evaluated and analyzed throughout the entire image stack. (b) Violin plot of histograms representing number of photons captured with different tube lens – microscope objective combinations. The widths of the violin plot have been normalized to facilitate visual comparison of the brightness performance (actual widths vary as the number of counts increases drastically with lower magnification or greater field of view).
Comparing the LLM50 results with the LLM36, the LLM36 was generally able to collect more photons than the LLM50, particularly when using the 40 × oil immersion lens. It is difficult to ascertain the reason behind the discrepancy since the transmission efficiency as a function of wavelength is unknown for the LLM36 tube lens. Nonetheless, the difference in detecting photons between the two systems is relatively small, making the Nikon λ lens to be a suitable alternative tube lens in order to capture radioluminescence images. On a side note, the LV200 commercial microscope demonstrated similar photon collection capacity as the LLM36 using the same objective lens (UPLFLN 40XO), as expected. Also, no significant difference was observed when the preinstalled IR filter was removed from the LV200.
4.3 Optical distortion
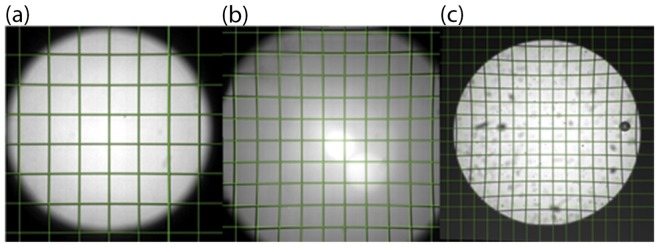
Spatial distortion of the LLM50 was evaluated by overlaying the 100 μm × 100 μm target grid image with reference virtual grids (Fig. 6). Additional target grid images were acquired with the LLM36 and the LV200.
Fig. 6.
Images of target grids captured with Olympus 40 × oil immersion objective lens fitted in (a) LLM50, (b) LLM36 and (c) LV200 system. The images are layered with virtual grids (green lines). Since the EMCCD in the LV200 is 1024 × 1024 pixels, the actual image area is ~2.6 times larger than (a) and (b).
The flatness correction capability is quantified by measuring the discrepancy between the grid image and the virtual grid at the edges, while maintaining the size of the region of interest (ROI). Although the LLM50 yielded the lowest level of distortion, results show that all configurations demonstrate similar flatness correction capability: 2.42 μm ± 1.16 μm, 3.79 μm ± 2.51 μm and 4.93 μm ± 2.72 μm for the LLM50, LLM36 and LV200, respectively.
Also, no significant field curvature aberrations (defocusing towards the edges) were detected. This is most likely due to the fact that the effective magnification is reduced in this system leading to generally larger depth of focus. The grid results show that both the LLM50 and the LV200 are suitable for observing undistorted images. One thing to note is that the current LLM50 setup has a larger vignetting area, or smaller imaging area, than the LLM36 by ~20%. The vignetting of the LLM50 can be reduced by removing the dichroic compartment and positioning the microscope objective closer to the tube lens [28], though at the cost of removing epifluorescence capability of the system.
The current setup was not able to identify other optical distortions such as astigmatism (directional stretching towards the edge of the image) and coma (directional blurring towards the edge of the image). While further experiments can be performed using proper calibration standards, it has not been pursued here since it is not the purpose of the current research.
4.4 Luminescence imaging
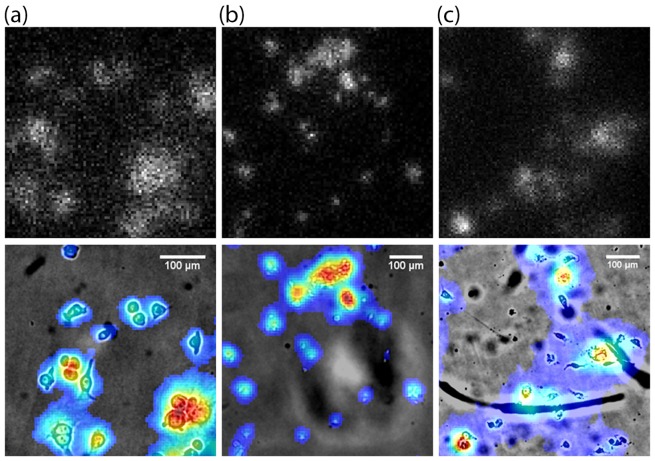
A radioluminescence image of MDA-MB-231 cells captured with the LLM50 is shown in Fig. 7(a). The image clearly shows the heterogeneous uptake of [18F]FDG at the single-cell level. Since the light signal in the scintillator is emitted only when beta particles are incident on the scintillator plane, only a few incidents are observed in each frame. For each frame, the bright spots with well-defined sharpness and short lengths are chosen and the rest are rejected. In order to collect sufficient information on the radionuclide distribution, 10,000 frames were acquired, processed and stacked into a single image. Thus, areas of higher radioactive decay will result in higher signal counts, and vice versa.
Fig. 7.
Radioluminescence images of MDA-MB-231 cells captured using (a) LLM50, (b) LLM36 and (c) LV200. Red color represents higher radioactive decay from the cells. The top row represents raw scintillation counts and the bottom represents the radioluminescence data smoothed with Gaussian filter and overlaid onto a micrograph of the MDA-MB-231 cells.
Comparing the radioluminescence imaging performance, it can be seen that the LLM50 yields similar results to those taken with the LLM36 (Fig. 7(b)). Although the Olympus tube lens has somewhat higher light transmission, performance in radioluminescence imaging between the LLM50 and the LLM36 is similar since the results only represent radioactive decay counts. As long as the individual ionization tracks are much brighter than the detector dark signal, the ability to capture single radioactive decay signals does not differ significantly between the systems. It should be noted that for the LV200, the exposure time was set to be 103 ms and 30,000 frames were captured. This was mainly due to the limitations of the camera mounted on the LV200, where the minimum exposure time available was 103 ms and the images were dimmer, requiring more images in order to collect statistically relevant radioluminescence data.
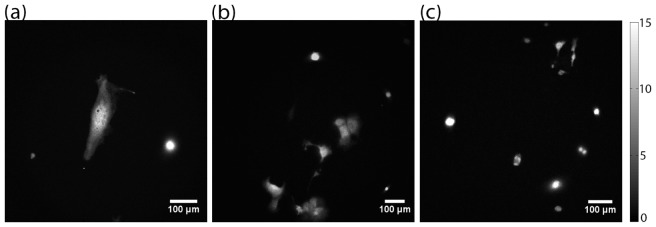
Bioluminescence image of 4T1 cells were captured with the LLM50 and shown in Fig. 8(a). Since the bioluminescence emission spectrum is broad and no emission filters were used, the bioluminescence image is a good indicator of chromatic and spherical aberration correction power of the system. In order to achieve sharp image, both microscope objectives and tube lens require excellent aberration corrections. The LLM50 demonstrated a sharp bioluminescence image with clearly visible nucleus of a 4T1 cell, which indicates that the system features both excellent chromatic and spherical aberration correction. On the other hand, the bioluminescence image captured with the LLM36 (Fig. 8(b)) and the LV200 (Fig. 8(c)) is significantly blurrier than the LLM50. However, it is not possible to distinguish if the system is experiencing spherical or chromatic aberration as the EMCCD is a monochrome detector.
Fig. 8.
Bioluminescence image of 4T1 cells using (a) LLM50, (b) LLM36 and (c) LV200. While the cell sizes are highly heterogeneous, the image shows that the LLM50 demonstrates a sharp bioluminescence image. The grayscale bar represents the number of photons per μm2.
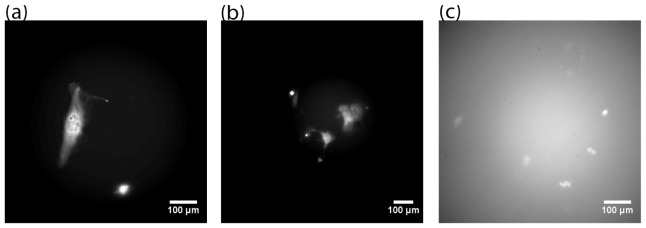
Finally, fluorescence image of 4T1 cells are captured with the LLM50 (Fig. 9(a)). As can be seen in the figure, the GFP image resolution captured with the LLM50 is high despite the low overall magnification (~11 × ). Since the diffraction limit is R = λ/2NA ≈0.5/(2·1.3) ≈0.19 μm [29], the resolving power of the system is primarily limited by the detector size (≈1.43 μm/pixel) rather than the diffraction limit. The resolution of the LLM50 and LV200 systems are sharper than conventional microscopes as the diffraction limit of standard microscope with 10 × lenses (NA = 0.25) is significantly higher (R ≈0.5/(2·0.25) ≈1.0 μm) in addition to the detector size effects.
Fig. 9.
GFP images of 4T1 cells captured using (a) LLM50 (epiluminescence illumination), (b) LLM36 (epiluminescence illumination) and (b) LV200 (transillumination). Intensity scale optimized for each image separately.
Comparing the resolution of fluorescence imaging using the same objective lens (Olympus 40 × oil immersion lens), the LLM50 demonstrated visibly higher spatial resolution compared to the LLM36 and the LV200. This is most likely due to the fact that the Nikon λ 4 × lens features better general optical aberration correction than the latter system. While fluorescence imaging is common in optical microscopy, the ability to access epifluorescence mode under extremely low light conditions is a unique feature of the LLM50 despite some vignetting effects as mentioned in the previous section. Applications of low-light fluorescence include time-lapse experiments [30], where photobleaching of fluorophores must be minimized, and temperature/pH sensitive experiments [31], where external perturbations may affect the signal. Also, the fluorescence image captured with the LV200 (Fig. 9(c)) has higher background than those captured with LLM50 and LLM36. This is primarily because the LV200 uses trans-illumination in fluorescence mode. The light from the excitation source can bleed through the bandpass emission and excitation filters, thus increasing the background.
It should be noted that the depth of field of the LLM50 is significantly smaller than standard microscopy system. The theoretical depth of field dtot [32] can be approximated as,
| (6) |
where λ is the approximate wavelength of light imaged by the optical system, n is the refractive index of the immersion media and e is the minimum resolvable distance of the EMCCD. The dtot of the LLM50 with an effective magnification of 11.1 × is ~2.1μm (no binning) and ~7.2μm (4 × 4 binning), whereas a standard microscope with magnification of 10 × is ~10.9μm. While shallower depth of focus makes it slightly more difficult to focus sharp images during cell imaging, it is suitable for applications such as radioluminescence microscopy where shallower depth of focus is desirable to identify the location of scintillation tracks.
5. Conclusion
A novel approach was investigated for low-light microscopy. Instead of using a standard tube lens to reduce the microscope objective magnification, a Nikon λ 4 × microscope objective with an excellent numerical aperture, short focal length (f = 50 mm), and long working distance was used to replace the standard tube lens (f = 200 mm for Nikon and f = 180 mm for Olympus).
The brightness performance of the low-light microscope implemented using the Nikon λ 4 × objective as tube lens (LLM50) demonstrated that the system is ideal for capturing dim signals such as radioluminescence, bioluminescence and low-excitation fluorescence. While the Olympus 36 mm tube lens from the commercial LV200 system (LLM36) yielded higher brightness, the general photon collecting capabilities of the two systems was similar. The LLM50 also featured excellent optical aberration correction capabilities, thus making it suitable for high resolution imaging of dim signals. Lastly, radioluminescence, bioluminescence and epifluorescence images were captured using the LLM50, demonstrating high performance in imaging all three luminescent modes. One possible drawback of the system is that the smaller physical size of the Nikon λ 4 × lens opening results in larger vignetting effects than the commercial LV200. This may be minimized by removing the dichroic mirror compartment and reducing the distance between the microscope objective and the tube lens.
In conclusion, the LLM50 is a highly modular system allowing high flexibility in imaging different luminescent modes and drastically reducing the cost as it is assembled using commercial lenses and optomechanic components. While only in vitro results were shown in the current paper, we expect that the system can also be used for in in vivo animal studies, which require high light collection capabilities but relatively low magnifications.
Acknowledgment
This work was supported by funding from the National Institutes of Health under grant R01CA186275. The authors would also like to acknowledge Olympus for graciously loaning the LV200 system to Stanford University.
References and links
- 1.Fan F., Wood K. V., “Bioluminescent assays for high-throughput screening,” Assay Drug Dev. Technol. 5(1), 127–136 (2007). 10.1089/adt.2006.053 [DOI] [PubMed] [Google Scholar]
- 2.Weissleder R., Ntziachristos V., “Shedding light onto live molecular targets,” Nat. Med. 9(1), 123–128 (2003). 10.1038/nm0103-123 [DOI] [PubMed] [Google Scholar]
- 3.Greer L. F., 3rd, Szalay A. A., “Imaging of light emission from the expression of luciferases in living cells and organisms: a review,” Luminescence 17(1), 43–74 (2002). 10.1002/bio.676 [DOI] [PubMed] [Google Scholar]
- 4.Roda A., Pasini P., Guardigli M., Baraldini M., Musiani M., Mirasoli M., “Bio- and chemiluminescence in bioanalysis,” Fresenius J. Anal. Chem. 366(6-7), 752–759 (2000). 10.1007/s002160051569 [DOI] [PubMed] [Google Scholar]
- 5.Laustriat G., “The luminescence decay of organic scintillators,” Mol. Cryst. 4(1–4), 127–145 (1968). 10.1080/15421406808082905 [DOI] [Google Scholar]
- 6.Massoud T. F., Gambhir S. S., “Molecular imaging in living subjects: seeing fundamental biological processes in a new light,” Genes Dev. 17(5), 545–580 (2003). 10.1101/gad.1047403 [DOI] [PubMed] [Google Scholar]
- 7.Coulon V., Audet M., Homburger V., Bockaert J., Fagni L., Bouvier M., Perroy J., “Subcellular imaging of dynamic protein interactions by bioluminescence resonance energy transfer,” Biophys. J. 94(3), 1001–1009 (2008). 10.1529/biophysj.107.117275 [DOI] [PMC free article] [PubMed] [Google Scholar]
- 8.Feranchak A. P., Lewis M. A., Kresge C., Sathe M., Bugde A., Luby-Phelps K., Antich P. P., Fitz J. G., “Initiation of purinergic signaling by exocytosis of ATP-containing vesicles in liver epithelium,” J. Biol. Chem. 285(11), 8138–8147 (2010). 10.1074/jbc.M109.065482 [DOI] [PMC free article] [PubMed] [Google Scholar]
- 9.Pratx G., Chen K., Sun C., Martin L., Carpenter C. M., Olcott P. D., Xing L., “Radioluminescence microscopy: measuring the heterogeneous uptake of radiotracers in single living cells,” PLoS One 7(10), e46285 (2012). 10.1371/journal.pone.0046285 [DOI] [PMC free article] [PubMed] [Google Scholar]
- 10.Pratx G., Chen K., Sun C., Axente M., Sasportas L., Carpenter C., Xing L., “High-Resolution Radioluminescence Microscopy of 18F-FDG Uptake by Reconstructing the β-Ionization Track,” J. Nucl. Med. 54(10), 1841–1846 (2013). 10.2967/jnumed.112.113365 [DOI] [PMC free article] [PubMed] [Google Scholar]
- 11.Miller B. W., Barber H. B., Barrett H. H., Chen L., Taylor S. J., “Photon-counting gamma camera based on columnar CsI(Tl) optically coupled to a back-illuminated CCD,” Proc. SPIE 6510, 65100N (2007). 10.1117/12.710109 [DOI] [PMC free article] [PubMed] [Google Scholar]
- 12.Miller B. W., Barber H. B., Barrett H. H., Liu Z., Nagarkar V. V., Furenlid L. R., “Progress in BazookaSPECT: high-resolution dynamic scintigraphy with large-area imagers,” Proc. SPIE 8508, 85080F (2012). 10.1117/12.966810 [DOI] [PMC free article] [PubMed] [Google Scholar]
- 13.Broda H., Gooch V. D., Taylor W., Aiuto N., Hastings J. W., “Acquisition of circadian bioluminescence data in Gonyaulax and an effect of the measurement procedure on the period of the rhythm,” J. Biol. Rhythms 1(3), 251–263 (1986). 10.1177/074873048600100307 [DOI] [PubMed] [Google Scholar]
- 14.Hastings J. W., Gibson Q. H., “Intermediates in the bioluminescent oxidation of reduced flavin mononucleotide,” J. Biol. Chem. 238(7), 2537–2554 (1963). [PubMed] [Google Scholar]
- 15.Reynolds G., Taylor D., “Image intensification applied to light microscopy,” Bioscience 30(9), 586–592 (1980). 10.2307/1308108 [DOI] [Google Scholar]
- 16.Weiss D. G., Maile W., Wick R. A., Steffen W., “Video microscopy,” in Light Microscopy in Biology. A Practical Approach, Hames B. D., ed. (Oxford University Press, 1989). [Google Scholar]
- 17.Hooper C. E., Ansorge R. E., Browne H. M., Tomkins P., “CCD imaging of luciferase gene expression in single mammalian cells,” J. Biolumin. Chemilumin. 5(2), 123–130 (1990). 10.1002/bio.1170050208 [DOI] [PubMed] [Google Scholar]
- 18.Contag C. H., Spilman S. D., Contag P. R., Oshiro M., Eames B., Dennery P., Stevenson D. K., Benaron D. A., “Visualizing gene expression in living mammals using a bioluminescent reporter,” Photochem. Photobiol. 66(4), 523–531 (1997). 10.1111/j.1751-1097.1997.tb03184.x [DOI] [PubMed] [Google Scholar]
- 19.Roda A., Guardigli M., Pasini P., Mirasoli M., Michelini E., Musiani M., “Bio-and chemiluminescence imaging in analytical chemistry,” Anal. Chim. Acta 541(1), 25–35 (2005). 10.1016/j.aca.2004.11.083 [DOI] [Google Scholar]
- 20.Welsh D. K., Noguchi T., “Cellular bioluminescence imaging,” Cold Spring Harb. Protoc. 2012(8), 070607 (2012). 10.1101/pdb.top070607 [DOI] [PubMed] [Google Scholar]
- 21.Ogoh K., Akiyoshi R., May-Maw-Thet T., Sugiyama S., Dosaka Y., Hatta-Ohashi Y., Suzuki H., “Bioluminescence microscopy using a short focal-length imaging lens,” J. Microsc. 253(3), 191–197 (2014). 10.1111/jmi.12109 [DOI] [PMC free article] [PubMed] [Google Scholar]
- 22.Akiyoshi R., Kaneuch T., Aigaki T., Suzuki H., “Bioluminescence imaging to track real-time armadillo promoter activity in live Drosophila embryos,” Anal. Bioanal. Chem. 406(23), 5703–5713 (2014). 10.1007/s00216-014-8000-8 [DOI] [PMC free article] [PubMed] [Google Scholar]
- 23.Lambrechts D., Roeffaers M., Goossens K., Hofkens J., Vande Velde G., Van de Putte T., Schrooten J., Van Oosterwyck H., “A causal relation between bioluminescence and oxygen to quantify the cell niche,” PLoS One 9(5), e97572 (2014). 10.1371/journal.pone.0097572 [DOI] [PMC free article] [PubMed] [Google Scholar]
- 24.Meinhart C. D., Wereley S. T., “The theory of diffraction-limited resolution in microparticle image velocimetry,” Meas. Sci. Technol. 14(7), 1047–1053 (2003). 10.1088/0957-0233/14/7/320 [DOI] [Google Scholar]
- 25.Sengupta D., Miller S., Marton Z., Chin F., Nagarkar V., Pratx G., “Bright Lu2 O3 :Eu thin-film scintillators for high-resolution radioluminescence microscopy,” Adv. Healthc. Mater. 4(14), 2064–2070 (2015). 10.1002/adhm.201500372 [DOI] [PMC free article] [PubMed] [Google Scholar]
- 26.Badr C. E., Tannous B. A., “Bioluminescence imaging: progress and applications,” Trends Biotechnol. 29(12), 624–633 (2011). 10.1016/j.tibtech.2011.06.010 [DOI] [PMC free article] [PubMed] [Google Scholar]
- 27.Hoffmann H., “violin.m - Simple violin plot using matlab default kernel density estimation,” (2015), http://au.mathworks.com/matlabcentral/fileexchange/45134-violin-plot-based-on-kernel-density-estimation/content/violin.m.
- 28.Goda K., Hatta-Ohashi Y., Akiyoshi R., Sugiyama T., Sakai I., Takahashi T., Suzuki H., “Combining fluorescence and bioluminescence microscopy,” Microsc. Res. Tech. 78(8), 715–722 (2015). 10.1002/jemt.22529 [DOI] [PMC free article] [PubMed] [Google Scholar]
- 29.Piston D. W., “Choosing objective lenses: the importance of numerical aperture and magnification in digital optical microscopy,” Biol. Bull. 195(1), 1–4 (1998). 10.2307/1542768 [DOI] [PubMed] [Google Scholar]
- 30.Muzzey D., van Oudenaarden A., “Quantitative time-lapse fluorescence microscopy in single cells,” Annu. Rev. Cell Dev. Biol. 25(1), 301–327 (2009). 10.1146/annurev.cellbio.042308.113408 [DOI] [PMC free article] [PubMed] [Google Scholar]
- 31.Kim T. J., Kim M., Hann S., Trejo J., Hidrovo C. H., “Thermal Characterization of Microheated Microchannels With Spatially Resolved Two-Color Fluorescence Thermometry,” J. Microelectromech. Syst. 24(1), 115–125 (2015). 10.1109/JMEMS.2014.2320998 [DOI] [Google Scholar]
- 32.Inoue S., Spring K. R., Video Microscopy: The Fundamentals (Springer Science & Business Media, 1997). [Google Scholar]


