Abstract
The field of metabolomics continues to witness rapid growth driven by fundamental studies, methods development, and applications in a number of disciplines that include biomedical science, plant and nutrition sciences, drug development, energy and environmental sciences, toxicology, etc. NMR spectroscopy is one of the two most widely used analytical platforms in the metabolomics field, along with mass spectrometry (MS). NMR's excellent reproducibility and quantitative accuracy, its ability to identify structures of unknown metabolites, its capacity to generate metabolite profiles using intact biospecimens with no need for separation, and its capabilities for tracing metabolic pathways using isotope labeled substrates offer unique strengths for metabolomics applications. However, NMR's limited sensitivity and resolution continue to pose a major challenge and have restricted both the number and the quantitative accuracy of metabolites analyzed by NMR. Further, the analysis of highly complex biological samples has increased the demand for new methods with improved detection, better unknown identification, and more accurate quantitation of larger numbers of metabolites. Recent efforts have contributed significant improvements in these areas, and have thereby enhanced the pool of routinely quantifiable metabolites. Additionally, efforts focused on combining NMR and MS promise opportunities to exploit the combined strength of the two analytical platforms for direct comparison of the metabolite data, unknown identification and reliable biomarker discovery that continue to challenge the metabolomics field. This article presents our perspectives on the emerging trends in NMR-based metabolomics and NMR's continuing role in the field with an emphasis on recent and ongoing research from our laboratory.
Keywords: Metabolomics, Quantitation, Isotope tagging, Unknown metabolite identification, qNMR, Biomarker discovery
1. Introduction
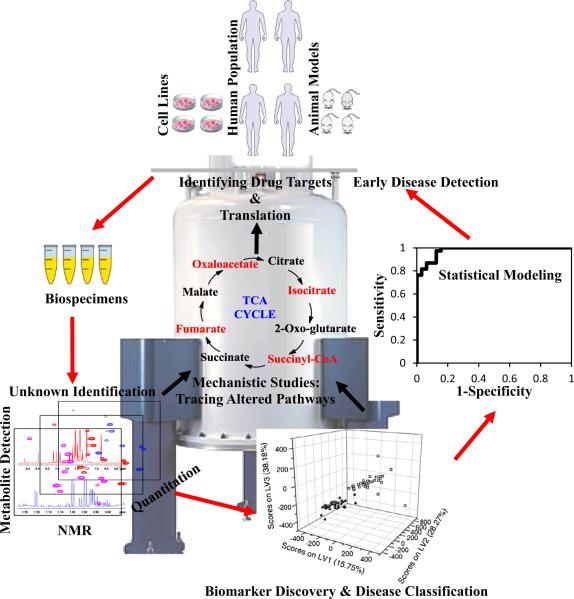
The field of metabolomics, involving the parallel and quantitative detection of large numbers of small molecules in biological systems, offers new avenues for understanding biological phenotypes, deciphering mechanisms, and identifying biomarkers or drug targets for a variety of conditions [1–5] (Fig. 1). Given the powerful attributes of the metabolomics field, applications have spread broadly to numerous areas, from health and disease, food, energy and the environment, etc.; nevertheless, a majority of studies are focused on understanding, preventing, diagnosing, managing (and possibly curing) human diseases. Advanced analytical methods can now be employed to profile a wide variety of biological specimens. The currently detectable metabolome is complex and rich; approximately 30,000 endogenous human body metabolites have been identified thus far, with a majority belonging to various lipid classes [6]. These metabolites represent the downstream products of gene expression and protein action, and thus provide an instantaneous snapshot of biological phenotype. Additionally, while vast progress in genomics and proteomics enables understanding of altered genes and proteins in pathogenesis, a combination of these omics with metabolomics promises a better understanding of disease development, the discovery of new gene functions and drug targets, and improved biological validation of disease mechanisms and biomarkers.
Fig. 1.
Schematic diagram depicting the application of NMR-based metabolic profiling for early disease diagnosis, systems biology research and drug target discovery.
NMR and MS are the most commonly used methods to analyze the metabolome because of their ability to analyze hundreds of metabolites in a single measurement. NMR's unique capabilities and complementarity to MS allow it to play a key role in the multidisciplinary metabolomics field, including a range of methods development and applications. As a result, the number of reported studies has grown rapidly in recent years, though not as quickly as MS (Fig. 2). The high complexity of biological samples and the interest in uncovering, measuring and understanding subtle changes in the metabolome due to the influence of a variety of genetic and environmental factors require new methods for improved detection, unknown identification and quantitation of a large pool of metabolites.
Fig. 2.
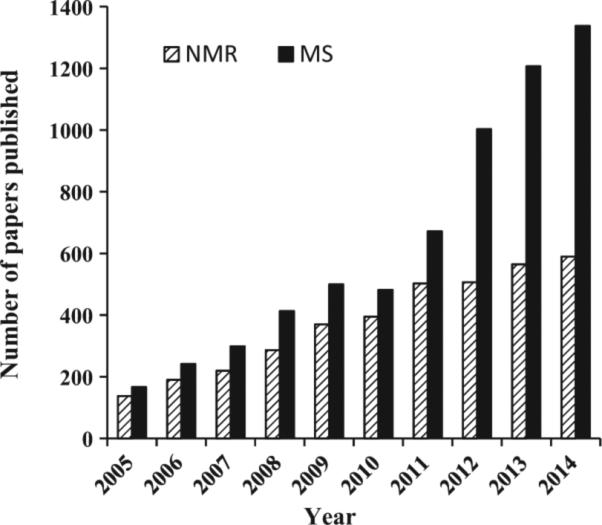
The trend in metabolomics research studies published in the last 10 years using NMR spectroscopy and mass spectrometry [obtained by Web of Science searches using (metabolomic* OR metabonomic*) AND (NMR OR nuclear magnetic resonance); (metabolomic* OR metabonomic*) AND (MS OR mass spectrometry)].
Given this backdrop and current needs in metabolomics, what role does and will NMR spectroscopy play in metabolomics? In this perspective, we hope to answer this question as we describe our efforts and those of others over the past decade to improve NMR-based metabolomics in several areas that address a number of significant bottlenecks in the field. In particular, new approaches to improve the quantitation, resolution, and coverage of the metabolome as well as methods to better integrate NMR with mass spectrometry for biomarker discovery and unknown metabolite identification are discussed. The goal of this perspective is not to review the field, and thus readers are referred to a number of fine reviews of the exciting and expanding field of metabolomics [4,5,7–12]. Instead, we hope to highlight some of the challenges and new developments that will help propel NMR-based metabolomics forward.
2. NMR characteristics for metabolomics and key challenges
NMR spectroscopy exhibits numerous unique and favorable characteristics that are beneficial to the field of metabolomics (see Table 1) [13]. Importantly, (1) NMR is highly reproducible and quantitative; a single internal reference is sufficient for absolute metabolite quantitation over an incredible dynamic range (see Fig. 3) since signals in NMR have the same sensitivity, independent of the properties of the metabolite; (2) a combination of NMR techniques enables the unambiguous identification of structures for unknown metabolites, which is important considering that a majority of the detected metabolites in complex biological mixtures is unknown; (3) NMR enables analysis of intact biofluids and tissues with no need for sample separation or preparation, which is important considering that factors associated with sample preparation and separation contribute to analytical variability and represent a major bottleneck; (4) NMR is non-destructive, which means the sample remains intact after the analysis and can be used for reanalysis at a later time period or analysis using other methods such as MS; (5) NMR possesses unsurpassed capability to trace metabolic pathways and measure metabolic fluxes utilizing isotope labeled substrates; (6) NMR provides unique opportunities to translate in vitro findings to clinical applications in vivo; and, finally, (7) metabolite profiles obtained by NMR are virtually independent of the operator and instrument used, which provides a high degree of reliability to the derived results.
Table 1.
A summary of NMR and MS characteristics relevant to metabolomics studies.
| Characteristic | NMR | MS |
|---|---|---|
| Strengths | • Detects up to hundreds of metabolites in a single measurement • Does not need sample separation • Highly quantitative • Single internal reference is sufficient for absolute quantitation • Highly reproducible • A combination of NMR techniques enables unknown structure determination • Enables high-throughput measurements • Isotope based methods have enhanced the limit of detection • Non-destructive to samples |
• Detects up to thousands of metabolites in a single measurement • Highly sensitive • Highly quantitative using internal standards (1 per metabolite) • Accurate mass can be used to derive empirical formula • Reliable metabolite identification enabled through tandem mass analysis • Enables high-throughput measurements • Wide range of instruments available to detect different types of metabolites and for a variety of experiments |
| Weaknesses | • Relatively less sensitive (Limit of Detection ~1 μM) • Limited spectral resolution • Detects fewer metabolites compared to MS • Difficulty measuring lipids • High field instrument costs |
• Usually requires chromatographic separation (with the exception of lipids) • Less reproducible • Multiple and, often, expensive internal standards are required for absolute quantitation • Difficulty in analyzing salty samples • Identities for a major fraction of detected metabolites are not known • Destructive to samples |
| Complementarities | • Unknown metabolite structure identification is best performed by combining atomic connectivity from NMR and accurate mass from MS • Biomarker discovery studies show that both NMR and MS provide superior performance by combining the “best of the best” biomarkers detected by both platforms • Ability to detect the same metabolites efficiently by NMR and MS using various methods including a smart isotope tagging approach, for example, enables direct comparison of growing NMR and MS data in the literature |
|
Fig. 3.
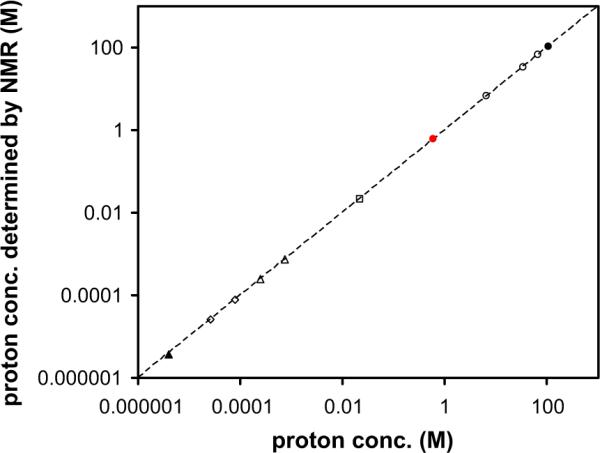
Experimental proton concentrations determined by NMR at 25 °C, for partially deuterated water (circles), sodium acetate (squares) and N,N-dimethylformamide (diamonds, triangles) are plotted against the expected values. The dashed line shows the ideal correlation between experimental and expected values with a slope of 1. Standard deviations are generally too small to be plotted for concentrations larger than 75 μM [reprinted with permission from Ref. [24]].
Despite numerous unique characteristics and advances, however, it is increasingly clear that the complexity of biological mixtures far outweighs the current capabilities of NMR. The limited resolution and sensitivity of NMR, along with the difficulties associated with unknown metabolite identification (particularly for low concentration species) pose a major challenge for unraveling the complexity of biological mixtures. These challenges have restricted both the number and the quantitative accuracy of metabolites analyzed. The number of NMR detectable metabolites in a typical cell, tissue or blood sample ranges from approximately 20 to 60, which is far fewer than the actual number of metabolites present in a biological system. In addition, the standard NMR methods used to determine the structures of unknown species are much more difficult to implement when analyzing complex mixtures.
Furthermore, an altogether different challenge is that metabolite data for the same or similar samples obtained using NMR and MS are often not directly comparable. This is a major bottleneck for biomarker discovery as well as for exploiting the combined strength of the two analytical platforms for unknown metabolite identification. In view of these challenges, there is high demand for the development of new methods to facilitate identification and quantitation of a significantly larger number of metabolites on a routine basis, and to directly compare and combine data from NMR and MS.
3. Metabolite detection and quantitation
An important characteristic that has drawn NMR-based metabolomics to prominence is the ability to analyze intact samples with no need for sample preparation or separation. However, while analysis of intact samples continues to be attractive for samples such as urine, it is increasingly realized that analysis of intact human blood serum or plasma has serious limitations. First, the number of metabolites detected is restricted to ~30 or less, which is far fewer than the actual number of blood metabolites. Metabolites that bind to serum/plasma proteins are either invisible or significantly attenuated in the NMR spectra (Fig. 4); as a result, concentrations of many detected metabolites including important species such as lactate, histidine, tyrosine and phenylalanine, are grossly underestimated [14,15]. In addition, residual macromolecule signals retained in the CPMG spectra of intact serum/plasma often produce distorted baselines, which affect reliable metabolite quantitation. And finally, due to the exchange between protein-bound and free metabolites in solution, transverse relaxation (T2) times become reduced, resulting in significantly broadened NMR peaks and poor quantitative accuracy. Due to such limitations, applications of the vast majority of the NMR studies of intact blood serum/plasma have been restricted to measuring relative peak intensities, instead of absolute concentrations.
Fig. 4.
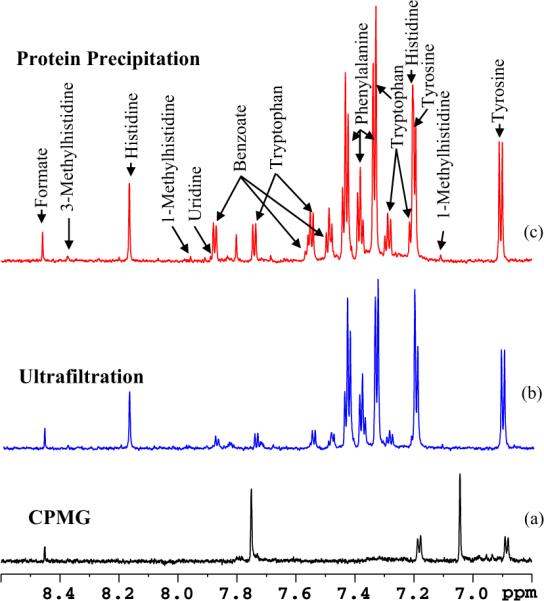
Comparison of the aromatic region of 800 MHz, cryo-probe 1H NMR spectra of the same human serum sample obtained by suppressing protein signals (a) by T2 filtering using the CPMG pulse sequence, (b) by ultrafiltration using a 3 kDa molecular weight cut-off filter and (c) by protein precipitation using methanol (1:2). In (a) most of the metabolite signals are missing or significantly attenuated, while in (b) many metabolites including tryptophan, benzoate and formate are significantly attenuated when compared to (c) [reproduced with permission from Ref. [22]].
Alternatively, several approaches have been made to remove proteins physically using ultra-filtration, solid phase extraction, or protein precipitation using organic solvents such as methanol, acetonitrile, acetone, perchloric acid and trichloroacetic acid [16–19]. For example, a study focused on improving blood metabolite detection using ultra-filtered human plasma from NIST SRM (National Institute of Standards and Technology Standard Reference Material) identified 39 metabolites [20]. Another exhaustive study of ultra-filtered serum, as a part of investigations of the human serum metabolome, identified 49 metabolites [21] (Fig. 5). However, despite the large literature on serum/plasma protein removal that provides numerous options, few quantitative comparisons have been made, thus leaving no clear choice for NMR.
Fig. 5.
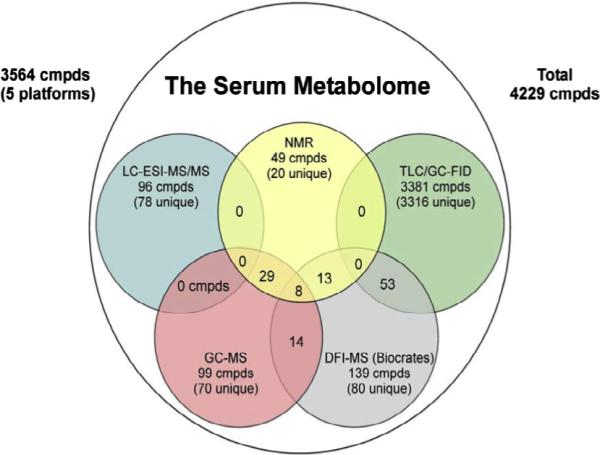
Venn diagram showing the number of serum metabolites detected by global NMR, GC–MS, LC/GC-FID, LC–ESI-MS/MS and MS/MS platforms [reproduced with permission from Ref. [21]].
Focused on a quantitative evaluation, we recently compared ultrafiltration and protein precipitation methods using various organic solvents including methanol, acetonitrile, perchloric acid and trichloroacetic acid [22]. The results clearly show that protein precipitation exhibits superior performance over ultrafiltration for quantitatively recovering blood metabolites from the protein matrix (Fig. 4), and the reduced interference from macromolecular signals allows a dramatic increase in the number of detectable and quantifiable metabolites. We also compared the performance of acetonitrile and methanol, which are used almost interchangeably by many researchers for serum/plasma protein precipitation, by evaluating numerous solvent-to-serum ratios and measuring the absolute concentrations of nearly 60 blood metabolites. The results reveal a surprisingly poor performance for acetonitrile precipitation [23]; in particular, one third of the detected metabolites were attenuated by up to 67% compared to methanol precipitation at the same solvent to serum ratio of 2:1 (v/v). Nearly 2/3 of the metabolites were further attenuated by up to 65% upon increasing the acetonitrile to serum ratio to 4:1 (v/v). The results clearly indicate that methanol precipitation, apart from being more quantitative, is less susceptible to variation caused by different amounts of methanol (Fig. 6). Acetonitrile, on the other hand, deleteriously affects metabolite levels, due to the poor solubility of many metabolites in this solvent, and hence is clearly unsuitable for quantitative analysis of, specifically, hydrophilic blood metabolites. We note that, due to the lack of a comprehensive evaluation of blood metabolite quantitation, acetonitrile is often incorrectly considered to be a better solvent for serum protein precipitation in the metabolomics field.
Fig. 6.
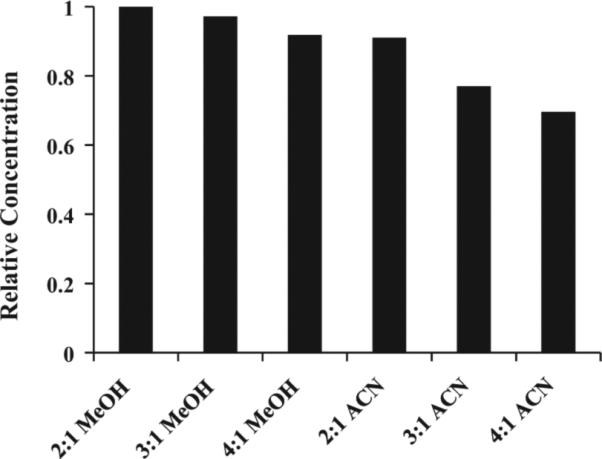
Relative mean concentration values of nearly 60 abundant blood metabolites quantitated using NMR after protein precipitation using methanol (MeOH) or acetonitrile (ACN) at different solvent to serum ratios as indicated. The values are relative to the mean = 1 for MeOH at a 2:1 ratio. Note methanol performs most optimally over a wide range and the methanol to serum ratio of 2:1 provides the best performance [modified from Ref. [23]].
While most quantitation methods in the NMR literature involve introducing an internal or external standard, we introduced an alternative method that uses the solvent itself as the standard, which enables accurate quantitation of metabolites and obviates the need for any external or other internal reference (Fig. 3) [24]. Interestingly, this study demonstrates that the concentration determination is linear over 7 orders of magnitude in NMR, in a range of 4 μM to over 100 M. This linear range is larger than almost all other analytical methods available. Further, the method is robust and fairly indifferent to probe tuning or salt concentration. Fig. 3 demonstrates the results of quantitative analysis of metabolites using water as a solvent, but, similarly, other solvents can easily be used. Factors that are associated with NMR signal receiving efficiency [25], the receive gain function [26], and receiver gain compression [27] have been discussed in detail and provide greater insights into quantitation using such reference-free methods.
Quantitation of metabolites using 2D NMR spectra is more challenging and has been somewhat more limited. A major challenge for absolute quantitation of metabolites using 2D experiments such as HSQC, for example, is that the peak integrals depend on a number of parameters such as RF pulse power, inter-pulse delays, the magnitude of heteronuclear J-couplings, and T1 and T2 relaxation times. Numerous efforts have focused on alleviating this challenge, including calibration curves [28], correction factors calculated from solving the Bloch equations [29], and calculating a “time zero” HSQC spectrum derived by extrapolating the peak intensity back to zero time using a series of HSQC spectra [30]. The latter method requires no need for calibration curves or correction factors for each metabolite; however, this method requires multiple 2D spectra for each sample.
Another issue to consider is the presence of several high concentration species, such as glucose, lactate and others, that overshadow a large number of metabolite signals. We recently introduced a method termed “Add-to-Subtract” that offers a simple avenue for effectively suppressing the dominant (and complicated) signals from glucose, which has a concentration of at least an order of magnitude higher than other metabolites in blood and diabetic urine [31]. In this approach, a small drop of concentrated glucose solution is added to the sample in the NMR tube; the sample is mixed, equilibrated, and then a second spectrum is obtained. A new spectrum is calculated, which is free of any glucose signals, by a careful weighted subtraction of the two spectra obtained before and after addition of glucose. The Add-to-Subtract spectrum thus obtained enables easier identification of low intensity signals that otherwise are masked (see Fig. 7). The background subtraction approach can be used for a variety of purposes, such as improving the spectral inputs to multivariate analysis, for example [31]. Generally, a challenge for multivariate statistical methods such as principal components analysis (PCA) is that strong background signals often dominate the outcome and thus low concentration metabolites that potentially have important biological meanings are often masked or suppressed. Here, the high glucose background in the NMR spectra of blood serum/plasma and diabetic urine dominates the PCA results. The removal of glucose (or any other high intensity) signals benefits the identification and quantification of low level metabolites, and can potentially lead to the discovery of additional key metabolites.
Fig. 7.
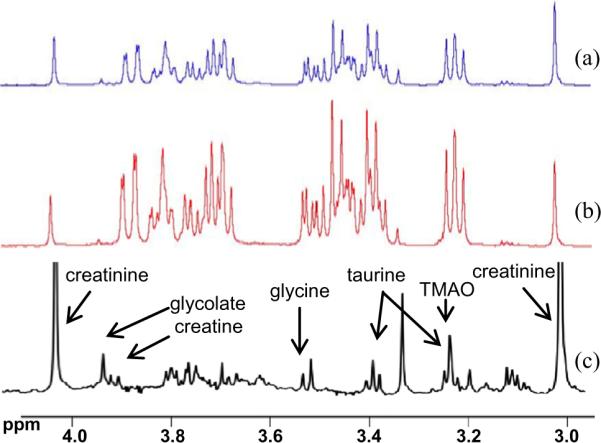
“Add to Subtract” approach for glucose peak removal: (a) 1H spectrum of urine with dominant glucose (added to mimic diabetic urine); (b) spectrum obtained after adding a small drop (a few μL) of external glucose to the biological sample in (a); and (c) “glucose free” spectrum obtained using “Add to Subtract” approach. Note that the vertical scale is enhanced for the spectrum in (c) to highlight clear identification of low intensity peaks that were buried underneath the abundant glucose peaks [modified from Ref. [31]].
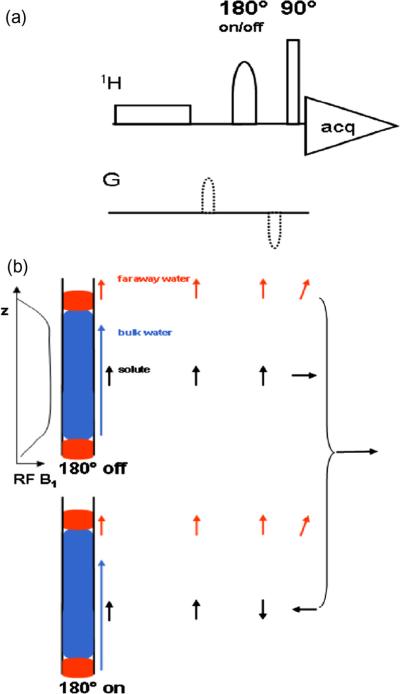
To date, although a variety of 1D and 2D NMR techniques are employed for metabolite detection and quantitation, traditional 1D NMR techniques continue to be the workhorse methods for routine metabolite profiling. In particular, owing to the ease of analysis and high-throughput capabilities [32,33], the 1D NOESY and CPMG pulse sequences with water signal suppression are still the most popular NMR experiments. 1D NOESY is useful for biofluids such as urine and extracted metabolite mixtures that are generally devoid of macromolecules, and the CPMG experiment is often used for samples such as blood serum/plasma to attenuate the large and broad signals that result from high concentrations of macromolecules such as proteins and lipids. The classical water presaturation method is still the most commonly used approach; nevertheless, a number of newer sequences including presaturation utilizing gradients and echoes, excitation sculpting [34] and the combinations of gradient and weak rf pulses such as the WET sequence [35], have been demonstrated to provide improved suppression. A 1D NMR pulse sequence that filters small molecules based on differences in their diffusion coefficients has also been demonstrated [36]. We introduced two sequences, WET180 and Pre-SAT180 (Fig. 8) [37,38], which provide further improvements in water suppression. Essentially, these two methods compensate for the deleterious effects of signals from “far away” water that are otherwise hard to suppress. Results of these approaches show the full retention of signal intensity and selectivity, good phase properties, and high tolerance to pulse missettings.
Fig. 8.
(a) Pre-SAT180, a pulse sequence to effectively suppress the faraway water signal. (b) A schematic diagram shows the faraway water region and how its suppression is achieved. Arrows after each pulse indicate the contribution to the transverse magnetization from the different portions of the sample, including bulk solvent, faraway water and the solute. Top and bottom portions of the figure indicate inversion pulse on or off conditions. Receiver phase shifting creates the difference spectrum with improved solvent suppression [reproduced with permission from Ref. [38]].
4. Unknown metabolite identification
The incredible complexity of biological samples is increasingly being realized as a result of advances in analytical instrumentation and their ability to probe such samples more sensitively and deeply. For example, a recent investigation by MS reported the detection of nearly 30,000 metabolite features in blood [39]. Although, due to significant redundancy, each feature in the MS spectrum does not correspond to a unique metabolite, such high feature numbers are another indication of the high complexity of biological mixtures. Unknown metabolite identification from the data of such samples is a major challenge for the metabolomics field. Current peak identification capabilities of MS typically leave more than 2/3 of globally detected metabolite features unidentified. Similarly, for NMR, unknown metabolite identification is an important challenge. Numerous chemical shift databases help immensely to narrow peak assignments to a relatively small list of potential metabolite hits. However, choosing the correct metabolite that provides an unambiguous peak assignment, especially for low concentration metabolites, is a challenge because most of these metabolite peaks are partially or completely overlapped by more abundant metabolite signals.
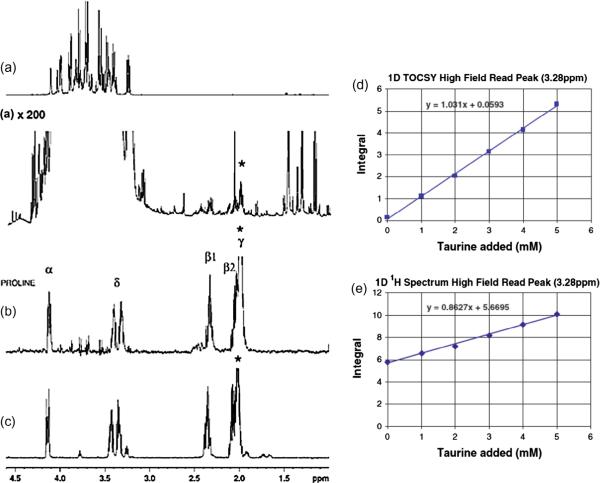
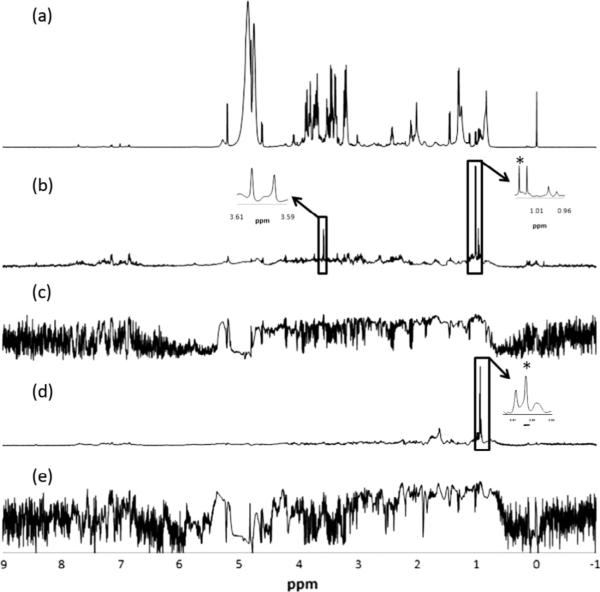
Numerous efforts have been focused on identifying unknown metabolites in the complex 1D and 2D NMR spectra. For 1D, selective TOCSY is one such approach that has been shown to be useful for unraveling the complexity of NMR spectra. Selective TOCSY opens avenues for both unknown metabolite identification as well as reliable metabolite quantitation [40–42]. The ability of selective TOCSY to connect peaks that are part of the same coupled network of spins arising from a single metabolite results in multiple peaks that are free of interferences and thus aids significantly in positive identification. An example of the application of selective TOCSY to isolate low concentration metabolites from complex biological mixtures is demonstrated in Fig. 9a–c. TOCSY can also be used to improve the quantitation of highly overlapped metabolites in complex mixtures, as we demonstrate in Fig. 9d and e, for the case of taurine in urine [40]. And an additional advantage of selective TOCSY is that it enables the identification of low concentration metabolites that may be important for distinguishing sample classes even when they occur in the presence of more dominant, high intensity signals that do not provide such distinguishing capabilities. Moreover, we have shown that a combination of selective TOCSY with HPLC fractionation offers additional advantages for unknown identification, especially when dealing with extremely complex NMR spectra [43].
Fig. 9.
Left: (a) 1D proton spectrum of honey acquired using 1D NOESY sequence with presaturation for water suppression; (b) selective TOCSY spectrum of honey with selective excitation on the proline γ peak (1.98 ppm); (c) selective TOCSY spectrum for a mixture of 10 mM l-proline and 10 mM l-arginine with selective excitation on the proline γ peak (1.98 ppm). Note, in (b) low concentration proline peaks are clearly isolated from the complex honey spectrum using selective TOCSY method. Right: Titration of taurine into a human urine sample, showing (d) integral of 1D TOCSY spectrum around 3.28 ppm, and (e) integral of 1D proton spectrum around 3.28 ppm. Note, in (e) taurine is overestimated due to overlap in the 1D 1H spectrum, while it can be measured accurately using selective TOCSY as shown in (d) [modified from Refs. [40,41].
Combining an array of 1D/2D NMR experiments, database searches, and spiking with authentic compounds, we recently reported the unambiguous identification of nearly 70 blood metabolites, a large number (nearly 1/3) of which had not been previously identified in the NMR spectra of blood [23]. Further, experimental protocols and comprehensive peak annotations have been provided to take advantage of the high reproducibility and quantitative nature of NMR, and to mitigate against the sensitivity of NMR chemical shifts to altered sample conditions. Such details enable easy reproduction of NMR spectra and serve as a visual guide for identification of the enhanced pool of blood metabolites for routine applications. Importantly, this protocol enables even non-expert NMR users to easily identify and quantify blood metabolites, thereby allowing effective use of this tool. This advance represents a significant step forward, considering that assigning unambiguous peaks for many metabolites with low (≤few μM) concentrations is especially challenging, since many of these peaks are often buried underneath abundant metabolite signals.
Unknown metabolite identification in human urine is generally met with added challenges. Urine provides a rich source of information as it generally contains a significantly higher number of NMR detectable metabolites compared to serum/plasma. However, the high number of metabolites, coupled with their vast concentration range (~106), results in extremely complex NMR spectra. Contributions from numerous factors including diet, medications, personal habits such as physical activity or smoking, gender, age, gut microbe diversity, as well as genetics, affect the metabolome and add to the spectral complexity [44]. In fact, due to such factors, urine from even the same individual exhibits significant variability depending on the time of the day of urine collection, although the basic metabolome is preserved over time [45]. Further, varied pH (approximately from 5 to 8) and salt concentration cause significant peak shifts for many metabolites, especially, for those with functional groups with pKa's near physiological pH. Although efforts have been made to maintain the same pH for all samples before NMR analysis, achieving such conditions is often challenging [46,47]. Due to these reasons, the number of metabolites identified and quantified in urine has often been restricted to about 50 or less. Notably, a more recent study presents the identification of a surprisingly high number of metabolites; using Chenomx software and spiking with authentic compounds, a total of 209 urine metabolites with an average of 167 ± 19 identified metabolites per sample has been reported [48]. The number of metabolites thus identified by NMR is far higher than that obtained from even the more highly sensitive method of GC–MS. However, considering the high complexity of the urine NMR spectrum and the sensitivity of chemical shifts to factors such as pH and salt concentration, routine analysis of such a high number of urine metabolites using 1D NMR is still a challenging task. Improvements in the NMR analysis of urine would greatly benefit the metabolomics community.
4.1. 2D methods
There has been increased interest to identify metabolites using 2D NMR by exploiting the resolution offered by the second dimension. Heteronuclear 2D experiments, especially the 13C–1H HSQC experiment, provide excellent spectral resolution along the indirect heteronuclear (13C) dimension as the impact of peak redundancy is not as large as that seen in homonuclear 2D experiments. Only a single peak is observed for each carbon (other than quaternary carbons), and the broad chemical shift range (>200 ppm) improves resolution. Despite the low natural abundance of the heteronuclei, which contributes to increased experimental time and makes the use of HSQC challenging for high-throughput applications, numerous metabolite identification [49,50] and quantitation strategies [28,30] have been reported, which indicate the importance of HSQC in metabolite identification. Databases such as HMDB (Human Metabolome Database) [6], BMRB (Biological Magnetic Resonance Data Bank) [51], MMCD (Madison Metabolomics Consortium Database) [49] and PRIMe (Platform for RIKEN Metabolomics) [52] are immensely useful in the identification of unknown metabolites using HSQC spectra. A publicly available, semiautomated software tool, MetaboMiner, can identify metabolites from 2D spectra by making use of a spectral reference library to automatically match peaks and identify compounds [53]. More recently, an improved query algorithm named COLMAR (Complex Mixture Analysis by NMR), which helps to identify metabolites based on a database that combines the spectral data from BMRB and HMDB, has been shown to achieve higher performance in terms of sensitivity and specificity than other tools [54]. Separately, there have been efforts to overcome the limitations of low natural abundance by using uniform 13C labeling, and the recent study by the RIKEN group to identify over 200 plant metabolites currently stands as an important benchmark [55]. Metabolites in the spectra of uniformly 13C-labeled mixtures can be identified by combining 13C–13C TOCSY spectrum with techniques such as DemixC [56] or DeCoDeC [57]. The DeCoDeC technique has also been used to identify 1D traces of individual metabolites using other heteronuclear experiment such as 2D 13C–1H HSQC-TOCSY or 2D planes using the combination of 2D 13C–1H HSQC-TOCSY and 2D 13C–1H HSQC experiments [57]. Further development of 2D methods that can help unravel the complex metabolome of biological samples presents a great opportunity, one that is sure to be well received by the metabolomics community.
4.2. Correlation and related statistical methods
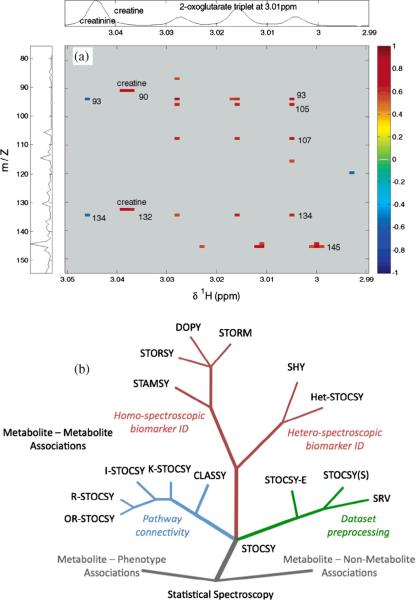
Correlation approaches have attracted major interest for their ability to reduce NMR spectral complexity and identify peaks that belong to the same metabolite. STOCSY (statistical total correlation spectroscopy) generates correlation coefficients between every pair of 1D NMR peaks across multiple spectra, and metabolites can then be identified based on peaks showing high correlations [58–62]. A large number of variants of STOCSY have been developed for compound identification, data preprocessing, and metabolic pathway analysis (Fig. 10). For example, STORM (subset optimization by reference matching), a variant of STOCSY, aims to improve structural correlations using reduced spectral subsets containing smaller numbers of samples than the number of variables [63]. Another approach, SHOCSY (homogeneous cluster spectroscopy), reduces the variation within biological classes by selecting subsets of homogeneous 1H NMR spectra that contain specific spectroscopic metabolic signatures related to each biological class in a study [64].
Fig. 10.
(a) An example of correlation of NMR and MS heterospectroscopic (SHY) data for unknown identification. And (b) statistical spectroscopy family tree. Branches in the tree show different variants of statistical spectroscopic tools used for compound identification, data preprocessing, and metabolic pathway analysis [reproduced with permission from Refs. [60,61]].
Alternatively, Covariance NMR [65] uses a statistical calculation to generate a high resolution spectrum similar to that obtained in the direct dimension using a small number of increments in the indirect dimension, which can potentially save up to an order of magnitude in data acquisition time. Indirect dimension data are processed using covariance calculations instead of Fourier transformation, resulting in a reduced data acquisition time for 2D NMR experiments without compromising the resolution.
We introduced a novel statistical approach based on peak ratios that is complementary to the correlation and covariance approaches. This method, RANSY (Ratio Analysis of Nuclear Magnetic Resonance Spectroscopy), offers new avenues for metabolite identification in complex mixtures by facilitating the isolation of peaks from the same metabolite [66] (Fig. 11). RANSY works on the principle that the intensity ratios between NMR peaks from the same metabolite are fixed and identifies the peaks of a specific metabolite on the basis of peak height or integral ratios. Peak ratios derived from a set of NMR spectra are divided by the ratios’ standard deviations across a sample set to generate the individual RANSY spectrum:
where Pi is an individual peak intensity, Pd is the driver peak used across the spectrum (usually a peak of interest for a particular metabolite), and σid is the standard deviation of the peak ratio across the different spectra. The fixed ratios of NMR peaks arising from the same molecule lead to small σid and thus large RANSY values. RANSY was demonstrated for both 1D and 2D NMR spectra and compares quite favorably to correlation methods. For example, RANSY can identify additional peaks from valine and leucine (Fig. 11b and d, respectively), whereas correlation is not nearly as able to identify such related peaks (Fig. 11c and e, respectively). More recently, the RANSY principle was extended to identify metabolites using mass spectral data [67]. In this approach, called RAMSY (Ratio Analysis of Mass Spectrometry), mass fragment peaks for the same metabolite were identified using a single mass chromatogram. The RANSY and RAMSY methods provide a powerful approach for reducing the interference of peaks that arise from other metabolites and thus promise significant improvement for unknown metabolite identification. The RANSY approach is also potentially useful for combining NMR and MS (heterospectroscopic) data, again for improved metabolite identification, and work is in progress along these lines. We anticipate that new statistical approaches will continue to develop and help to address the hallenging metabolite identification problem.
Fig. 11.
1H NMR spectrum of serum (a), obtained using the CPMG pulse sequence; (b) selective detection of valine from the serum 1H NMR spectrum by RANSY. The identified peaks around 3.6 ppm are from the α-CH proton; (c) selective detection of valine from the serum 1H NMR spectrum by statistical correlation; (d) selective detection of leucine from the complex serum 1H NMR spectrum by RANSY. The identified multiplet around 1.70 ppm is from the β-CH2 and γ-CH protons; (e) selective detection of leucine from the complex serum 1H NMR spectrum by statistical correlation. The driving peaks are indicated by asterisks [reproduced with permission from Ref. [66]].
5. Expanding the metabolite pool using isotope labeling strategies
The use of isotope labels provides an exciting capability to increase the number of NMR detectable metabolites that results from improved resolution and sensitivity. Both in vivo and ex vivo isotope labeling have dramatically improved the ability to investigate metabolic mechanisms, as well as to identify and accurately quantify low concentration metabolites in biological samples. In vivo isotope labeling has largely been focused on targeting altered metabolic pathways to better understand the composition and origins of various metabolic products from different pathways, and to measure their fluxes [68]. Additionally, the use of in vivo isotope labeling for enhancing sensitivity and resolution is gaining increased interest [55,69]. For such applications, metabolites are labeled globally with isotopes such as 13C by growing cells, for example, in media supplemented with isotope labeled substrates and detected generally using 2D NMR experiments. Such non-selective isotope labeling, apart from being able to detect hundreds of metabolites, enables acquiring homonuclear (as well as enhanced heteronuclear) experiments involving labeled nuclei and provides new avenues for metabolite identification. Numerous efforts have been made in this direction, where it has been shown that organisms including bacteria and yeast, and even plants can be fully 13C-labeled, and information on a couple of hundred metabolites can be derived using 13C–13C 2D NMR experiments. Moreover, uniform 13C-labeling allows the determination of the carbon backbone topology of unknown metabolites as a first step toward structure determination, which is much more difficult using 1H NMR alone [70]. Quantitation of metabolites using such 2D experiments is possible, even without the need for internal standards [71].
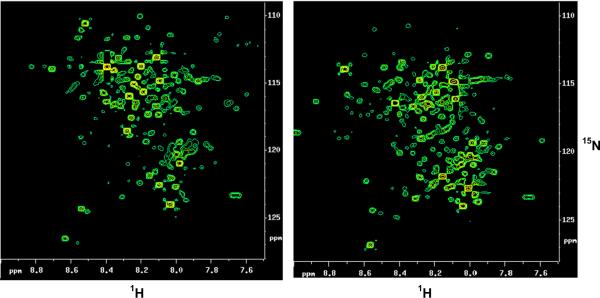
Ex vivo isotope labeling has provided new avenues to enhance the pool of quantifiable metabolites. Here, selective detection of a specific class of metabolites offers opportunities for systematically unraveling the complexity of biological mixtures and reliably identifying and quantifying large numbers of metabolites (Fig. 12). This is important since reliable detection and quantitation of many metabolites across a larger number of metabolic pathways is becoming increasingly important as a means to better understand various biological processes. Owing to their wide chemical shift dispersion compared to 1H, we have used heteronuclei such as 13C, 15N and 31P to tag metabolites, which offers benefits in terms of resolution and sensitivity [72–76] (Fig. 13). Inverse 2D NMR detection of such isotope tagged metabolites through the naturally sensitive 1H spin provides improved resolution and better sensitivity compared to the detection of non-labeled metabolites. A number of methods for the selective detection of different metabolite classes based on functional groups has been developed. Amino-group containing metabolites have been tagged with 13C-isotope based acetylation or formylation reactions and the tagged metabolites are detected using 1H–13C 2D NMR experiments with enhanced resolution and sensitivity [72,73]. Carboxyl-group containing metabolites, tagged with a 15N-isotope labeled ethanolamine tag, have been detected using 1H–15N 2D NMR [74] (Fig. 14). An important aspect of such tagging approaches is that, unlike the conventional 1H NMR, a single peak is generally observed for each tagged metabolite. The resulting spectral simplification, combined with the effective suppression of non-tagged metabolites, significantly adds to the improved resolution and NMR sensitivity, and allows the detection of over a hundred metabolites from a single class of compounds. Importantly, since the magnetic characteristics of the detected pairs of nuclei from the tag (i.e., the J-couplings and relaxation times) are very similar for different tagged metabolites, relative peak area is a direct measure of relative concentration. A single internal reference is sufficient for the determination of absolute concentrations of metabolites with high accuracy. The tagged metabolites are demonstrated to exhibit excellent reproducibility and good linearity with coefficients of regression (R2) greater than 0.99 [74]. Further, 15N-labeled metabolites could be detected with concentrations as low as 8 μM (signal to noise ratio (SNR) ~3) using an 8 min 2D experiment at 800 MHz (without cryoprobe detection). Due to many advantages of this approach, new isotope tags that offer novel avenues to exploit the combined strength of NMR and MS are also being developed [77] (vide infra).
Fig. 12.
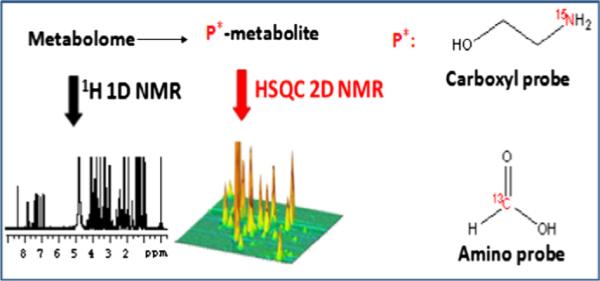
Schematic diagram for ex vivo isotope tagging of metabolites in complex biological mixture and detection using 2D NMR with enhanced resolution and sensitivity.
Fig. 13.
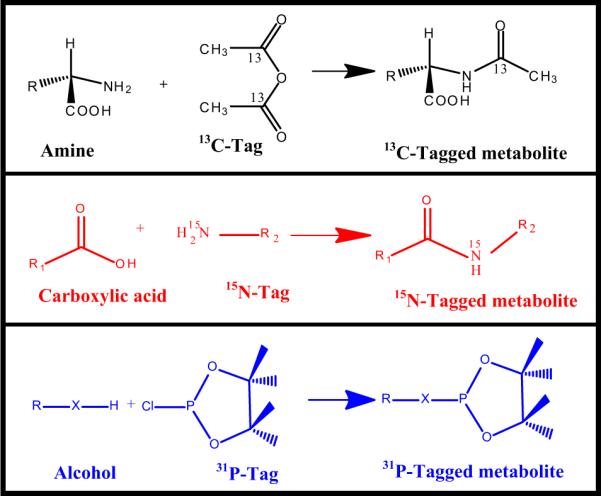
Reaction schemes for chemical derivatization using 13C, 15N or 31P tags to target amine, carboxylic acid or alcohol metabolites in complex biological mixtures to enable NMR detection with enhanced resolution and sensitivity [modified from Refs. [72,74,75]].
Fig. 14.
2D 1H–15N HSQC spectrum of human urine (left) and serum (right) obtained after tagging carboxyl-containing metabolites with 15N-ethanolamine. Nearly 200 metabolite signals are detected and a large number of these have been identified by comparing the chemical shifts with those of standard metabolites derivatized separately [reproduced with permission from Ref. [74]].
6. Micro-coil NMR
Micro-coil probes offer additional sensitivity for NMR detection of metabolites and are especially useful for mass limited samples [78–84]. Small coil volumes combined with their solenoidal geometry contribute to significant signal enhancement compared to the conventional probes. Considering their potential utility in the metabolomics field, numerous efforts in our laboratory and others were focused on developing and testing micro-coil probes with different sample volumes and with single, dual and even quadruple sample coils (Fig. 15) [78–81,85–87]. We have shown that susceptibility matched plugs and zero susceptibility wire offer volume efficiency and improved magnetic field homogeneity [81,82]. Liquid chromatography often used for separating metabolites from complex mixtures is invariably associated with mass limited conditions, and thus a number of such applications have demonstrated the utility of micro-coil probes using direct online detection [88,89], after online pre-concentration [90,91] or after offline pre-concentration [84]. Commercially available micro-coil probes with automation have also been demonstrated to be suitable for high-throughput and routine metabolomics applications [92]. While micro-coil NMR offers superior sensitivity for mass limited samples, it is important to be cautious while concentrating samples before performing micro-coil NMR. This is because metabolites with limited solubility and sample matrices with high salt or protein concentration will adversely impact both the relative and absolute concentrations of metabolites. An evaluation of the effect of concentrating the commonly used serum and urine samples was made recently, and indicated that the sensitivity improvement does not follow an anticipated linear increase and is dependent on both the metabolite and sample matrix [83]. Nevertheless, micro-coil NMR approaches remain attractive given the precious nature of many biological samples and the need to perform detailed analyses on these samples, such as for unknown identification.
Fig. 15.
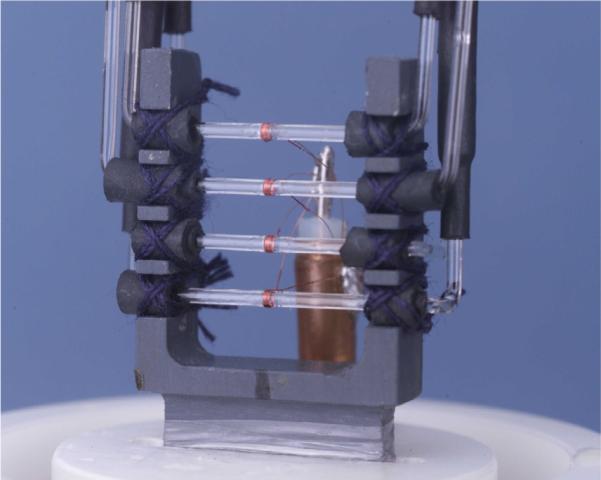
Four-coil Multiplex NMR probe constructed with solenoidal micro-coils optimized for detection of small volume, mass limited samples [reproduced with permission from Ref. [87]].
7. Hyperpolarization in NMR
Hyperpolarization methods such as optical pumping of 3He or 129Xe, parahydrogen induced polarization (PHIP) and dynamic nuclear polarization (DNP) boost the nuclear polarization, enhance sensitivity and enable real time monitoring of metabolism in vivo. In particular, PHIP and DNP are shown to be useful for hyperpolarizing nuclei such as 13C or 15N in various substrates and detecting their downstream products. Infused hyperpolarized substrates undergo metabolic transformation in vivo and the transformed metabolic products that remain highly polarized are detected with high sensitivity. Common among the studies that employ PHIP is the PASADENA (parahydrogen and synthesis allow dramatically enhanced nuclear alignment) [93,94]. Apparently, PHIP offers a fast preparation step, of the order of 1 min. However, this method is restricted to unsaturated substrates for molecular addition of parahydrogen and hence important substrates such as 13C-pyruvate are not amenable to hyperpolarization by this method. There have been efforts focused on alleviating this bottleneck; for example, potassium 13C-phosphoenolpyruvate has been used to obtain hyperpolarized 13C-lactate, which is metabolically linked to 13C-pyruvate [95]. DNP, on the other hand, uses paramagnetic centers to transfer polarization from electron spins to neighboring spins of the substrate [96,97]. DNP can be used to hyperpolarize metabolites with a wide range of molecular structure. A promising method for metabolism studies is the dissolution DNP approach, wherein the solid sample is dissolved in an appropriate solvent after hyperpolarization occurs and transported into a high resolution NMR spectrometer [98]. Dissolution DNP is used in many occasions using a wide range of substrates [99]. DNP combined with the fast acquisition method proposed by Frydman enables sub-second acquisition of 2D NMR spectra [96]. However, the long hyperpolarization preparation time, of the order of 1 h or more, and the need for an external (expensive) polarizer are major drawbacks that limit routine applications of the DNP. Sensitivity enhancement is always attractive for NMR, though further technology advances are needed to allow the investigation of a broader range of metabolites and their pathways.
8. NMR of tissue
An important capability of NMR is that it provides a unique opportunity to profile metabolites from the intact tissue, nondestructively, using high resolution magic angle spinning (HR-MAS) techniques [100]. Tissue metabolic profiles represent a sensitive method for detecting disease biomarkers owing to the close association of the tissue with disease pathologies. HR-MAS provides highly resolved, liquid-like spectra of intact tissue samples, thereby offering opportunities for investigating metabolic mechanisms, as well as for disease diagnosis and prognosis. Importantly, the tissue can be recovered after NMR experiments and can be used for other studies such as proteomic and genomic analysis. Current technological advancements in HR-MAS NMR enable analysis of as little as a few nano-grams of tissue [101]. Such capabilities, combined with minimal sample preparation and fast data acquisition, promises metabolic profiling of biopsied tissue for translation to clinical applications. In fact, studies have shown that HR-MAS NMR of core needle biopsy tissue can predict tumor aggressiveness prior to surgery in breast cancer patients [102]. Though underutilized and underappreciated as a technique in metabolomics, HR-MAS NMR provides a number of promising opportunities that nicely complement the analysis of extracted metabolites by NMR and MS.
9. Exploiting the combined strengths of NMR and MS
In view of the complexity of biological samples, there is increased interest in combining NMR and MS methods to establish structures for numerous unknown metabolites, to better interpret biological function and mechanisms, and to improve biomarker discovery. A major hurdle generally encountered in the analysis of samples using NMR and MS is that the metabolite data are often not directly comparable, which continues to be a significant challenge in the field. This challenge prevents drawing meaningful conclusions from the vast amount of metabolite data existing in the literature and limits exploitation of the combined strengths of NMR and MS in metabolomics (see Table 1). The main contributing factors for this bottleneck are the limited NMR sensitivity, complex spectral signatures, variable MS ionization efficiency, and ion suppression (in LC-MS) that can cause attenuated or even missing metabolite peaks. Numerous approaches are being attempted, including the use of statistical methods and/or databases for improved structure or biomarker identification.
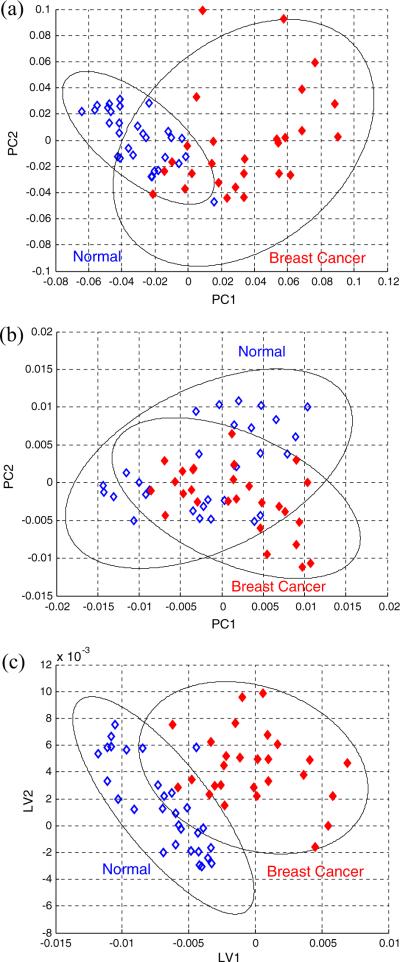
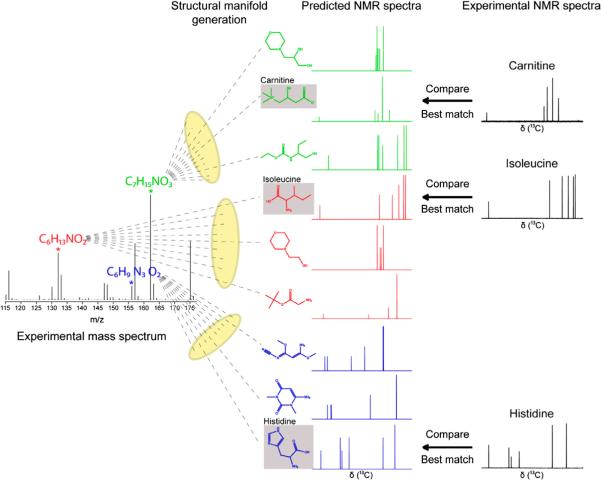
Standard or even new statistical approaches can be used to combine NMR and MS data, as we have shown using a combination of NMR and DESI (desorption electrospray ionization mass spectrometry)-MS [103] or DART (direct analysis in real time)-MS methods [104]. In the former study, results obtained from the two techniques were combined in 3D PCA plots to obtain a common list of metabolites associated with inborn errors of metabolism (IEM). In a new approach, NMR and DART data were combined using the NMR PCA outputs (continuous score values) to describe patient status, instead of the binary values of 1 for breast cancer and 0 for normal subjects. This information was then used for partial least squares discriminant analysis (PLS-DA) of the DART data. Using this approach, significant improvement in distinguishing metabolite profiles between cancer patients and controls was achieved (Fig. 16) [104]. Other approaches to combine NMR and MS data, such as utilizing multiblock principal component analysis (MB-PCA) and multiblock partial least squares (MB-PLS) have been recently demonstrated [105]; in this case, it provides significant improvement in the mechanistic understanding of dopaminergic cell death. Using a correlation approach called SHY (statistical heterospectroscopy), it was shown that NMR and MS data could be combined to enable the detection of new metabolites in complex mixtures [106] (Fig. 10). SHY relates peaks (either NMR or MS m/z peaks) for the same metabolite based on intrinsic correlation between peaks from the two spectroscopic platforms. Recently, a novel database approach combining MS with NMR for the identification of unknown metabolites in complex metabolite mixtures was introduced [107]. In this approach, a list of feasible structures based on the empirical chemical formula derived from accurate MS data is first generated, and then predicted NMR spectra for all structures are compared with the experimental NMR spectra to filter the list and identify the correct metabolite (Fig. 17).
Fig. 16.
Score plots from the results of PCA of (a) NMR and (b) DART-MS spectra of the same human serum samples; and (c) improved results obtained by combining NMR and DART-MS data in which PC1 results from NMR are used as the input for the PLS-DA analysis of the DART-MS data. Open diamonds represent normal samples and red solid diamonds represent breast cancer samples. Ellipses in the score plots illustrate the 95% confidence level [modified from Ref. [104]].
Fig. 17.
Schematic representation of the strategy for the identification of metabolites in complex metabolomic mixtures by the combined use of mass spectrometry and 1D NMR spectroscopy [reproduced with permission from Ref. [107]].
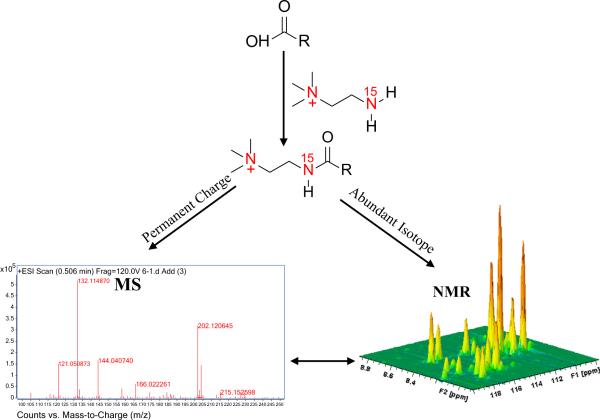
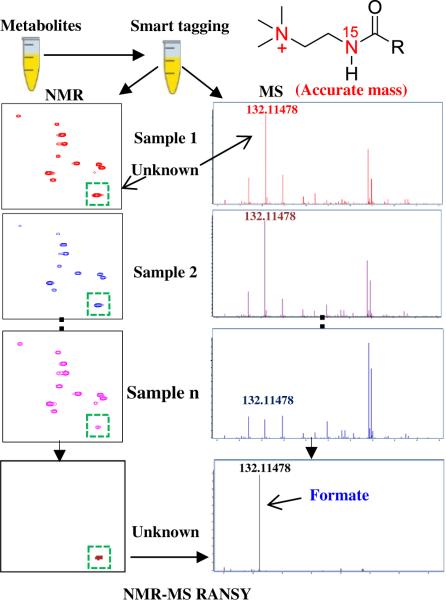
Focused on more easily detecting and quantitating the same metabolites reliably using NMR and MS, we recently developed a new “smart tag,” approach that uses 15N-cholamine [77]. This isotope tag was designed to possess duel characteristics: (1) an NMR sensitive heteronuclear isotope with good chemical shift dispersion, and (2) a permanent charge that improves MS sensitivity (Fig. 18). The 15N-cholamine smart tag enables enhanced resolution and sensitivity for NMR detection similar to that obtained for 15N-ethanolamine (Fig. 14). Additionally, the permanent positive charge enhances the sensitivity of MS detection by up to three orders of magnitude by converting negatively ionizing organic acids to positively charged ions that result from the quaternary nitrogen in the tag [77]. By combining the individual strengths of the 15N label and permanent charge, the smart isotope tag facilitates effective detection of the carboxyl-containing metabolome by both NMR and MS methods. The smart tag approach opens avenues for comparing and correlating the data from the two analytical platforms, for exploiting their combined strengths in biomarker discovery, and for unknown metabolite identification as demonstrated in Fig. 19, in which cholamine tagging is combined with RANSY to connect NMR peaks with accurate MS data. It is anticipated that many more approaches will be developed to explore and exploit this rich area of multiplatform, multidimensional data space.
Fig. 18.
Schematic figure illustrating the “smart isotope tag” approach used to detect the same metabolites using NMR and MS with high sensitivity. Tagging carboxyl-containing metabolites with 15N-cholamine enables their detection by both NMR and MS with high sensitivity [reproduced with permission from Ref. [77]].
Fig. 19.
Unknown metabolite identification using a “smart tag” and RANSY: Efficient detection of the same metabolite by both NMR and MS is enabled by the smart tag, while RANSY connects the NMR and high resolution MS data for improved unknown identification.
10. Biomarker discovery and translation
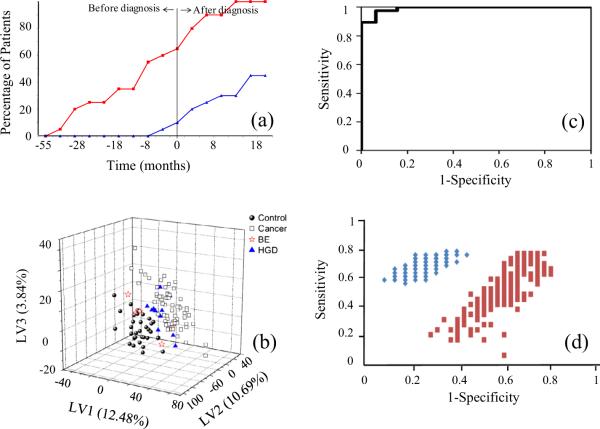
In response to the growing need for improved diagnostic tests and new therapies, many biomarker discovery efforts are being made for translational applications focused on early disease detection, therapy prediction and prognosis, treatment monitoring and recurrence detection, as well as the important area of therapeutic target discovery. Numerous human diseases including inborn errors of metabolism, diabetes, cardiovascular disease, neurological diseases and cancer have been the targets of biomarker discovery efforts [4,108–111]. Our own work in biomarker discovery has mostly focused on identifying potential metabolite biomarkers for various types of cancers. For example, we have used NMR-based metabolite profiling to identify promising serum metabolite biomarkers of hepatocellular carcinoma [112], and pancreatic cancer [113]. Using a combination of NMR and MS analysis, a panel of serum biomarkers consisting of amino and organic acids was identified for the early detection of breast cancer recurrence [114]. Separately, a combination of NMR and MS detected biomarker candidates were identified that can predict response to neoadjuvant chemotherapy for breast cancer [115]. Similarly, biomarkers for esophageal cancer have been identified using NMR or in combination with MS [116,117]. See Fig. 20 for examples of these studies.
Fig. 20.
(a) Percentage of breast cancer recurrence patients correctly identified using an 11-marker model (red squares) and CA 27.29 (blue triangles) as a function of time for all recurrence patients (modified from Ref. [114]); (b) 3D PLS score plot that distinguishes among normal subjects, Barrett esophagus (BE), high-grade dysplasia (HGD) and esophageal cancer patients (Reproduced with permission from Ref. [117]); (c) ROC curve for a 12-metabolite NMR-based statistical model for detecting pancreatic cancer (modified from Ref. [113]); (d) Monte-Carlo cross validation (MCCV) results for a PLS-DA model developed using metabolites to discriminate hepatocellular carcinoma (HCC) from hepatitis C (HCV) infection. Each blue diamond represents an iteration of the true model; each red square represents an iteration of the permutation model [Reproduced with permission from Ref. [115]].
In order to translate the discovered biomarkers to clinical use, a number of validation steps are needed [4,118]. A first step typically involves pre-validation of the putative biomarkers to reduce the number of false positive biomarker candidates, and to assess the overall accuracy of initial multivariate models. Multivariate models are typically cross-validated either by splitting the data into a training and testing set, or by using a leave-n-out procedure, with typically 1% < n < 30% for n samples. The models are then evaluated by determining the diagnostic sensitivity and specificity, or more generally using a receiver operative characteristic (ROC) curve (Fig. 20c) to describe overall performance. The robustness of models can be tested using Monte Carlo Cross Validation (MCCV) [119], in which the whole dataset is randomly divided into training and testing sets to assess not only the predictive model's average performance, but also its range (Fig. 20d) [115]. This process is then iterated hundreds of times to evaluate the average accuracy of the model. Validation studies for translational applications should be properly designed and ideally take into account biological or technical variations. However, due to the cost and effort required to acquire a large number of samples, most early validation studies currently rely on relatively moderate sample sizes. As a result of such limitations, potentially confounding factors including diet, age, gender and subtle differences in pathology can strongly affect the performance of the derived biomarkers. Efforts to take these factors into account are still nascent.
There is also increased interest in developing biological validation (in addition to the analytical and clinical validation) of identified biomarkers, in order to reduce the number of false positive biomarker candidates that arise, and to provide deeper biological insight. However, some parts of metabolism are insufficiently understood or quite complicated, such that it can be challenging to derive specific biological meaning for the promising biomarker candidates. We believe that efforts to translate metabolite biomarker panels for clinical applications and to find biological connection between the disease state and the derived biomarker panel are best pursued in parallel. Finally, greater insight into metabolic perturbations can lead to novel drug targets, which constitutes another exciting and growing area of opportunities in metabolomics.
11. Concluding remarks
In summary, NMR spectroscopy continues to play a key role in the metabolomics field. Numerous beneficial characteristics of NMR outweigh its limited resolution and sensitivity. NMR thus offers unique opportunities to understand systems biology, discover biomarkers and potential therapy targets, and translate laboratory findings to clinical applications. Outstanding opportunities exist in the application of NMR-based metabolomics to non-health related fields as well. In particular, for any metabolite of moderate size, NMR is the essential technique for structure determination. However, because of the increasingly realized complexity of biological mixtures, reliable detection, unknown identification and quantitation (especially of a large pool of metabolites) continue to constitute daunting challenges. With appreciation of the advantages of NMR for metabolomics applications as well as its challenges, there have been multifaceted efforts to boost sensitivity, resolution and the speed of data acquisition, and to improve quantitative accuracy. Improved methods to combine and compare metabolite data from NMR and MS, for exploiting their combined strengths for unknown metabolite identification and biomarker discovery, are currently being developed, and these efforts will likely deliver important results. NMR-based metabolomics is anticipated to witness further improvements in the number, accuracy and speed of metabolite identification and quantitation, and thus greatly impact the understanding of systems biology with the hope of helping to manage widespread human diseases.
Acknowledgment
Financial support from NIH (2R01GM085291, 1R21CA178621, P30-DK035816, and P30 CA015704) is gratefully acknowledged.
References
- 1.Lindon JC, Nicholson JK. The emergent role of metabolic phenotyping in dynamic patient stratification. Expert Opin. Drug Metab. Toxicol. 2014;10:915–919. doi: 10.1517/17425255.2014.922954. [DOI] [PubMed] [Google Scholar]
- 2.Rhee EP, Gerszten RE. Metabolomics and cardiovascular biomarker discovery. Clin. Chem. 2012;58:139–147. doi: 10.1373/clinchem.2011.169573. [DOI] [PMC free article] [PubMed] [Google Scholar]
- 3.Griffin JL, Atherton H, Shockcor J, Atzori L. Metabolomics as a tool for cardiac research. Nat. Rev. Cardiol. 2011;8:630–643. doi: 10.1038/nrcardio.2011.138. [DOI] [PubMed] [Google Scholar]
- 4.Nagana Gowda GA, Raftery D. Biomarker discovery and translation in metabolomics. Curr. Metabolomics. 2013;1:227–240. doi: 10.2174/2213235X113019990005. [DOI] [PMC free article] [PubMed] [Google Scholar]
- 5.Dang NH, Singla AK, Mackay EM, Jirik FR, Weljie AM. Targeted cancer therapeutics: biosynthetic and energetic pathways characterized by metabolomics and the interplay with key cancer regulatory factors. Curr. Pharm. Des. 2014;20:2637–2647. doi: 10.2174/13816128113199990489. [DOI] [PubMed] [Google Scholar]
- 6.Wishart DS, Jewison T, Guo AC, Wilson M, Knox C, Liu Y, Djoumbou Y, Mandal R, Aziat F, Dong E, Bouatra S, Sinelnikov I, Arndt D, Xia J, Liu P, Yallou F, Bjorndahl T, Perez-Pineiro R, Eisner R, Allen F, Neveu V, Greiner R, Scalbert A. HMDB 3.0 – the human metabolome database in 2013. Nucleic Acids Res. 2013;41:D801–D807. doi: 10.1093/nar/gks1065. [DOI] [PMC free article] [PubMed] [Google Scholar]
- 7.Nagana Gowda GA, Zhang S, Gu H, Asiago V, Shanaiah N, Raftery D. Metabolomics-based methods for early disease diagnostics. Expert Rev. Mol. Diagn. 2008;8:617–633. doi: 10.1586/14737159.8.5.617. [DOI] [PMC free article] [PubMed] [Google Scholar]
- 8.Nagana Gowda GA, Raftery D. Advances in NMR based metabolomics, in: Carolina Simó, Alejandro Cifuentes. In: García-Cañas Virginia., editor. Fundamentals of Advanced Omics Technologies: From Genes to Metabolites, Comprehensive Analytical Chemistry. Vol. 63. Elsevier; New York: 2014. pp. 187–211. Chapter 8. [Google Scholar]
- 9.Bingol K, Brüschweiler R. Multidimensional approaches to NMR-based metabolomics. Anal. Chem. 2014;86:47–57. doi: 10.1021/ac403520j. [DOI] [PMC free article] [PubMed] [Google Scholar]
- 10.Larive CK, Barding GA, Jr., Dinges MM. NMR spectroscopy for metabolomics and metabolic profiling. Anal. Chem. 2015;87:133–146. doi: 10.1021/ac504075g. [DOI] [PubMed] [Google Scholar]
- 11.Powers R. The current state of drug discovery and a potential role for NMR metabolomics. J. Med. Chem. 2014;57:5860–5870. doi: 10.1021/jm401803b. [DOI] [PMC free article] [PubMed] [Google Scholar]
- 12.Zhang S, Nagana Gowda GA, Ye T, Raftery D. Advances in NMR based biofluid analysis and metabolite profiling. Analyst. 2010;135:1490–1498. doi: 10.1039/c000091d. [DOI] [PMC free article] [PubMed] [Google Scholar]
- 13.Ye T, Zhang S, Nagana Gowda GA, Raftery D. Nuclear magnetic resonance and statistical analysis. In: Meyers RA, editor. Encyclopedia of Analytical Chemistry. John Wiley; Hoboken, NJ: 2010. [Google Scholar]
- 14.Nicholson JK, Gartland KP. 1H NMR studies on protein binding of histidine, tyrosine and phenylalanine in blood plasma. NMR Biomed. 1989;2:77–82. doi: 10.1002/nbm.1940020207. [DOI] [PubMed] [Google Scholar]
- 15.Chatham JC, Forder JR. Lactic acid and protein interactions: implications for the NMR visibility of lactate in biological systems. Biochim. Biophys. Acta. 1999;1426:177–184. doi: 10.1016/s0304-4165(98)00154-8. [DOI] [PubMed] [Google Scholar]
- 16.Daykin CA, Foxall PJ, Connor SC, Lindon JC, Nicholson JK. The comparison of plasma deproteinization methods for the detection of low-molecular-weight metabolites by (1)H nuclear magnetic resonance spectroscopy. Anal. Biochem. 2002;304:220–230. doi: 10.1006/abio.2002.5637. [DOI] [PubMed] [Google Scholar]
- 17.Tiziani S, Emwas AH, Lodi A, Ludwig C, Bunce CM, Viant MR, Günther UL. Optimized metabolite extraction from blood serum for 1H nuclear magnetic resonance spectroscopy. Anal. Biochem. 2008;377:16–23. doi: 10.1016/j.ab.2008.01.037. [DOI] [PubMed] [Google Scholar]
- 18.Fan TW. The handbook of metabolomics. In: Fan TW, Higashi RM, Lane AN, editors. Methods in Pharmacology and Toxicology. Springer; New York: 2012. pp. 7–27. [Google Scholar]
- 19.Serkova NJ, Standiford TJ, Stringer KA. The emerging field of quantitative blood metabolomics for biomarker discovery in critical illnesses. Am. J. Res. Crit. Care Med. 2011;184:647–655. doi: 10.1164/rccm.201103-0474CI. [DOI] [PMC free article] [PubMed] [Google Scholar]
- 20.Simón-Manso Y, Lowenthal MS, Kilpatrick LE, Sampson ML, Telu KH, Rudnick PA, Mallard WG, Bearden DW, Schock TB, Tchekhovskoi DV, Blonder N, Yan X, Liang Y, Zheng Y, Wallace WE, Neta P, Phinney KW, Remaley AT, Stein SE. Metabolite profiling of a NIST Standard Reference Material for human plasma (SRM 1950): GC–MS, LC–MS, NMR, and clinical laboratory analyses, libraries, and web-based resources. Anal. Chem. 2013;85:11725–11731. doi: 10.1021/ac402503m. [DOI] [PubMed] [Google Scholar]
- 21.Psychogios N, Hau DD, Peng J, Guo AC, Mandal R, Bouatra S, Sinelnikov I, Krishnamurthy R, Eisner R, Gautam B, Young N, Xia J, Knox C, Dong E, Huang P, Hollander Z, Pedersen TL, Smith SR, Bamforth F, Greiner R, McManus B, Newman JW, Goodfriend T, Wishart DS. The human serum metabolome. PLoS One. 2011;6:e16957. doi: 10.1371/journal.pone.0016957. [DOI] [PMC free article] [PubMed] [Google Scholar]
- 22.Nagana Gowda GA, Raftery D. Quantitating metabolites in protein precipitated serum using NMR spectroscopy. Anal. Chem. 2014;86:5433–5440. doi: 10.1021/ac5005103. [DOI] [PMC free article] [PubMed] [Google Scholar]
- 23.Nagana Gowda GA, Gowda YN, Raftery D. Expanding the limits of human blood metabolite quantitation using NMR spectroscopy. Anal. Chem. 2015;87:706–715. doi: 10.1021/ac503651e. [DOI] [PMC free article] [PubMed] [Google Scholar]
- 24.Mo H, Raftery D. Solvent signal as an NMR concentration reference. Anal. Chem. 2008;80:9835–9839. doi: 10.1021/ac801938j. [DOI] [PMC free article] [PubMed] [Google Scholar]
- 25.Mo H, Harwood JS, Zhang S, Xue Y, Santini R, Raftery D. A quantitative measure of NMR signal receiving efficiency. J. Magn. Reson. 2009;200:239–244. doi: 10.1016/j.jmr.2009.07.004. [DOI] [PMC free article] [PubMed] [Google Scholar]
- 26.Mo H, Harwood JS, Raftery D. Receiver gain function: the actual NMR receiver gain. Magn. Reson. Chem. 2010;48:235–238. doi: 10.1002/mrc.2563. [DOI] [PMC free article] [PubMed] [Google Scholar]
- 27.Mo H, Harwood JS, Raftery D. A quick diagnostic test for NMR receiver gain compression. Magn. Reson. Chem. 2010;48(10):782–786. doi: 10.1002/mrc.2662. [DOI] [PMC free article] [PubMed] [Google Scholar]
- 28.Lewis A, Schommer SC, Hodis B, Robb KA, Tonelli M, Westler WM, Sussman MR, Markley JL. Method for determining molar concentrations of metabolites in complex solutions from two-dimensional 1H–13C NMR spectra. Anal. Chem. 2007;79:9385–9390. doi: 10.1021/ac071583z. [DOI] [PMC free article] [PubMed] [Google Scholar]
- 29.Rai RK, Tripathi P, Sinha N. Quantification of metabolites from two-dimensional nuclear magnetic resonance spectroscopy: application to human urine samples. Anal. Chem. 2009;81:10232–10238. doi: 10.1021/ac902405z. [DOI] [PubMed] [Google Scholar]
- 30.Hu K, Westler WM, Markley JL. Simultaneous quantification and identification of individual chemicals in metabolite mixtures by two-dimensional extrapolated time-zero 1H–13C HSQC (HSQC0) J. Am. Chem. Soc. 2011;133:1662–1665. doi: 10.1021/ja1095304. [DOI] [PMC free article] [PubMed] [Google Scholar]
- 31.Ye T, Zheng C, Zhang S, Nagana Gowda GA, Vitek O, Raftery D. “Add to subtract”: a simple method to remove complex background signals from the 1H nuclear magnetic resonance spectra of mixtures. Anal. Chem. 2012;84:994–1002. doi: 10.1021/ac202548n. [DOI] [PMC free article] [PubMed] [Google Scholar]
- 32.Dona AC, Jiménez B, Schäfer H, Humpfer E, Spraul M, Lewis MR, Pearce JT, Holmes E, Lindon JC, Nicholson JK. Precision high-throughput proton NMR spectroscopy of human urine, serum, and plasma for large-scale metabolic phenotyping. Anal. Chem. 2014;86:9887–9894. doi: 10.1021/ac5025039. [DOI] [PubMed] [Google Scholar]
- 33.Sukumaran DK, Garcia E, Hua J, Tabaczynski W, Odunsi K, Andrews C, Szyperski T. Standard operating procedure for metabonomics studies of blood serum and plasma samples using a 1H NMR micro-flow probe. Magn. Reson. Chem. 2009;47(Suppl. 1):S81–S85. doi: 10.1002/mrc.2469. [DOI] [PubMed] [Google Scholar]
- 34.Hwang TL, Shaka AJ. Water suppression that works. Excitation sculpting using arbitrary wave-forms and pulsed-field gradients. J. Magn. Reson. A. 1995;112(2):275–279. [Google Scholar]
- 35.Ogg RJ, Kingsley PB, Taylor JS. WET, a T1- and B1-insensitive water-suppression method for in vivo localized 1H NMR spectroscopy. J. Magn. Reson. B. 1994;104:1–10. doi: 10.1006/jmrb.1994.1048. [DOI] [PubMed] [Google Scholar]
- 36.Smith LM, Maher AD, Cloarec O, Rantalainen M, Tang H, Elliott P, Stamler J, Lindon JC, Holmes E, Nicholson JK. Statistical correlation and projection methods for improved information recovery from diffusion-edited NMR spectra of biological samples. Anal. Chem. 2007;79:5682–5689. doi: 10.1021/ac0703754. [DOI] [PubMed] [Google Scholar]
- 37.Mo H, Raftery D. Improved residual water suppression: WET180. J. Biomol. NMR. 2008;41:105–111. doi: 10.1007/s10858-008-9246-2. [DOI] [PMC free article] [PubMed] [Google Scholar]
- 38.Mo H, Raftery D. Pre-SAT180, a simple and effective method for residual water suppression. J. Magn. Reson. 2008;190:1–6. doi: 10.1016/j.jmr.2007.09.016. [DOI] [PMC free article] [PubMed] [Google Scholar]
- 39.Ivanisevic J, Zhu ZJ, Plate L, Tautenhahn R, Chen S, O'Brien PJ, Johnson CH, Marletta MA, Patti GJ, Siuzdak G. Toward ’omic scale metabolite profiling: a dual separation-mass spectrometry approach for coverage of lipid and central carbon metabolism. Anal. Chem. 2013;85:6876–6884. doi: 10.1021/ac401140h. [DOI] [PMC free article] [PubMed] [Google Scholar]
- 40.Sandusky P, Appiah-Amponsah E, Raftery D. Use of optimized 1D TOCSY NMR for improved quantitation and metabolomic analysis of biofluids. J. Biomol. NMR. 2011;49:281–290. doi: 10.1007/s10858-011-9483-7. [DOI] [PMC free article] [PubMed] [Google Scholar]
- 41.Sandusky P, Raftery D. Use of selective TOCSY NMR experiments for quantifying minor components in complex mixtures: application to the metabonomics of amino acids in honey. Anal. Chem. 2005;77:2455–2463. doi: 10.1021/ac0484979. [DOI] [PubMed] [Google Scholar]
- 42.Sandusky P, Raftery D. Use of semiselective TOCSY and the Pearson correlation for the metabonomic analysis of biofluid mixtures: application to urine. Anal. Chem. 2005;77:7717–7723. doi: 10.1021/ac0510890. [DOI] [PubMed] [Google Scholar]
- 43.Appiah-Amponsah E, Shanaiah N, Nagana Gowda GA, Owusu-Sarfo K, Ye T, Raftery D. Identification of 4-deoxythreonic acid present in human urine using HPLC and NMR techniques. J. Pharm. Biomed. Anal. 2009;50:878–885. doi: 10.1016/j.jpba.2009.06.007. [DOI] [PMC free article] [PubMed] [Google Scholar]
- 44.Emwas A-H, Luchinat C, Turano P, Tenori L, Roy R, Salek RM, Ryan D, Merzaban JS, Kaddurah-Daouk R, Zeri AC, Nagana Gowda GA, Raftery D, Wang Y, Brennan L, Wishart DS. Standardizing the experimental conditions for using urine in NMR-based metabolomic studies with a particular focus on diagnostic studies: a review. Metabolomics. 2015;11(14):872–894. doi: 10.1007/s11306-014-0746-7. [DOI] [PMC free article] [PubMed] [Google Scholar]
- 45.Assfalg M, Bertini I, Colangiuli D, Luchinat C, Schäfer H, Schütz B, Spraul M. Evidence of different metabolic phenotypes in humans. Proc. Natl. Acad. Sci. USA. 2008;105:1420–1424. doi: 10.1073/pnas.0705685105. [DOI] [PMC free article] [PubMed] [Google Scholar]
- 46.Rist MJ, Muhle-Goll C, Görling B, Bub A, Heissler S, Watzl B, Luy B. Influence of freezing and storage procedure on human urine samples in NMR-based metabolomics. Metabolites. 2013;3:243–258. doi: 10.3390/metabo3020243. [DOI] [PMC free article] [PubMed] [Google Scholar]
- 47.Asiago VM, Nagana Gowda GA, Zhang S, Shanaiah N, Clark J, Raftery D. Use of EDTA to minimize ionic strength dependent frequency shifts in the 1H NMR spectra of urine. Metabolomics. 2008;4:328–336. [Google Scholar]
- 48.Bouatra S, Aziat F, Mandal R, Guo AC, Wilson MR, Knox C, Bjorndahl TC, Krishnamurthy R, Saleem F, Liu P, Dame ZT, Poelzer J, Huynh J, Yallou FS, Psychogios N, Dong E, Bogumil R, Roehring C, Wishart DS. The human urine metabolome. PLoS One. 2013;8:e73076. doi: 10.1371/journal.pone.0073076. [DOI] [PMC free article] [PubMed] [Google Scholar]
- 49.Cui Q, Lewis IA, Hegeman AD, Anderson ME, Li J, Schulte CF, Westler WM, Eghbalnia HR, Sussman MR, Markley JL. Metabolite identification via the Madison metabolomics consortium database. Nat. Biotechnol. 2008;26:162–164. doi: 10.1038/nbt0208-162. [DOI] [PubMed] [Google Scholar]
- 50.Chikayama E, Sekiyama Y, Okamoto M, Nakanishi Y, Tsuboi Y, Akiyama K, Saito K, Shinozaki K, Kikuchi J. Statistical indices for simultaneous large-scale metabolite detections for a single NMR spectrum. Anal. Chem. 2010;82:1653–1658. doi: 10.1021/ac9022023. [DOI] [PubMed] [Google Scholar]
- 51.Ulrich EL, Akutsu H, Doreleijers JF, Harano Y, Ioannidis YE, Lin J, Livny M, Mading S, Maziuk D, Miller Z, Nakatani E, Schulte CF, Tolmie DE, Wenger RK, Yao HY, Markley JL. BioMagResBank. Nucleic Acids Res. 2008;36:D402–D408. doi: 10.1093/nar/gkm957. [DOI] [PMC free article] [PubMed] [Google Scholar]
- 52.Akiyama K, Chikayama E, Yuasa H, Shimada Y, Tohge T, Shinozaki K, Hirai MY, Sakurai T, Kikuchi J, Saito K. PRIMe: a Web site that assembles tools for metabolomics and transcriptomics. Silico Biol. 2008;8:339–345. [PubMed] [Google Scholar]
- 53.Xia J, Bjorndahl TC, Tang P, Wishart DS. MetaboMiner-semi-automated identification of metabolites from 2D NMR spectra of complex biofluids. BMC Bioinformatics. 2008;9:507. doi: 10.1186/1471-2105-9-507. [DOI] [PMC free article] [PubMed] [Google Scholar]
- 54.Bingol K, Li DW, Bruschweiler-Li L, Cabrera O, Megraw T, Zhang F, Bruschweiler R. Unified and isomer-specific NMR metabolomics database for the accurate analysis of 13C–1H HSQC spectra. ACS Chem. Biol. 2015;10:452–459. doi: 10.1021/cb5006382. [DOI] [PMC free article] [PubMed] [Google Scholar]
- 55.Chikayama E, Suto M, Nishihara T, Shinozaki K, Kikuchi J. Systematic NMR analysis of stable isotope labeled metabolite mixtures in plant and animal systems: coarse grained views of metabolic pathways. PLoS One. 2008;3:e3805. doi: 10.1371/journal.pone.0003805. [DOI] [PMC free article] [PubMed] [Google Scholar]
- 56.Zhang F, Brüschweiler R. Robust deconvolution of complex mixtures by covariance TOCSY spectroscopy. Angew. Chem., Int. Ed. 2007;46:2639–2642. doi: 10.1002/anie.200604599. [DOI] [PubMed] [Google Scholar]
- 57.Bingol K, Brüschweiler R. Deconvolution of chemical mixtures with high complexity by NMR consensus trace clustering. Anal. Chem. 2011;83:7412–7417. doi: 10.1021/ac201464y. [DOI] [PMC free article] [PubMed] [Google Scholar]
- 58.Cloarec O, Dumas ME, Craig A, Barton RH, Trygg J, Hudson J, Blancher C, Gauguier D, Lindon JC, Holmes E, Nicholson JK. Statistical total correlation spectroscopy: an exploratory approach for latent biomarker identification from metabolic 1H NMR data sets. Anal. Chem. 2005;77:1282–1289. doi: 10.1021/ac048630x. [DOI] [PubMed] [Google Scholar]
- 59.Alves C, Rantalainen M, Holmes E, Nicholson JK, Ebbels TM. Analytic properties of statistical total correlation spectroscopy based information recovery in 1H NMR metabolic data sets. Anal. Chem. 2009;81:2075–2084. doi: 10.1021/ac801982h. [DOI] [PubMed] [Google Scholar]
- 60.Crockford DJ, Holmes E, Lindon JC, Plumb RS, Zirah S, Bruce SJ, Rainville P, Stumpf CL, Nicholson JK. Statistical heterospectroscopy, an approach to the integrated analysis of NMR and UPLC-MS data sets: application in metabonomic toxicology studies. Anal. Chem. 2006;78:363–371. doi: 10.1021/ac051444m. [DOI] [PubMed] [Google Scholar]
- 61.Robinette SL, Lindon JC, Nicholson JK. Statistical spectroscopic tools for biomarker discovery and systems medicine. Anal. Chem. 2013;85:5297–5303. doi: 10.1021/ac4007254. [DOI] [PubMed] [Google Scholar]
- 62.Clendinen CS, Lee-McMullen B, Williams CM, Stupp GS, Vandenborne K, Hahn DA, Walter GA, Edison AS. 13C NMR metabolomics: applications at natural abundance. Anal. Chem. 2014;86:9242–9250. doi: 10.1021/ac502346h. [DOI] [PMC free article] [PubMed] [Google Scholar]
- 63.Posma JM, Garcia-Perez I, De Iorio M, Lindon JC, Elliott P, Holmes E, Ebbels TM, Nicholson JK. Subset optimization by reference matching (STORM): an optimized statistical approach for recovery of metabolic biomarker structural information from 1H NMR spectra of biofluids. Anal. Chem. 2012;84:10694–10701. doi: 10.1021/ac302360v. [DOI] [PubMed] [Google Scholar]
- 64.Zou X, Holmes E, Nicholson JK, Loo RL. Statistical HOmogeneous Cluster SpectroscopY (SHOCSY): an optimized statistical approach for clustering of 1H NMR spectral data to reduce interference and enhance robust biomarkers selection. Anal. Chem. 2014;86:5308–5315. doi: 10.1021/ac500161k. [DOI] [PMC free article] [PubMed] [Google Scholar]
- 65.Brüschweiler R, Zhang F. Covariance nuclear magnetic resonance spectroscopy. J. Chem. Phys. 2004;120:5253–5260. doi: 10.1063/1.1647054. [DOI] [PubMed] [Google Scholar]
- 66.Wei S, Zhang J, Liu L, Ye T, Nagana Gowda GA, Tayyari F, Raftery D. Ratio analysis nuclear magnetic resonance spectroscopy for selective metabolite identification in complex samples. Anal. Chem. 2011;83:7616–7623. doi: 10.1021/ac201625f. [DOI] [PMC free article] [PubMed] [Google Scholar]
- 67.Gu H, Nagana Gowda GA, Neto FC, Raftery D. RAMSY: ratio analysis of mass spectrometry to improve compound identification. Anal. Chem. 2013;85:10771–10779. doi: 10.1021/ac4019268. [DOI] [PMC free article] [PubMed] [Google Scholar]
- 68.Fan TW, Lorkiewicz PK, Sellers K, Moseley HN, Higashi RM, Lane AN. Stable isotope-resolved metabolomics and applications for drug development. Pharmacol. Ther. 2012;133:366–391. doi: 10.1016/j.pharmthera.2011.12.007. [DOI] [PMC free article] [PubMed] [Google Scholar]
- 69.Zhang F, Bruschweiler-Li L, Brüschweiler R. High-resolution homonuclear 2D NMR of carbon-13 enriched metabolites and their mixtures. J. Magn. Reson. 2012;225:10–13. doi: 10.1016/j.jmr.2012.09.006. [DOI] [PMC free article] [PubMed] [Google Scholar]
- 70.Bingol K, Zhang F, Bruschweiler-Li L, Brüschweiler R. Carbon backbone topology of the metabolome of a cell. J. Am. Chem. Soc. 2012;134:9006–9011. doi: 10.1021/ja3033058. [DOI] [PMC free article] [PubMed] [Google Scholar]
- 71.Bingol K, Zhang F, Bruschweiler-Li L, Brüschweiler R. Quantitative analysis of metabolic mixtures by two-dimensional 13C constant-time TOCSY NMR spectroscopy. Anal. Chem. 2013;85:6414–6420. doi: 10.1021/ac400913m. [DOI] [PMC free article] [PubMed] [Google Scholar]
- 72.Shanaiah N, Desilva A, Nagana Gowda GA, Raftery MA, Hainline BE, Raftery D. Class selection of amino acid metabolites in body fluids using chemical derivatization and their enhanced 13C NMR. Proc. Natl. Acad. Sci. USA. 2007;104:11540–11544. doi: 10.1073/pnas.0704449104. [DOI] [PMC free article] [PubMed] [Google Scholar]
- 73.Ye T, Zhang S, Mo H, Tayyari F, Nagana Gowda GA, Raftery D. 13C-formylation for improved nuclear magnetic resonance profiling of amino metabolites in biofluids. Anal. Chem. 2010;82:2303–2309. doi: 10.1021/ac9024818. [DOI] [PMC free article] [PubMed] [Google Scholar]
- 74.Ye T, Mo H, Shanaiah N, Nagana Gowda GA, Zhang S, Raftery D. Chemoselective 15N tag for sensitive and high-resolution nuclear magnetic resonance profiling of the carboxyl-containing metabolome. Anal. Chem. 2009;81:4882–4888. doi: 10.1021/ac900539y. [DOI] [PMC free article] [PubMed] [Google Scholar]
- 75.DeSilva MA, Shanaiah N, Nagana Gowda GA, Rosa-Pérez K, Hanson BA, Raftery D. Application of 31P NMR spectroscopy and chemical derivatization for metabolite profiling of lipophilic compounds in human serum. Magn. Reson. Chem. Suppl. 2009;1:S74–S80. doi: 10.1002/mrc.2480. [DOI] [PMC free article] [PubMed] [Google Scholar]
- 76.Nagana Gowda GA, Tayyari F, Ye T, Suryani Y, Wei S, Shanaiah N, Raftery D. Quantitative analysis of blood plasma metabolites using isotope enhanced NMR methods. Anal. Chem. 2010;82:8983–8990. doi: 10.1021/ac101938w. [DOI] [PMC free article] [PubMed] [Google Scholar]
- 77.Tayyari F, Nagana Gowda GA, Gu H, Raftery D. 15N-cholamine –a smart isotope tag for combining NMR- and MS-based metabolite profiling. Anal. Chem. 2013;85:8715–8721. doi: 10.1021/ac401712a. [DOI] [PMC free article] [PubMed] [Google Scholar]
- 78.Lacey ME, Subramanian R, Olson DL, Webb AG, Sweedler JV. High-resolution NMR spectroscopy of sample volumes from 1 nL to 10 lL. Chem. Rev. 1999;99:3133–3152. doi: 10.1021/cr980140f. [DOI] [PubMed] [Google Scholar]
- 79.Olson DL, Peck TL, Webb AG, Magin RL, Sweedler JV. High-resolution microcoil 1H NMR for mass-limited, nanoliter-volume samples. Science. 1995;270:1967–1970. [Google Scholar]
- 80.Kc R, Henry ID, Park GHJ, Raftery D. Design and construction of a versatile dual volume heteronuclear double resonance microcoil NMR probe. J. Magn. Reson. 2009;197:186–192. doi: 10.1016/j.jmr.2008.12.020. [DOI] [PMC free article] [PubMed] [Google Scholar]
- 81.Kc R, Gowda YN, Djukovic D, Henry ID, Park GHJ, Raftery D. Susceptibility-matched plugs for microcoil NMR probes. J. Magn. Reson. 2010;205:63–68. doi: 10.1016/j.jmr.2010.04.001. [DOI] [PMC free article] [PubMed] [Google Scholar]
- 82.Ravi KC, Henry ID, Park GHJ, Aghdasi A, Raftery D. New solenoidal microcoil NMR probe using zero-susceptibility wire. Conc. Magn. Reson. Part B –Magn. Reson. Eng. 2010;37B:13–19. doi: 10.1002/cmr.b.20152. [DOI] [PMC free article] [PubMed] [Google Scholar]
- 83.Grimes JH, O'Connell TM. The application of micro-coil NMR probe technology to metabolomics of urine and serum. J. Biomol. NMR. 2011;49:297–305. doi: 10.1007/s10858-011-9488-2. [DOI] [PubMed] [Google Scholar]
- 84.Bird SS, Sheldon DP, Gathungu RM, Vouros P, Kautz R, Matson WR, Kristal BS. Structural characterization of plasma metabolites detected via LC-electrochemical coulometric array using LC-UV fractionation, MS, and NMR. Anal. Chem. 2012;84:9889–9898. doi: 10.1021/ac302278u. [DOI] [PMC free article] [PubMed] [Google Scholar]
- 85.Henry D, Park GHJ, Kc R, Tobias B, Raftery D. Design and construction of a microcoil NMR probe for the routine analysis of 20-lL samples. Conc. Magn. Reson. Part B –Magn. Reson. Eng. 2008;33B:1–8. [Google Scholar]
- 86.Bergeron SJ, Henry ID, Santini RE, Aghdasi A, Raftery D. Saturation transfer double-difference NMR spectroscopy using a dual solenoid microcoil difference probe. Magn. Reson. Chem. 2008;46:925–929. doi: 10.1002/mrc.2275. [DOI] [PMC free article] [PubMed] [Google Scholar]
- 87.Macnaughtan MA, Hou T, Xu J, Raftery D. High-throughput nuclear magnetic resonance analysis using a multiple coil flow probe. Anal. Chem. 2003;75:5116–5123. doi: 10.1021/ac034400r. [DOI] [PubMed] [Google Scholar]
- 88.Cloarec O, Campbell A, Tseng LH, Braumann U, Spraul M, Scarfe G, Weaver R, Nicholson JK. Virtual chromatographic resolution enhancement in cryoflow LC-NMR experiments via statistical total correlation spectroscopy. Anal. Chem. 2007;79:3304–3311. doi: 10.1021/ac061928y. [DOI] [PubMed] [Google Scholar]
- 89.Lenz EM, Wilson ID. Analytical strategies in metabonomics. J. Proteome Res. 2007;6:443–458. doi: 10.1021/pr0605217. [DOI] [PubMed] [Google Scholar]
- 90.Djukovic D, Liu S, Henry I, Tobias B, Raftery D. Signal enhancement in HPLC/microcoil NMR using automated column trapping. Anal. Chem. 2006;78:7154–7160. doi: 10.1021/ac0605748. [DOI] [PMC free article] [PubMed] [Google Scholar]
- 91.Djukovic D, Appiah-Amponsah E, Shanaiah N, Nagana Gowda GA, Henry I, Everly M, Tobias B, Raftery D. Ibuprofen metabolite profiling using a combination of SPE/column-trapping and HPLC-micro-coil NMR. J. Pharm. Biomed. Anal. 2008;47:328–334. doi: 10.1016/j.jpba.2007.12.035. [DOI] [PubMed] [Google Scholar]
- 92.Garcia E, Andrews C, Hua J, Kim HL, Sukumaran DK, Szyperski T, Odunsi K. Diagnosis of early stage ovarian cancer by 1H NMR metabonomics of serum explored by use of a microflow NMR probe. J. Proteome Res. 2011;10:1765–1771. doi: 10.1021/pr101050d. [DOI] [PMC free article] [PubMed] [Google Scholar]
- 93.Bhattacharya P, Chekmenev EY, Perman WH, Harris KC, Lin AP, Norton VA, Tan CT, Ross BD, Weitekamp DP. Towards hyperpolarized (13)C-succinate imaging of brain cancer. J. Magn. Reson. 2007;186:150–155. doi: 10.1016/j.jmr.2007.01.017. [DOI] [PMC free article] [PubMed] [Google Scholar]
- 94.Chekmenev EY, Norton VA, Weitekamp DP, Bhattacharya P. Hyperpolarized (1)H NMR employing low gamma nucleus for spin polarization storage. J. Am. Chem. Soc. 2009;131:3164–3165. doi: 10.1021/ja809634u. [DOI] [PMC free article] [PubMed] [Google Scholar]
- 95.Shchepin RV, Coffey AM, Waddell KW, Chekmenev EY. PASADENA hyperpolarized 13C phospholactate. J. Am. Chem. Soc. 2012;134:3957–3960. doi: 10.1021/ja210639c. [DOI] [PMC free article] [PubMed] [Google Scholar]
- 96.Frydman L, Blazina D. Ultrafast two-dimensional nuclear magnetic resonance spectroscopy of hyperpolarized solutions. Nat. Phys. 2007;3:415–419. [Google Scholar]
- 97.Saunders MG, Ludwig C, Gunther UL. Optimizing the signal enhancement in cryogenic ex situ DNP-NMR spectroscopy. J. Am. Chem. Soc. 2008;130:6914–6915. doi: 10.1021/ja800971t. [DOI] [PubMed] [Google Scholar]
- 98.Ardenkjaer-Larsen JH, Fridlund B, Gram A, Hansson G, Hansson L, Lerche MH, Servin R, Thaning M, Golman K. Increase in signal-to-noise ratio of >10,000 times in liquid-state NMR. Proc. Natl. Acad. Sci. USA. 2003;100:10158–10163. doi: 10.1073/pnas.1733835100. [DOI] [PMC free article] [PubMed] [Google Scholar]
- 99.Kurhanewicz J, Vigneron DB, Brindle K, Chekmenev EY, Comment A, Cunningham CH, Deberardinis RJ, Green GG, Leach MO, Rajan SS, Rizi RR, Ross BD, Warren WS, Malloy CR. Analysis of cancer metabolism by imaging hyperpolarized nuclei: prospects for translation to clinical research. Neoplasia. 2011;13:81–97. doi: 10.1593/neo.101102. [DOI] [PMC free article] [PubMed] [Google Scholar]
- 100.Giskeødegård GF, Cao MD, Bathen T. High-resolution magic-angle-spinning NMR spectroscopy of intact tissue. Methods Mol. Biol. 2015;1277:37–50. doi: 10.1007/978-1-4939-2377-9_4. [DOI] [PubMed] [Google Scholar]
- 101.Wong A, Jiménez B, Li X, Holmes E, Nicholson JK, Lindon JC, Sakellariou D. Evaluation of high resolution magic-angle coil spinning NMR spectroscopy for metabolic profiling of nanoliter tissue biopsies. Anal. Chem. 2012;84:3843–3848. doi: 10.1021/ac300153k. [DOI] [PubMed] [Google Scholar]
- 102.Choi JS, Baek HM, Kim S, Kim MJ, Youk JH, Moon HJ, Kim EK, Han KH, Kim DH, Kim SI, Koo JS. HR-MAS MR spectroscopy of breast cancer tissue obtained with core needle biopsy: correlation with prognostic factors. PLoS One. 2012;7:e51712. doi: 10.1371/journal.pone.0051712. [DOI] [PMC free article] [PubMed] [Google Scholar]
- 103.Pan Z, Gu H, Talaty N, Chen H, Shanaiah N, Hainline BE, Cooks RG, Raftery D. Principal component analysis of urine metabolites detected by NMR and DESI-MS in patients with inborn errors of metabolism. Anal. Bioanal. Chem. 2007;387:539–549. doi: 10.1007/s00216-006-0546-7. [DOI] [PubMed] [Google Scholar]
- 104.Gu H, Pan Z, Xi B, Asiago V, Musselman B, Raftery D. Principal component directed partial least squares analysis for combining nuclear magnetic resonance and mass spectrometry data in metabolomics: application to the detection of breast cancer. Anal. Chim. Acta. 2011;686:57–63. doi: 10.1016/j.aca.2010.11.040. [DOI] [PMC free article] [PubMed] [Google Scholar]
- 105.Marshall DD, Lei S, Worley B, Huang Y, Garcia-Garcia A, Franco R, Dodds ED, Powers R. Combining DI-ESI-MS and NMR datasets for metabolic profiling. Metabolomics. 2015;11:391–402. doi: 10.1007/s11306-014-0704-4. [DOI] [PMC free article] [PubMed] [Google Scholar]
- 106.Crockford DJ, Maher AD, Ahmadi KR, Barrett A, Plumb RS, Wilson ID, Nicholson JK. 1H NMR and UPLC-MS(E) statistical heterospectroscopy: characterization of drug metabolites (xenometabolome) in epidemiological studies. Anal. Chem. 2008;80:6835–6844. doi: 10.1021/ac801075m. [DOI] [PubMed] [Google Scholar]
- 107.Bingol K, Bruschweiler-Li L, Yu C, Somogyi A, Zhang F, Brüschweiler R. Metabolomics beyond spectroscopic databases: a combined MS/NMR strategy for the rapid identification of new metabolites in complex mixtures. Anal. Chem. 2015;87:3864–3870. doi: 10.1021/ac504633z. [DOI] [PMC free article] [PubMed] [Google Scholar]
- 108.Serkova NJ, Standiford TJ, Stringer KA. The emerging field of quantitative blood metabolomics for biomarker discovery in critical illnesses. Am. J. Respir. Crit. Care Med. 2011;184:647–655. doi: 10.1164/rccm.201103-0474CI. [DOI] [PMC free article] [PubMed] [Google Scholar]
- 109.Patel NR, McPhail MJ, Shariff MI, Keun HC, Taylor-Robinson SD. Biofluid metabonomics using (1)H NMR spectroscopy: the road to biomarker discovery in gastroenterology and hepatology. Expert Rev. Gastroenterol. Hepatol. 2012;6:239–251. doi: 10.1586/egh.12.1. [DOI] [PubMed] [Google Scholar]
- 110.Gika HG, Wilson ID. Global metabolic profiling for the study of alcohol-related disorders. Bioanalysis. 2014;6:59–77. doi: 10.4155/bio.13.301. [DOI] [PubMed] [Google Scholar]
- 111.Romick-Rosendale LE, Brunner HI, Bennett MR, Mina R, Nelson S, Petri M, Kiani A, Devarajan P, Kennedy MA. Identification of urinary metabolites that distinguish membranous lupus nephritis from proliferative lupus nephritis and focal segmental glomerulosclerosis. Arthritis Res. Ther. 2011;13:R199. doi: 10.1186/ar3530. [DOI] [PMC free article] [PubMed] [Google Scholar]
- 112.Wei S, Suryani Y, Nagana Gowda GA, Skill N, Maluccio M, Raftery D. Differentiating hepatocellular carcinoma from hepatitis C using metabolite profiling. Metabolites. 2012;2:701–716. doi: 10.3390/metabo2040701. [DOI] [PMC free article] [PubMed] [Google Scholar]
- 113.Owusu-Sarfo K, Asiago VM, Deng L, Gu H, Wei S, Shanaiah N, Nagana Gowda GA, Xi B, Chiorean EG, Raftery D. NMR-based metabolite profiling of pancreatic cancer. Curr. Metabolomics. 2014;2:204–212. [Google Scholar]
- 114.Asiago VM, Alvarado LZ, Shanaiah N, Nagana Gowda GA, Owusu-Sarfo K, Ballas RA, Raftery D. Early detection of recurrent breast cancer using metabolite profiling. Cancer Res. 2010;70:8309–8318. doi: 10.1158/0008-5472.CAN-10-1319. [DOI] [PMC free article] [PubMed] [Google Scholar]
- 115.Wei S, Liu L, Zhang J, Bowers J, Nagana Gowda GA, Seeger H, Fehm T, Neubauer HJ, Vogel U, Clare SE, Raftery D. Metabolomics approach for predicting response to neoadjuvant chemotherapy for breast cancer. Mol. Oncol. 2013;7:297–307. doi: 10.1016/j.molonc.2012.10.003. [DOI] [PMC free article] [PubMed] [Google Scholar]
- 116.Zhang J, Bowers J, Liu L, Wei S, Nagana Gowda GA, Hammoud Z, Raftery D. Esophageal cancer metabolite biomarkers detected by LC-MS and NMR methods. PLoS One. 2012;7:e30181. doi: 10.1371/journal.pone.0030181. [DOI] [PMC free article] [PubMed] [Google Scholar]
- 117.Zhang J, Liu L, Wei S, Nagana Gowda GA, Hammoud Z, Kessler KA, Raftery D. Metabolomics study of esophageal adenocarcinoma. J. Thoracic Cardiovas. Surg. 2011;141:469–475. doi: 10.1016/j.jtcvs.2010.08.025. [DOI] [PubMed] [Google Scholar]
- 118.Xia J, Broadhurst DI, Wilson M, Wishart DS. Translational biomarker discovery in clinical metabolomics: an introductory tutorial. Metabolomics. 2013;9:280–299. doi: 10.1007/s11306-012-0482-9. [DOI] [PMC free article] [PubMed] [Google Scholar]
- 119.Carrola J, Rocha CM, Barros AS, Gil AM, Goodfellow BJ, Carreira IM, Bernardo J, Gomes A, Sousa V, Carvalho L, Duarte IF. Metabolic signatures of lung cancer in biofluids: NMR-based metabonomics of urine. J. Proteome Res. 2011;10:221–230. doi: 10.1021/pr100899x. [DOI] [PubMed] [Google Scholar]


