

Humoral immune tolerance to the therapeutic enzyme E. coli l-asparaginase was induced by engineering the enzyme for in vivo erythrocyte binding.
Keywords: Immunological tolerance, protein drug, asparaginase, erythrocyte
Abstract
Antigen-specific immune responses to protein drugs can hinder efficacy and compromise safety because of drug neutralization and secondary clinical complications. We report a tolerance induction strategy to prevent antigen-specific humoral immune responses to therapeutic proteins. Our modular, biomolecular approach involves engineering tolerizing variants of proteins such that they bind erythrocytes in vivo upon injection, on the basis of the premise that aged erythrocytes and the payloads they carry are cleared tolerogenically, driving the deletion of antigen-specific T cells. We demonstrate that binding the clinical therapeutic enzyme Escherichia coli l-asparaginase to erythrocytes in situ antigen-specifically abrogates development of antibody titers by >1000-fold and extends the pharmacodynamic effect of the drug 10-fold in mice. Additionally, a single pretreatment dose of erythrocyte-binding asparaginase tolerized mice to multiple subsequent doses of the wild-type enzyme. This strategy for reducing antigen-specific humoral responses may enable more effective and safer treatment with therapeutic proteins and drug candidates that are hampered by immunogenicity.
INTRODUCTION
A growing focus on immunogenicity of protein drugs has paralleled the expansion of their use in the advanced treatment of human disease. Repeated administration of protein drugs can lead to the development of undesired anti-drug antibodies and resultant drug neutralization, infusion reactions, and serious adverse events (1, 2). It follows that a variety of approaches that aim to induce immune tolerance to protein therapies by co-administration with clinically approved immunomodulating drugs have been proposed. For example, the small-molecule anti-folate drug methotrexate, commonly used in the treatment of cancer and autoimmune disorders, has recently been shown to dampen immunogenicity by expansion of interleukin-10–secreting regulatory B cells during specific dosing regimens (3) and to have further promise when paired with the proteasome inhibitor bortezomib to deplete plasma cells during ongoing immune responses (4).
Other approaches rely on engineering less immunogenic variants of protein therapeutics to attain improved immunogenicity profiles. For example, strategies to shield therapeutic proteins from the immune system have been steadily on the rise, and more than 10 products grafted with polyethylene glycol (PEG) molecules are currently approved for clinical use (5). Although reporting of anti-PEG immunity to these clinical products is sparse in the literature, recent studies have highlighted potential immunogenicity risks relating to PEGylation strategies, warranting further investigation. For example, anti-PEG antibodies have been clinically reported in 25% of normal healthy blood donors and in 46% of patients treated with PEGylated asparaginase (Oncaspar, Sigma-Tau) (5, 6). Moreover, anti-PEG antibodies have been found to correlate with clinically significant increases in clearance of the therapeutic (6, 7). Other engineering techniques seek to reduce unwanted immune recognition by alteration of the core protein itself, either by removing potential T and B cell epitopes (8–11) or by engineering human analogs to reduce the degree of foreignness perceived by the patient’s immune system (12). Such epitope-based approaches have yielded promising preclinical results and hold impressive potential for clinical development, yet are complicated by the requirement for knowledge of the precise immunodominant epitopes within the molecule, alteration of which may ablate the biological function of the therapeutic and which may depend on the specific human leukocyte antigen (HLA) alleles expressed by the subject. Thus, there remains a pressing clinical need for a more general method to reduce or prevent humoral immune responses to therapeutic proteins.
Here, we report a modular strategy to engineer induction of antigen-specific tolerance to therapeutic proteins through targeted erythrocyte binding. Antigens derived from apoptotic cells drive antigen-specific tolerance via deletion or anergy of reactive T cells (13, 14). Reasoning that a large number of erythrocytes become apoptotic (eryptotic) and are cleared each day, we engineered a strategy to bind model antigens to erythrocytes in situ and consequently induce antigen-specific tolerance in CD4 and CD8 T cells (15). We previously demonstrated antigen-specific T cell exhaustion and deletion in the context of cellular immunity and prevention of autoimmunity; here, we focus instead on humoral immunity, reasoning that the lack of CD4 T cell help to stimulate B cell immunity may provide an approach to T cell–dependent humoral immune tolerance. Using the clinical therapeutic enzyme Escherichia coli l-asparaginase-II (ASNase) as our target antigen of interest, we demonstrate that prophylactic administration of an erythrocyte-binding bioconjugate of ASNase induces antigen-specific tolerance, as evidenced by lack of marked formation of a humoral response during long-term follow-on treatment with the wild-type form of ASNase. These data effectively support a general tolerance induction approach to foreign protein drugs, such as E. coli ASNase, including those that bear essentially no sequence homology to a centrally tolerized endogenous protein.
RESULTS
Engineered variants of ASNase bind specifically to erythrocytes and retain biological activity
The goal of our experimental design was to induce humoral immune tolerance to a foreign therapeutic protein that suffers from clinically relevant immunogenicity. ASNase is an enzyme used in the treatment of acute lymphoblastic leukemia (ALL) and non-Hodgkin’s lymphomas, where depletion of l-asparagine levels in patients is sought as a means to eradicate cancerous cells that cannot themselves synthesize the amino acid. Due to its highly foreign origin to human patients (and to mice, as shown in our animal model), substantial ASNase-specific antibody response rates (61 to 93%) are reported during clinical treatment, of which 45 to 96% are estimated as neutralizing (16–18), making the drug a prime candidate for tolerance induction strategies and development of nonimmunogenic variants.
To achieve specific and high-affinity binding of ASNase to erythrocytes in situ after intravenous injection, we chemically conjugated several copies of a glycophorin A–binding peptide (19) (ERY1) to clinical-grade ASNase (Asparaginase 5000, Medac GmbH) (Fig. 1A). A detailed description of the manufacturing process can be found in Materials and Methods. The apparent affinity of the resulting erythrocyte-binding asparaginase conjugate (ERY1-ASNase) was found to be in the nanomolar range when assessed by flow cytometric measurement of cell-associated ASNase after incubation of erythrocytes with titrated conjugate. Binding of ERY1-ASNase to erythrocytes can be modulated by tuning the ratio of the number of copies of ERY1 peptide to ASNase monomer within our conjugation scheme (Fig. 1B).
Fig. 1. ASNase conjugation to the ERY1 peptide imparts long-term erythrocyte binding in vivo and enhanced pharmacodynamics of plasma asparagine depletion.

(A) Erythrocyte-binding ASNase is produced by chemically conjugating copies of the glycophorin A–binding peptide (ERY1) to ASNase. (B) Characterization of apparent affinity values of ERY1-ASNase conjugates functionalized with varying molar equivalents of ERY1 peptide per ASNase monomer, determined by flow cytometry (one-site binding, R2 ≥ 0.98 for all curve fits). (C) Specific enzymatic activity characterization of ERY1-ASNase and wild-type (WT) ASNase, determined by a fluorogenic assay (n ≥ 4). (D) In vivo ERY1-ASNase binding specificity to erythrocytes (CD45−) but not to other blood cell populations. (E) ERY1-ASNase binding (right panel) and WT ASNase nonbinding (left panel) to healthy (annexin V−) and apoptotic (annexin V+) erythrocytes (CD45−) 24 hours after a 15-μg intravenous injection, determined by flow cytometry. (F) Cell surface binding kinetics and half-life of ERY1-ASNase bound to circulating erythrocytes after a single 15-μg intravenous injection, determined by flow cytometry (n = 3, one-phase decay, R2 = 0.97). (G) Plasma asparagine (Asn) concentration of mice injected with a single 15-μg dose of either WT ASNase or ERY1-ASNase, determined by quantitative liquid chromatography–mass spectrometry (LC-MS) [data presented as means ± SEM (n = 5); repeated once; dotted lines represent homeostatic plasma asparagine concentrations (36)].
For further study, we selected a conjugate with an apparent binding affinity of 5 nM (3 copies per monomer unit), corresponding to the affinities used in our previous studies of cellular immune tolerance (15). We used a fluorogenic ASNase activity assay to ensure that our chemical modifications to attain erythrocyte binding did not reduce the specific activity of the conjugated enzyme (Fig. 1C). Binding was confirmed to be specific to erythrocytes (CD45−) and not to any leukocyte populations (B cells, T cells, granulocytes, monocytes) in blood (Fig. 1D), consistent with glycophorin A being present uniquely on erythrocytes. Additionally, the binding of ERY1-ASNase to the erythrocyte cell surface did not induce eryptosis, nor did residual eryptosis of cells correlate with any binding bias, as suggested by strong ERY1-ASNase binding to both annexin V–binding and non–annexin V–binding populations (Fig. 1E).
Erythrocyte binding enhances the pharmacokinetic and pharmacodynamic profiles of ASNase
We next examined the cell surface pharmacokinetic profile of ERY1-ASNase to determine the duration of erythrocyte association in vivo. The dosing of mice for all subsequent studies was determined by linearly scaling the human dose described in the clinical package insert. Upon injection of a single 15-μg intravenous dose, ERY1-ASNase was detectable on erythrocyte surfaces for about 2 weeks, with a cell surface half-life of 50 hours (Fig. 1F), exceeding the previously reported in vivo serum half-lives of ASNase and PEGylated ASNase in the mouse (3 and 33 hours, respectively) (20).
We then explored the functional implications of the increased pharmacokinetics of the erythrocyte-binding conjugate by measuring the pharmacodynamic effect on plasma asparagine levels after a single 15-μg intravenous dose of ERY1-ASNase or wild-type ASNase. Treatment with wild-type ASNase sustained plasma asparagine depletion in mice to nondetectable levels for 2 days before rapid recovery within 8 days of injection. In contrast, administration of a single dose of ERY1-ASNase yielded nondetectable levels of plasma asparagine for 25 days (>10-fold longer than wild-type ASNase), subphysiological asparagine levels for >35 days, and fully recovered physiological values at 45 days after administration, confirming that ERY1-ASNase remains enzymatically active as a tetramer when bound to circulating erythrocytes (Fig. 1G). These increases in pharmacokinetics and pharmacodynamics are not unexpected, given the 40- to 60-day life span of a mouse erythrocyte and the potential for ERY1-ASNase to disassociate and reassociate with a neighboring erythrocyte, owing to their extremely high concentration in the blood. Because sustained asparagine depletion is paramount to treatment efficacy in ALL patients, the extension of the pharmacodynamic effect is particularly relevant (21, 22).
To determine whether such stark improvements in asparagine depletion dynamics altered immune cell populations, which could confound our immunological interpretations, we performed extensive phenotypic characterization of cell populations in the blood, bone marrow, and spleen of mice injected with two weekly doses of ERY1-ASNase or wild-type ASNase. In the blood, ERY1-ASNase treatment induced no substantial alterations in hematological parameters as compared to age-matched naïve mice, except for a slight (2.2%) increase in mean corpuscular volume (Fig. 2A; flow cytometry gating in fig. S1 and full data in tables S1 and S2) and a slight decrease in B cells (9.2%). Similar to our previous findings with erythrocyte-binding ovalbumin (OVA) (15), the lack of hematological changes supports the conclusion that ERY1-mediated association with the erythrocyte surface does not alter erythrocyte function or phenotype. Wild-type ASNase administration strongly trended toward increasing most leukocyte population counts and erythrocyte parameters as compared to naïve mice; however, these changes did not attain statistical significance. For some parameters where ERY1-ASNase and wild-type ASNase treatment yielded opposing changes from the naïve animals, such as in hematocrit, white blood cell count, lymphocyte count, monocyte count, and eosinophil count, the differences attained significance from each other despite neither condition being significantly different from the naïve values. Furthermore, it should be noted that because of these opposing trends, the resulting ERY1-ASNase/wild-type ASNase ratio represents an exaggerated yet conservative comparison to the overall effect on tolerance induction. Although several population counts were reduced when comparing ERY1-ASNase–treated mice to wild-type ASNase–treated mice, the overall blood population distribution (denoted by percentages) was not altered, suggesting that the enhanced pharmacokinetics of ERY1-ASNase may have resulted in the slight depletion of several populations without skewing the repertoire in any discernible way. Furthermore, in ERY1-ASNase–treated mice, the decrease in total B cells is slight, and the absence of alteration in subpopulations suggests a lack of direct effect on tolerance induction. In the spleen, both ERY1-ASNase and wild-type ASNase reduced the overall populations of B cells (by 14.3 and 6.0%, respectively) and follicular B cells (by 15.8 and 6.6%, respectively) when compared to naïve mice, yet no differences in any B cell populations (total, B1-B, marginal zone, follicular) were detected when ERY1-ASNase and wild-type ASNase treatments were compared (Fig. 2B; flow cytometry gating in figs. S2 to S4 and full data in tables S2 to S4). Although not statistically significant, it is unknown whether the further reduction in total splenic B cells in ERY1-ASNase–treated mice compared to wild-type ASNase–treated mice is related to the greatly enhanced pharmacodynamic effect of ASNase. In general, ASNase administration in either wild-type or erythrocyte-binding form trended toward slightly increased levels of myeloid and dendritic cell populations; however, a significant increase in cells was only seen for the immature myeloid cell population (MHC-IIlow CD11b+) after ERY1-ASNase treatment. In the bone marrow, increased populations of T cells (CD4) and T regulatory (Treg) cells (CD4 and CD8) were detected in ERY1-ASNase–treated mice as compared to naïve mice; however, when compared to wild-type ASNase–treated mice, only CD4 T cell numbers were increased in ERY1-ASNase–treated mice (Fig. 2C; flow cytometry gating in figs. S2, S4, and S5 and full data in tables S2, S4, and S5). ERY1-ASNase also slightly reduced the numbers of mature myeloid cells (MHC-II+ CD11b+) in the bone marrow when compared to wild-type ASNase–treated or naïve mice. No differences in any of the measured B cell populations (total, early mature, mature, pro- and pre-B, transitional) were detected in the bone marrow. Together, our multiorgan phenotypic analyses indicate that administration of ERY1-ASNase does not nonspecifically deplete the main immune cell populations that drive humoral immunogenicity.
Fig. 2. Immunophenotyping demonstrates that ERY1-ASNase induces minimal changes in the immune cell repertoire.
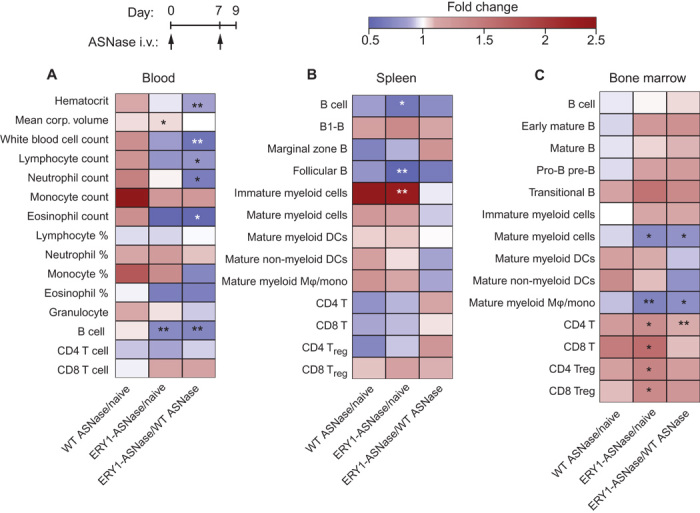
Mice were administered two weekly intravenous (i.v.) injections of 15 μg of ERY1-ASNase or WT ASNase, and hematology measurements and immune cell analyses were performed. (A) Hematology parameters and B and T cell population enumeration in the blood (granulocyte, B, CD4 T, and CD8 T cell populations determined by flow cytometry; all others by hematology analyzer). (B and C) Immune cell population enumeration in the spleen (B) and bone marrow (C), determined by flow cytometry (all data presented as relative fold change between groups; n = 5; Student’s two-tailed t test: *P < 0.05, **P < 0.01, ***P < 0.001).
Erythrocyte-binding ASNase induces sustained antigen-specific tolerance to multiple follow-on challenges with antigen
We next tested the tolerogenic capacity of ERY1-ASNase in various treatment schemes in mice, measuring antigen-specific humoral responses over time. Specifically, each treatment scheme consisted of eight weekly 15-μg intravenous doses of wild-type ASNase or ERY1-ASNase, and weekly blood analysis of ASNase-specific immunoglobulin G (IgG) was performed from day 17 onward. Blood analysis performed at time points beyond the final eighth weekly intravenous dose (49 days) reflects long-term follow-up of titer levels, up to 45 days later (94 days), in the absence of additional dosing during that period. In a prophylactic tolerance scheme (where the wild-type protein would be the anticancer therapeutic), mice were first tolerized with ERY1-ASNase for one or two weekly doses and then crossed to weekly treatment with wild-type ASNase for the remaining doses. In a therapeutic scheme (where ERY1-ASNase would itself be the anticancer therapeutic), ERY1-ASNase was administered weekly throughout the study without crossover. Identical weekly doses of filtered wild-type ASNase (0.22-μm filtered, similarly to ERY1-ASNase) and nonfiltered wild-type ASNase (as instructed by the package insert) were administered to mice as positive control groups (filtered, to exclude the possibility that any improvements observed could be attributed to the removal of aggregates from the clinical preparation). Immunogenicity analysis of the dosing regimens revealed that prophylactic treatment with ERY1-ASNase resulted in the prevention of a marked ASNase-specific humoral response despite sustained follow-on treatment with wild-type ASNase (Fig. 3A; corresponding absorbance data in fig. S6). The lack of humoral response was evidenced by the absence of anti-ASNase antibodies at final blood collection (94 days), after treatment with one prophylactic dose of ERY1-ASNase followed by seven subsequent doses of wild-type ASNase, for a total of eight weekly ASNase treatments (mean anti-ASNase total IgG log10 titer = 0; P = 0.63 for comparison against the naïve population; anti-ASNase seropositivity of naïve mice in fig. S7). Similarly, final blood analysis (84 days), after two prophylactic doses followed by six doses of wild-type ASNase for eight total ASNase treatments, also yielded mean total anti-ASNase IgG titers (log10 = 0.25) that were not statistically different from the naïve population (P = 0.97) or from the single prophylactic ERY1-ASNase treatment regimen (P = 0.60). In contrast, cohorts administered with nonfiltered or filtered wild-type ASNase developed more than 2000-fold greater anti-ASNase titer values (mean total IgG log10 titers = 3.5 and 3.4, respectively, at final blood analysis; P < 0.0001 for filtered wild-type ASNase treatment against the naïve population, P < 0.0001 for wild-type ASNase against each of the prophylactic ERY1-ASNase treatment regimens, respectively). Similarly to the prophylactically treated groups, mice treated solely with ERY1-ASNase for all eight doses maintained a low mean log10 titer value of 1.2, representing a 180-fold reduction compared to wild-type ASNase (P = 0.007). Notably, the slight increase in mean anti-ASNase titers after eight weekly ERY1-ASNase treatments as compared to the one- or two-dose prophylactic treatments might be attributable to a detrimental excess of drug loaded onto erythrocytes during sustained dosing, given that the circulation time of ERY1-ASNase was much longer than the separation between consecutive doses. Titers remained unchanged after final injections for the duration of observation periods (at least 3 to 6 weeks after final injection).
Fig. 3. Erythrocyte-binding ASNase is nonimmunogenic and acts as a tolerogen that enables follow-on treatment with WT enzyme.
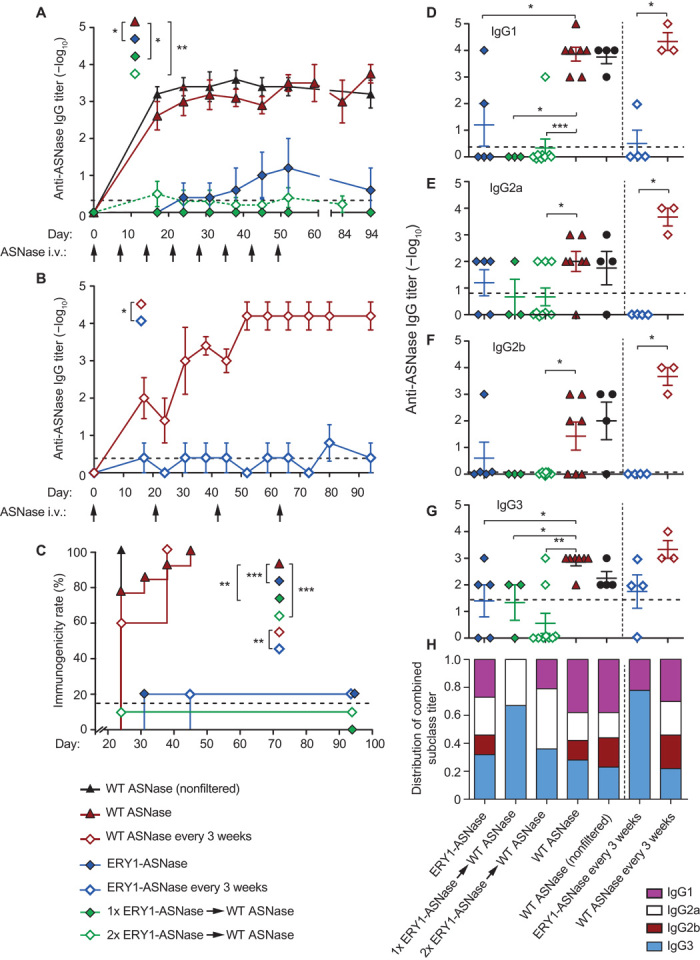
(A) Time course of anti-ASNase IgG antibody development in plasma of mice administered with eight weekly 15-μg doses of either WT ASNase or ERY1-ASNase or with one or two tolerogenic doses of ERY1-ASNase followed by WT ASNase for the remaining doses (end-point IgG titers, Mann-Whitney U test: *P ≤ 0.05, **P ≤ 0.01, ***P ≤ 0.001). (B) Time course of anti-ASNase IgG antibody development in plasma of mice administered a dose-sparing regimen of 15 μg of either WT ASNase or ERY1-ASNase every 3 weeks for a total of four doses (end-point IgG titers, Mann-Whitney U test: *P ≤ 0.05, **P ≤ 0.01, ***P ≤ 0.001). (C) Immunogenicity incidence rates of the dosing regimens of ERY1-ASNase and WT ASNase (Mantel-Cox test: *P ≤ 0.05, **P ≤ 0.01, ***P ≤ 0.001). (D to G) End-point plasma anti-ASNase antibody titers of subclass (D) IgG1, (E) IgG2a, (F) IgG2b, and (G) IgG3 (Mann-Whitney U test: *P ≤ 0.05, **P ≤ 0.01, ***P ≤ 0.001). Initial dilutions were 100-fold for all samples; dotted lines indicate mean values for the naïve population (n = 149); data are presented as means ± SEM (n = 4 to 9 per group until 80 days; n = 3 to 9 from 80 days onward). (H) End-point IgG subclass profile, as calculated by normalization of the sum of all titers across subclasses (n = 3 to 9).
Given the prolonged pharmacodynamic effect of ERY1-ASNase as compared to wild-type ASNase, we tested a less frequent dosing regimen that corresponded to the 25-day therapeutic effect (plasma asparagine depletion) we observed for ERY1-ASNase. This dosing regimen consisted of treatment with either ERY1-ASNase or wild-type ASNase every 3 weeks for a total of four injections over the course of 63 days. In keeping with the results from weekly dosing, ERY1-ASNase–treated mice did not develop significant anti-ASNase IgG titers (mean log10 titer = 0.4) upon regimen completion (66 days), whereas wild-type ASNase treatment resulted in mean anti-ASNase titers 12,600-fold higher (mean log10 titer = 4.5) than that of the ERY1-ASNase–treated group (Fig. 3B).
In addition to the difference in magnitude of anti-ASNase immune responses, the overall difference in the immunogenicity response rates of cohorts administered various dosing regimens further highlights the impact of erythrocyte binding–driven tolerance induction. Immunogenicity rate analysis was based on the assessment of ASNase-specific total IgG titers, where each mouse was judged as having an immune response after two or more consecutive measurements of total IgG log10 titer ≥2. The resulting depiction of immunogenicity rates further illustrates the attenuation of immunogenicity incidences after treatment with ERY1-ASNase as compared to wild-type ASNase: anti-ASNase antibodies were detectable in 100% of mice dosed with filtered or nonfiltered wild-type ASNase, as measured by total IgG titers, with 95% of these mice developing moderate to high titers (log10 titer levels between 3 and 5), whereas only 21% of mice (5 of 24) receiving any of the ERY1-ASNase treatment regimens had detectable levels of anti-ASNase antibodies, as measured by total IgG titers, and only 4% (1 of 24 mice) among the four different ERY1-ASNase–related treatment regimens developed a moderate total IgG log10 titer of 4 (Fig. 3C). As a metric of comparison, anti-ASNase total IgG antibody titers were detectable in 15% of the naïve population (fig. S7).
Finally, we characterized the IgG subclasses of the measured antibody responses upon completion of each dosing regimen (Fig. 3, D to H). Classification analysis revealed that wild-type ASNase treatment induced ASNase-specific antibodies distributed across all subclasses, with IgG1 as the most dominant subclass relative to others. In contrast, antibody responses against ERY1-ASNase were blunted across all IgG subclasses. For those low antibody titers that developed, ERY1-ASNase treatment resulted in a distribution primarily skewed toward IgG3. Murine IgG3 has been reported to exhibit the lowest capacity for Fc receptor activation among the IgG subclasses owing to its restricted binding to only one of the three activating Fcγ receptors (23, 24). Consequently, its reduced ability for potentiating an immune response may thus be considered as a preferred profile when the limitation of immunogenicity is a primary goal. Additionally, murine IgG3 has been previously reported to be produced in response to T cell–independent antigens (25). It follows that antigen-specific deletion of T cell help after tolerizing treatment (15) may thus contribute to a lower relative proportion of T-dependent response.
To assess the antigen specificity of tolerance induction, we performed an analogous crossover study as shown in Fig. 3A, yet using an irrelevant (nontolerized) antigen for challenge. As previously described, mice were intravenously administered a single 15-μg dose of either ERY1-ASNase or wild-type ASNase and, starting 7 days later, were challenged intravenously with five weekly 10-μg doses of the irrelevant antigen chicken ovalbumin (OVA) (Fig. 4A). Throughout the OVA challenge regimen, all mice developed robust anti-OVA IgG responses regardless of the initial priming/tolerizing dose (Fig. 4B), illustrating that tolerance induction with ERY1-ASNase did not inhibit immune responses to other antigens. Together with the results of Fig. 3A, these data demonstrate that erythrocyte-binding antigen induces humoral immune tolerance in an antigen-specific manner.
Fig. 4. ERY1-ASNase treatment induces antigen-specific tolerance in a nontoxic and age-independent manner.
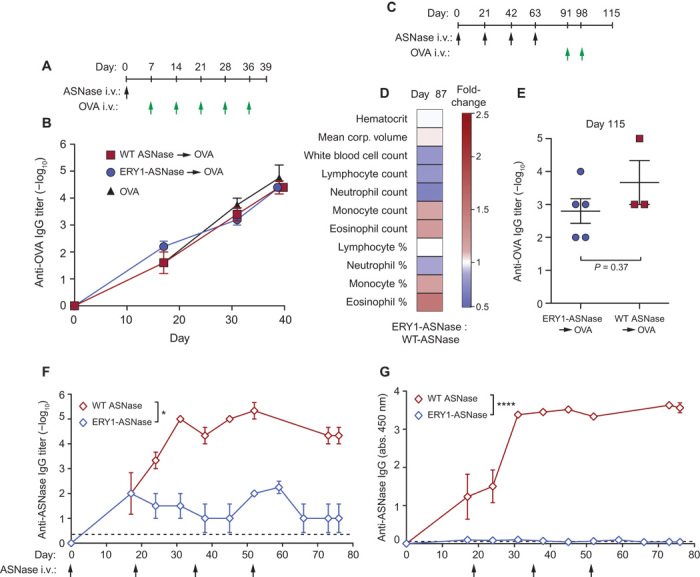
(A) Mice were assessed for their capacity to respond to the irrelevant (nontolerized) antigen OVA after a single tolerogenic dose of ERY1-ASNase. (B) Time course of the development of anti-OVA total IgG in mice tolerized with 15 μg of ERY1-ASNase or WT ASNase and challenged with five weekly intravenous doses of OVA. (C) Mice were assessed for hematological parameters and for capacity to respond to the irrelevant antigen OVA after chronic intravenous administration with 15 μg of ERY1-ASNase or WT ASNase every 3 weeks for a total of four injections. (D) Hematological parameters at day 87 (data presented as ERY1-ASNase fold increase over WT ASNase; Student’s two-tailed t test, P > 0.05 for all parameters, n = 3 to 5). (E) Quantification of end-point antigen-specific total IgG responses to a challenge with the irrelevant T cell–dependent antigen OVA (n = 3 to 5, Mann-Whitney U test). (F and G) Time course of anti-ASNase IgG development in plasma of aged (27-week-old) mice receiving 15 μg of ERY1-ASNase or WT ASNase, represented as (F) log10 titer (n = 3 to 4, Mann-Whitney U test, *P < 0.05) and (G) absorbance reading of 1:100 dilution of plasma [n = 3 to 4; analysis of variance (ANOVA), ****P < 0.0001)]; dotted lines indicate mean values for the naïve population (n = 149).
To determine whether chronic administration of ERY1-ASNase induced any changes in the immune cell repertoire, we measured hematological parameters in mice after four 15-μg intravenous doses of ERY1-ASNase or wild-type ASNase every 3 weeks (Fig. 4C). Similar to weekly administration, chronic ERY1-ASNase administration did not induce any significant secondary alterations in hematological parameters as compared to wild-type ASNase treatment (Fig. 4D; full data in table S6). Furthermore, to demonstrate the antigen specificity of ERY1-ASNase–driven tolerance induction after multiple tolerogenic doses, we subsequently crossed over the mice to intravenous treatment with OVA. Even in this chronic administration setting, the antigen specificity of immune tolerance to ASNase was confirmed by the induction of robust humoral responses to follow-on challenge with the irrelevant antigen OVA in both the ERY1-ASNase– and wild-type ASNase–treated groups (Fig. 4E).
Because erythrocyte-driven tolerance requires T cell priming and proliferation to a tolerogenic phenotype (15), we explored the efficacy of tolerogenesis in aged mice, where less dynamic T cell responses might hinder such tolerogenic T cell activity (26). Analogous administration regimens and humoral immunogenicity measurements were conducted as described above, but with 27-week-old mice as opposed to 8-week-old mice. After administrations of 15 μg of ERY1-ASNase or wild-type ASNase every 3 weeks for a total of four doses, wild-type ASNase–treated mice developed robust anti-ASNase humoral immunity (log10 titer = 5.3), whereas ERY1-ASNase–treated mice developed responses at the limit of assay detection (log10 titer = 2), representing a >2100-fold reduction in immunogenicity (Fig. 4, F and G). Such efficacy in an aged immune system suggests that age-dependent immune populations are not the primary drivers of erythrocyte-driven tolerogenesis in mice, although clearly, no firm conclusions on the relevance to aged ALL patients may be drawn before clinical investigation.
Adoptive transfer of 34 million splenocytes from tolerized mice (prophylactically treated with ERY1-ASNase) into naïve mice did not confer protection against two subsequent challenges with 15 μg of wild-type ASNase, suggesting inadequate quantity or insufficient expansion of ASNase-specific Treg cell populations (fig. S8). Although our results do not categorically preclude a role for Treg cells, they are consistent with our previously published mechanistic results that implicate T cell deletion and anergy as the primary drivers of erythrocyte-binding tolerance induction (15). Rather, these results may suggest that transfer of splenocytes without ASNase-reactive T cells (due to deletion) or immunologically unresponsive (anergic) populations of T cells is ineffective in suppressing immune responses in recipient animals.
DISCUSSION
In these studies, we establish the feasibility of inducing antigen-specific tolerance to a clinically relevant, immunogenic protein drug by way of administration of an erythrocyte-binding variant of the drug. To this end, we engineered a variant of the highly foreign enzyme E. coli ASNase, used in the treatment of ALL, which is capable of binding to erythrocytes in situ upon injection. We demonstrated that the enzymatic activity of the ASNase variant was unaltered despite the chemical modification made to impart binding to the erythrocyte surface. With a focus on clinical translation of the erythrocyte binding approach, animal modeling was performed analogous to relevant primary end points reported for recent clinical trials involving novel ASNase treatments (27) (U.S. National Institute of Health clinical trial identifiers NCT00784017 and NCT01643408; E.U. clinical trials database numbers 2005-000658-56 and 2009-012584-34). In recent ALL ASNase trials, primary end points relating to drug pharmacodynamics, such as reduction of blood asparagine or activity of ASNase, have been accepted because it has been established that high anti-drug antibody response rates can hinder clinical efficacy because of premature clearance of ASNase. Thus, our in vivo studies were similarly designed to include metrics such as asparagine depletion (drug efficacy) and antigen-specific immune response (safety). Additional safety metrics, such as immunophenotyping and hematological analyses, were also performed.
We demonstrate that engineering ASNase to bind erythrocytes both extends the pharmacodynamic effect of the drug 10-fold in mice and induces durable antigen-specific tolerance to the drug. We show that prophylactic treatment with ERY1-ASNase antigen-specifically abrogates development of antibody titers by >1000-fold as compared to treatment with the clinical wild-type ASNase alone. Although fold changes in an animal model are not expected to be predictive of equivalent changes in humans, we consider that the robust antibody reduction consistently demonstrated in tolerized groups despite multiple variations in dosing scheme and age merits further exploration in additional preclinical models, such as in nonhuman primates. The prevention of antigen-specific humoral immune response demonstrated herein has substantial relevance to the clinic, where anti-ASNase neutralizing antibodies are associated with poorer treatment prognosis for ALL patients (17, 21, 22). Others have sought to engineer similar strategies to overcome the clinical immunogenicity hurdles of ASNase by entrapping the drug in donor erythrocytes ex vivo and infusing the manipulated cells into patients. This approach, which exploits shielding from the immune system, has been reported to reduce allergic responses and prolong pharmacodynamic effects in the clinic (27). It remains to be seen whether such an approach results in durable prevention of anti-ASNase antibodies upon reexposure, development of which may suggest that external co-display of therapeutic protein and tolerogenic cell surface signaling is indispensable for tolerance induction.
Notably, we showed that even a single dose of the erythrocyte-binding ASNase yields long-term (94 days) tolerance to seven subsequently administered doses of wild-type ASNase. Although more work needs to be done to determine the absolute duration of a single tolerogenic dose of ERY1-ASNase, we demonstrate tolerance induction over time scales that are about fourfold longer than the reported median survival rates of single-dose wild-type ASNase therapy in mouse models of ALL, suggesting that our dosing regimens are relevant to preclinical ALL modeling (28). We have previously demonstrated that our erythrocyte binding strategy induces antigen-specific CD4 and CD8 T cell tolerance through exhaustion and deletion mechanisms (15). Here, we hypothesized that T cell deletion mediated by erythrocyte binding would result in measurable decreases in T cell–dependent humoral immunity. The current data support this hypothesis and suggest that abolishing antigen-specific T cell help to B cells may effectively prevent the development of anti-drug antibodies—even in the challenging example when the drug is an E. coli protein. Although the complete mechanism of tolerance induction by erythrocyte binding strategies is not yet fully understood, we have shown that natural apoptotic signals such as annexin V binding and programmed cell death 1 (PD-1) play a role in the antigen-specific CD4 and CD8 T cell deletion after administration of erythrocyte-binding antigen (15). Other recent antigen-specific strategies, in addition to ours, have yielded promising results by exploiting apoptosis signaling pathways to achieve tolerance. For example, liposomal formulations that co-display antigen with defined amounts of the apoptosis signal phosphatidylserine have been demonstrated to reduce dendritic cell maturation by inhibition of CD86 and CD40 up-regulation (29). Similarly, synthetic co-display of antigen and glycan ligands of the B cell siglec CD22 has been shown to enhance B cell apoptosis and thereby reduce antibody titers by 1 to 3 log10 after two challenges (30). Given that erythrocytes are densely decorated with sialic acids (siglec ligands) and up-regulate phosphatidylserine during eryptosis, it is possible that our strategy exploits multiple, natural, apoptosis signaling pathways during induction of antigen-specific tolerance. Others have aimed to achieve more physiologically complex displays of natural apoptosis signaling by combining antigen delivery with cell-based techniques. For example, apoptosis signaling has been implicated in the encouraging decreases in pathogenic antigen–specific T cell responses and expansion of Treg cell populations observed after delivery of cells chemically conjugated with antigen ex vivo (31, 32) or after delivery of antigen and healthy phagocytes following systemic sublethal irradiation (33). However, the additional complexities and potential risks relating to these techniques, including sourcing of self or donor cells, ex vivo manipulation of human tissue before reintroduction into the patient, and systemic irradiation, may hinder their translation to the clinic.
Our erythrocyte binding approach is different from previous antigen-specific approaches in that we combine the simplicity of defined pharmaceutical formulations with the more complex cellular signaling of cell-based techniques while still avoiding ex vivo sourcing or manipulation. Cell binding with our approach occurs in situ after simple injection of the protein conjugate. By engineering the clinical therapeutic enzyme E. coli ASNase to bind both healthy and apoptotic erythrocytes in situ, we can exploit natural apoptosis signaling as the erythrocytes age to induce humoral immune tolerance to a highly foreign therapeutic protein. We have demonstrated aspects of erythrocyte-binding tolerance with model proteins and autoantigens (15) and here with the therapeutic protein ASNase; however, realization of the platform potential of this technology will require future work with additional protein targets. Although we acknowledge the limitation of using inbred mouse strains to study immune responses toward an antigen that is clinically administered to a heterogeneous human haplotype population, it is noted that the degree of antigenicity (corollary to evolutionary distance) between E. coli and mice is similar to that between E. coli and humans. Our results have potential implications for immunogenic life-saving therapies, such as ASNase in ALL and enzyme replacement therapies in rare diseases, where neutralizing antibody responses may leave few or no options for salvage treatment with another therapy; ASNase from the bacterium Erwinia chrysanthemi is currently used clinically as a salvage therapy in ALL, albeit at the risk of developing additional anti-ASNase antibodies toward this foreign enzyme (34). Moreover, prolonged pharmacodynamics may contribute to improving treatment efficacy for some protein therapies. Thus, the tolerogenic and dose-sparing attributes of ERY1-ASNase illustrated here highlight the potential of the erythrocyte binding technology to improve the safety and efficacy of immunogenic therapeutic proteins.
MATERIALS AND METHODS
Experimental design
The overall hypothesis we aimed to answer was if induction of humoral immune tolerance to an immunogenic therapeutic protein could be induced by engineering the protein for erythrocyte binding, thus harnessing the tolerogenic potential of apoptotic cell–driven tolerance. BALB/cOlaHsd mice were used because of their robust IgG responses to ASNase.
Animals
Swiss Veterinary authorities previously approved all animal procedures. Eight- to 12-week-old female BALB/cOlaHsd mice (Harlan) were used for all in vivo studies, except for aging effect studies, where mice were used at 27 weeks of age. Mice were housed in the Ecole Polytechnique Fédérale de Lausanne (EPFL) Animal Facility. Exclusion criteria from any study were 15% weight loss or affliction with spontaneous disease or malaise judged as irrelevant to the study, as directed by the Swiss Federal Veterinary Authority; no mice met the exclusion criteria during the studies. All mouse studies were performed with age-matched control groups.
ASNase conjugation
The erythrocyte-binding ERY1 peptide (19) (H2N-WMVLPWLPGTLDGGSGCRG-CONH2) was custom-synthesized (GenScript) to result in conjugation of the ERY1 peptide to the lysine residues of ASNase: the underlined sequence is the 12-residue erythrocyte-binding domain, GGSG serves as a linker to the sulfhydryl of the cysteine residue used for conjugation (bold), and the flanking arginine residue serves to lower the pKa and thus increase the reactivity of the sulfhydryl group (35). Clinical wild-type ASNase from E. coli (Asparaginase 5000, Medac GmbH) was resuspended in 2 ml of sterile 0.9% saline (B. Braun) and diluted with phosphate-buffered saline (PBS) to a concentration of 5 mg/ml. Ten molar equivalents of SMCC [sulfosuccinimidyl- 4-(N-maleimidomethyl) cyclohexane-1-carboxylate; Thermo Scientific] dissolved in sterile dimethylformamide was added to the solution. The reaction was incubated for 1 hour at room temperature and desalted by two passes through Zeba Desalt spin columns (Thermo Scientific). Three molar equivalents of ERY1-Cys dissolved in 3 M guanidine hydrochloride was then added to the desalted, SMCC-conjugated ASNase; incubated at room temperature for 30 min; and passed through a Zeba Desalt spin column (Thermo Scientific) twice. The product was sterile-filtered (0.2 μm), aliquoted, and stored at −20°C. Protein concentration was determined by bicinchoninic acid assay (Thermo Scientific). The specific activities of wild-type ASNase and ERY1-ASNase were determined by a fluorometric asparaginase activity assay kit (BioVision), using aspartate as a standard.
In vivo circulation and binding
Fifteen micrograms of either ERY1-ASNase or wild-type ASNase in 100 μl of 0.9% saline (B. Braun) was injected into the tail vein of mice anesthetized with isoflurane. At predetermined time points, 2.5 μl of whole blood was collected by a small tail incision and diluted 50-fold in cold PBS with bovine serum albumin (10 mg/ml). Erythrocyte-bound ASNase levels were directly assayed by flow cytometry on a CyAn ADP analyzer (Beckman Coulter). Samples were kept on ice to limit ERY1-ASNase dissociation from the erythrocyte surface. Labeling was performed with polyclonal rabbit anti-ASNase (Abnova) and Alexa Fluor 488 chicken anti-rabbit IgG (Life Technologies). For apoptosis assays, annexin V–Cy5 staining was performed on ice for 5 min before analysis. For pharmacokinetic studies, flow cytometer settings were fixed for the duration of the study.
Immunogenicity assessment
For each dosing regimen, a 100-μl volume containing 15 μg of either ERY1-ASNase or wild-type ASNase in 0.9% saline was injected into the tail vein of anesthetized mice. Blood was collected from either the submandibular or the saphenous vein at predetermined time points; all groups were bled via the same route on the same day, and routes were alternated each time to minimize irritation. Care was taken to minimize volume of blood sampling. Blood was collected into EDTA tubes, and plasma was stored at −20°C. For analysis of general hematological parameters, blood samples were directly diluted twofold with 0.9% saline and analyzed on an Advia 120 Hematology System (Siemens).
Plasma samples were assayed for the presence of ASNase-specific IgG antibodies by direct enzyme-linked immunosorbent assay (ELISA), using horseradish peroxidase–conjugated goat-anti mouse IgG, IgG1, IgG2a, IgG2b, and IgG3 (all from Southern Biotech). ELISA steps were performed at room temperature, and 2.5% casein (w/v) was used as a blocking and binding buffer. In brief, ASNase-coated plates were blocked for 2 hours, washed extensively with PBS-Tween, incubated with diluted plasma samples for 2 hours, washed, incubated with detection antibody for 1 hour, washed, developed with 3,3′,5,5′-tetramethylbenzidine substrate (eBioscience) for 30 min, and quenched with 9.8% (v/v) H2SO4 in water. IgG titers were calculated as the dilution of serum that produced an absorbance twofold above background. Total IgG anti-ASNase characterization of a naïve mouse population (n = 149) yielded 15% of mice with a log10 titer ≥2. Total IgG log10 titer <2 was thereby considered as not meaningful in discerning immunity from nonimmunity, and dilutions were consequently begun at 100-fold to minimize blood volume collected from animals. After the initial 100-fold dilution, serial dilutions were performed at 10-fold thereafter. In the study with 27-week-old mice, if an animal developed antigen-specific log10 titers ≥5, then it was not reinjected with antigen to avoid anaphylactic responses upon reinjection.
Statistical analysis
All flow cytometry data were analyzed in FlowJo (v9.7.5, Tree Star Inc.). Prism (v5, GraphPad) was used for graphical representation of data, and both Prism and R (v 3.0.2, The R Foundation for Statistical Computing) were used for statistical testing. Mann-Whitney U tests were used for interpreting FACS (fluorescence-activated cell sorting) population and end-point IgG titer data, two-way ANOVA was used for interpreting IgG absorbance data, Student’s two-tailed t test was used for interpreting hematology data, and log-rank Mantel-Cox tests were used for interpreting immunogenicity rate data.
Flow cytometry
Cell samples were washed in PBS before live/dead staining for 20 min on ice; the cells were then surface-stained for 20 min on ice in the presence of 2.4G2 hybridoma supernatant, fixed in 2% paraformaldehyde for 15 min on ice, and washed with PBS supplemented with 2% fetal bovine serum before analysis. For annexin V staining, nonfixed samples were incubated with annexin V–Cy5 for 5 min in annexin V staining buffer (BioVision) before analysis. Samples were analyzed on a CyAn ADP Analyzer (Beckman Coulter) or an LSR-II flow cytometer (BD Biosciences).
Additional materials and methods
Flow cytometry reagents and LC-MS for quantification of plasma asparagine concentrations are described in detail in Supplementary Materials and Methods.
Acknowledgments
We would like to thank A. Plassard, J. Cesbron, V. Blancheteau, X. Quaglia, and the EPFL Center for Phenogenomics and Flow Cytometry Core Facility for technical assistance; K. Shakhbazov for assistance with R code; and A. H. Grimm, K. L. Brünggel, and L. Jeanbart for helpful discussions. Funding: This work was supported in part by the EPFL School of Life Sciences and the Swiss Commission for Technology and Innovation. Author contributions: K.M.L., S.K., and J.A.H. designed the research and wrote the paper. K.M.L., S.K., and G.D. performed the research and analyzed data. H.H. developed analytical tools and analyzed samples. Competing interests: The Εcole Polytechnique Fédérale de Lausanne has filed for patent protection on the technology described herein, and S.K. and J.A.H. are named as inventors on those patents; K.M.L., S.K., and J.A.H. are shareholders in Anokion SA, which has licensed those patents.
SUPPLEMENTARY MATERIALS
Supplementary material for this article is available at http://advances.sciencemag.org/cgi/content/full/1/6/e1500112/DC1
Materials and Methods
Fig. S1. Flow cytometry gating strategy for leukocyte populations in blood.
Fig. S2. Flow cytometry gating strategy for Treg cells in the blood, bone marrow, and spleen.
Fig. S3. Flow cytometry gating strategy for B cell populations in the spleen.
Fig. S4. Flow cytometry gating strategy for myeloid populations in the spleen and bone marrow.
Fig. S5. Flow cytometry gating strategy for B cell populations in the bone marrow.
Fig. S6. Erythrocyte-binding ASNase is nonimmunogenic and acts as a tolerogen that enables follow-on treatment with wild-type enzyme.
Fig. S7. Anti-ASNase seropositivity analysis in naïve BALB/cOlaHsd mice.
Fig. S8. Adoptive transfer of splenocytes from ERY1-ASNase tolerized mice does not transfer tolerance.
Table S1. Hematology characterization after short-term treatment regimens.
Table S2. T cell characterization after short-term treatment regimens.
Table S3. B cell characterization after short-term treatment regimens.
Table S4. Myeloid cell characterization after short-term treatment regimens.
Table S5. B cell characterization after short-term treatment regimens.
Table S6. Hematology characterization after long-term treatment regimens.
REFERENCES AND NOTES
- 1.Nechansky A., Kircheis R., Immunogenicity of therapeutics: A matter of efficacy and safety. Expert Opin. Drug Discov. 5, 1067–1079 (2010). [DOI] [PubMed] [Google Scholar]
- 2.Baker M. P., Reynolds H. M., Lumicisi B., Bryson C. J., Immunogenicity of protein therapeutics: The key causes, consequences and challenges. Self Nonself 1, 314–322 (2010). [DOI] [PMC free article] [PubMed] [Google Scholar]
- 3.Joly M. S., Martin R. P., Mitra-Kaushik S., Phillips L., D’Angona A., Richards S. M., Joseph A. M., Transient low-dose methotrexate generates B regulatory cells that mediate antigen-specific tolerance to alglucosidase α. J. Immunol. 193, 3947–3958 (2014). [DOI] [PubMed] [Google Scholar]
- 4.Banugaria S. G., Prater S. N., McGann J. K., Feldman J. D., Tannenbaum J. A., Bailey C., Gera R., Conway R. L., Viskochil D., Kobori J. A., Rosenberg A. S., Kishnani P. S., Bortezomib in the rapid reduction of high sustained antibody titers in disorders treated with therapeutic protein: Lessons learned from Pompe disease. Genet. Med. 15, 123–131 (2013). [DOI] [PMC free article] [PubMed] [Google Scholar]
- 5.Garay R. P., El-Gewely R., Armstrong J. K., Garratty G., Richette P., Antibodies against polyethylene glycol in healthy subjects and in patients treated with PEG-conjugated agents. Expert Opin. Drug Deliv. 9, 1319–1323 (2012). [DOI] [PubMed] [Google Scholar]
- 6.Armstrong J. K., Hempel G., Koling S., Chan L. S., Fisher T., Meiselman H. J., Garratty G., Antibody against poly(ethylene glycol) adversely affects PEG-asparaginase therapy in acute lymphoblastic leukemia patients. Cancer 110, 103–111 (2007). [DOI] [PubMed] [Google Scholar]
- 7.Hershfield M. S., Ganson N. J., Kelly S. J., Scarlett E. L., Jaggers D. A., Sundy J. S., Induced and pre-existing anti-polyethylene glycol antibody in a trial of every 3-week dosing of pegloticase for refractory gout, including in organ transplant recipients. Arthritis Res. Ther. 16, R63 (2014). [DOI] [PMC free article] [PubMed] [Google Scholar]
- 8.De Groot A. S., Martin W. D., Reducing risk, improving outcomes: Bioengineering less immunogenic protein therapeutics. Clin. Immunol. 131, 189–201 (2009). [DOI] [PubMed] [Google Scholar]
- 9.Moise L., Song C., Martin W. D., Tassone R., De Groot A. S., Scott D. W., Effect of HLA DR epitope deimmunization of Factor VIII in vitro and in vivo. Clin. Immunol. 142, 320–331 (2012). [DOI] [PMC free article] [PubMed] [Google Scholar]
- 10.Parker A. S., Choi Y., Griswold K. E., Bailey-Kellogg C., Structure-guided deimmunization of therapeutic proteins. J. Comput. Biol. 20, 152–165 (2013). [DOI] [PMC free article] [PubMed] [Google Scholar]
- 11.Liu W., Onda M., Lee B., Kreitman R. J., Hassan R., Xiang L., Pastan I., Recombinant immunotoxin engineered for low immunogenicity and antigenicity by identifying and silencing human B-cell epitopes. Proc. Natl. Acad. Sci. U.S.A. 109, 11782–11787 (2012). [DOI] [PMC free article] [PubMed] [Google Scholar]
- 12.Cantor J. R., Panayiotou V., Agnello G., Georgiou G., Stone E. M., Engineering reduced-immunogenicity enzymes for amino acid depletion therapy in cancer. Methods Enzymol. 502, 291–319 (2012). [DOI] [PubMed] [Google Scholar]
- 13.Green D. R., Ferguson T., Zitvogel L., Kroemer G., Immunogenic and tolerogenic cell death. Nat. Rev. Immunol. 9, 353–363 (2009). [DOI] [PMC free article] [PubMed] [Google Scholar]
- 14.Griffith T. S., Ferguson T. A., Cell death in the maintenance and abrogation of tolerance: The five Ws of dying cells. Immunity 35, 456–466 (2011). [DOI] [PMC free article] [PubMed] [Google Scholar]
- 15.Kontos S., Kourtis I. C., Dane K. Y., Hubbell J. A., Engineering antigens for in situ erythrocyte binding induces T-cell deletion. Proc. Natl. Acad. Sci. U.S.A. 110, E60–E68 (2013). [DOI] [PMC free article] [PubMed] [Google Scholar]
- 16.Panosyan E. H., Seibel N. L., Martin-Aragon S., Gaynon P. S., Avramis I. A., Sather H., Franklin J., Nachman J., Ettinger L. J., La M., Steinherz P., Cohen L. J., Siegel S. E., Avramis V. I., Children’s Cancer Group Study CCG-1961, Asparaginase antibody and asparaginase activity in children with higher-risk acute lymphoblastic leukemia: Children’s Cancer Group Study CCG-1961. J. Pediatr. Hematol. Oncol. 26, 217–226 (2004). [DOI] [PubMed] [Google Scholar]
- 17.Avramis V. I., Avramis E. V., Hunter W., Long M. C., Immunogenicity of native or pegylated E. coli and Erwinia asparaginases assessed by ELISA and surface plasmon resonance (SPR-biacore) assays of IgG antibodies (Ab) in sera from patients with acute lymphoblastic leukemia (ALL). Anticancer Res. 29, 299–302 (2009). [PubMed] [Google Scholar]
- 18.Oettgen H. F., Stephenson P. A., Schwartz M. K., Leeper R. D., Tallai L., Tan C. C., Clarkson B. D., Golbey R. B., Krakoff I. H., Karnofsky D. A., Murphy M. L., Burchenal J. H., Toxicity of E. coli l-asparaginase in man. Cancer 25, 253–278 (1970). [DOI] [PubMed] [Google Scholar]
- 19.Kontos S., Hubbell J. A., Improving protein pharmacokinetics by engineering erythrocyte affinity. Mol. Pharm. 7, 2141–2147 (2010). [DOI] [PubMed] [Google Scholar]
- 20.Narta U. K., Kanwar S. S., Azmi W., Pharmacological and clinical evaluation of l-asparaginase in the treatment of leukemia. Crit. Rev. Oncol. Hematol. 61, 208–221 (2007). [DOI] [PubMed] [Google Scholar]
- 21.Chien W.-W., Allas S., Rachinel N., Sahakian P., Julien M., Le Beux C., Lacroix C.-E., Abribat T., Salles G., Pharmacology, immunogenicity, and efficacy of a novel pegylated recombinant Erwinia chrysanthemi-derived l-asparaginase. Invest. New Drugs 32, 795–805 (2014). [DOI] [PubMed] [Google Scholar]
- 22.Rizzari C., Shedding light on the asparaginase galaxy. Blood 123, 1976–1978 (2014). [DOI] [PubMed] [Google Scholar]
- 23.Nimmerjahn F., Bruhns P., Horiuchi K., Ravetch J. V., FcγRIV: A novel FcR with distinct IgG subclass specificity. Immunity 23, 41–51 (2005). [DOI] [PubMed] [Google Scholar]
- 24.Bruhns P., Properties of mouse and human IgG receptors and their contribution to disease models. Blood 119, 5640–5649 (2012). [DOI] [PubMed] [Google Scholar]
- 25.Snapper C. M., McIntyre T. M., Mandler R., Pecanha L. M., Finkelman F. D., Lees A., Mond J. J., Induction of IgG3 secretion by interferon γ: A model for T cell–independent class switching in response to T cell–independent type 2 antigens. J. Exp. Med. 175, 1367–1371 (1992). [DOI] [PMC free article] [PubMed] [Google Scholar]
- 26.Nikolich-Žugich J., Aging of the T cell compartment in mice and humans: From no naive expectations to foggy memories. J. Immunol. 193, 2622–2629 (2014). [DOI] [PMC free article] [PubMed] [Google Scholar]
- 27.Domenech C., Thomas X., Chabaud S., Baruchel A., Gueyffier F., Mazingue F., Auvrignon A., Corm S., Dombret H., Chevallier P., Galambrun C., Huguet F., Legrand F., Mechinaud F., Vey N., Philip I., Liens D., Godfrin Y., Rigal D., Bertrand Y.. , l-Asparaginase loaded red blood cells in refractory or relapsing acute lymphoblastic leukaemia in children and adults: Results of the GRASPALL 2005-01 randomized trial. Br. J. Haematol. 153, 58–65 (2011). [DOI] [PubMed] [Google Scholar]
- 28.Vadlamudi S., Padarathsingh M., Waravdekar V. S., Goldin A., Factors influencing the therapeutic activity of l-asparaginase (NSC 109229) in leukemic (L5178Y) mice. Cancer Res. 30, 1467–1472 (1970). [PubMed] [Google Scholar]
- 29.Gaitonde P., Peng A., Straubinger R. M., Bankert R. B., Balu-Iyer S. V., Phosphatidylserine reduces immune response against human recombinant Factor VIII in Hemophilia A mice by regulation of dendritic cell function. Clin. Immunol. 138, 135–145 (2011). [DOI] [PMC free article] [PubMed] [Google Scholar]
- 30.Macauley M. S., Pfrengle F., Rademacher C., Nycholat C. M., Gale A. J., von Drygalski A., Paulson J. C., Antigenic liposomes displaying CD22 ligands induce antigen-specific B cell apoptosis. J. Clin. Invest. 123, 3074–3083 (2013). [DOI] [PMC free article] [PubMed] [Google Scholar]
- 31.Getts D. R., Turley D. M., Smith C. E., Harp C. T., McCarthy D., Feeney E. M., Getts M. T., Martin A. J., Luo X., Terry R. L., King N. J. C., Miller S. D., Tolerance induced by apoptotic antigen-coupled leukocytes is induced by PD-L1+ and IL-10–producing splenic macrophages and maintained by T regulatory cells. J. Immunol. 187, 2405–2417 (2011). [DOI] [PMC free article] [PubMed] [Google Scholar]
- 32.Lutterotti A., Yousef S., Sputtek A., Stürner K. H., Stellmann J.-P., Breiden P., Reinhardt S., Schulze C., Bester M., Heesen C., Schippling S., Miller S. D., Sospedra M., Martin R., Antigen-specific tolerance by autologous myelin peptide-coupled cells: A phase 1 trial in multiple sclerosis. Sci. Transl. Med. 5, 188ra75 (2013). [DOI] [PMC free article] [PubMed] [Google Scholar]
- 33.Kasagi S., Zhang P., Che L., Abbatiello B., Maruyama T., Nakatsukasa H., Zanvit P., Jin W., Konkel J. E., Chen W., In vivo-generated antigen-specific regulatory T cells treat autoimmunity without compromising antibacterial immune response. Sci. Transl. Med. 6, 241ra78 (2014). [DOI] [PubMed] [Google Scholar]
- 34.Albertsen B. K., Schrøder H., Jakobsen P., Avramis V. I., Müller H.-J., Schmiegelow K., Carlsen N. T., Antibody formation during intravenous and intramuscular therapy with Erwinia asparaginase. Med. Pediatr. Oncol. 38, 310–316 (2002). [DOI] [PubMed] [Google Scholar]
- 35.Lutolf M. P., Tirelli N., Cerritelli S., Cavalli L., Hubbell J. A., Systematic modulation of Michael-type reactivity of thiols through the use of charged amino acids. Bioconjug. Chem. 12, 1051–1056 (2001). [DOI] [PubMed] [Google Scholar]
- 36.Rivera S., López-Soriano F. J., Azcón-Bieto J., Argilés J. M., Blood amino acid compartmentation in mice bearing Lewis lung carcinoma. Cancer Res. 47, 5644–5646 (1987). [PubMed] [Google Scholar]
Associated Data
This section collects any data citations, data availability statements, or supplementary materials included in this article.
Supplementary Materials
Supplementary material for this article is available at http://advances.sciencemag.org/cgi/content/full/1/6/e1500112/DC1
Materials and Methods
Fig. S1. Flow cytometry gating strategy for leukocyte populations in blood.
Fig. S2. Flow cytometry gating strategy for Treg cells in the blood, bone marrow, and spleen.
Fig. S3. Flow cytometry gating strategy for B cell populations in the spleen.
Fig. S4. Flow cytometry gating strategy for myeloid populations in the spleen and bone marrow.
Fig. S5. Flow cytometry gating strategy for B cell populations in the bone marrow.
Fig. S6. Erythrocyte-binding ASNase is nonimmunogenic and acts as a tolerogen that enables follow-on treatment with wild-type enzyme.
Fig. S7. Anti-ASNase seropositivity analysis in naïve BALB/cOlaHsd mice.
Fig. S8. Adoptive transfer of splenocytes from ERY1-ASNase tolerized mice does not transfer tolerance.
Table S1. Hematology characterization after short-term treatment regimens.
Table S2. T cell characterization after short-term treatment regimens.
Table S3. B cell characterization after short-term treatment regimens.
Table S4. Myeloid cell characterization after short-term treatment regimens.
Table S5. B cell characterization after short-term treatment regimens.
Table S6. Hematology characterization after long-term treatment regimens.