

Advances in ultrathin, skin-like electronics lead to wearable devices for continuous, noninvasive blood flow monitoring.
Keywords: Sensor, blood flow, skin, Flexible electronics, stretchable, circulation, wearable electronics, thermal transport
Abstract
Continuous monitoring of variations in blood flow is vital in assessing the status of microvascular and macrovascular beds for a wide range of clinical and research scenarios. Although a variety of techniques exist, most require complete immobilization of the subject, thereby limiting their utility to hospital or clinical settings. Those that can be rendered in wearable formats suffer from limited accuracy, motion artifacts, and other shortcomings that follow from an inability to achieve intimate, noninvasive mechanical linkage of sensors with the surface of the skin. We introduce an ultrathin, soft, skin-conforming sensor technology that offers advanced capabilities in continuous and precise blood flow mapping. Systematic work establishes a set of experimental procedures and theoretical models for quantitative measurements and guidelines in design and operation. Experimental studies on human subjects, including validation with measurements performed using state-of-the-art clinical techniques, demonstrate sensitive and accurate assessment of both macrovascular and microvascular flow under a range of physiological conditions. Refined operational modes eliminate long-term drifts and reduce power consumption, thereby providing steps toward the use of this technology for continuous monitoring during daily activities.
INTRODUCTION
Measurements of blood flow are a vital and often critical indicator of both vascular and tissue health (1). Vascular endothelial dysfunction may occur as a component or consequence of atherosclerosis (2), diabetes, renal dysfunction, collagen vascular disease, aging, and other pathologies, including those associated with inflammatory states (3). Therefore, considerable interest exists in the development and refinement of tools with capabilities for reliable, noninvasive monitoring of blood flow across various parts of the body under differing conditions (4). In particular, systems that are capable of measuring tissue-associated flow, encompassing all vascular elements (that is, arterial, capillary, and venous components), are needed. Existing techniques may be categorized according to their underlying measurement physics principles including mechanical (plethysmography), optical [photoplethysmography, laser Doppler flowmetry (LDF), and laser speckle contrast imaging (LSCI)], acoustic (ultrasound), and thermal (various forms of thermal clearance). Plethysmography relies on the measurement of bulk changes in limb dimensions caused by changes in blood volume, thereby only providing an estimate of flow to the entire limb. Measurements typically involve strain gauges wrapped around the limb to quantify dimensional changes (5, 6) or, in the case of photoplethysmography, optical illumination to identify changes in optical absorption, both of which follow from changes in blood volume (7). Ultrasound techniques rely on acoustic Doppler shifts (8, 9). Similar Doppler shifts in optical signals form the basis for laser LDF measurements (10–12). Related optical phenomena, where blood flow induces spatiotemporal variations in reflected speckle patterns associated with a coherent light source, form the basis of modern LSCI techniques (13–15).
Acoustic and optical methods are especially useful because of their scalability, in terms of spatiotemporal mapping. Extreme sensitivity to motion, however, demands immobilization of the subject during the measurement, thereby limiting use to controlled, clinical, or laboratory settings. Paste-on, single-point sensors have some potential to reduce the effects of movement but likely not to levels that would allow use during normal body motions. Wearable optical measurement systems are becoming available (16–19), but present hardware involves rigid, bulky device components that are affixed to the skin in ways that can lead to irritation and discomfort after prolonged application, to pressure on the microcirculatory bed that can cause erroneous readings.
Techniques based on thermal transport offer reduced sensitivity to motion. Existing noninvasive approaches exploit metal heating and sensing plates applied to the skin. Here, blood flow in the tissue (20, 21) influences the time and/or spatial dependence of the thermal response, which provides a means to determine spatial variations in effective thermal conductivity (22, 23) and, therefore, regional perfusion. Limitations of previous techniques follow from the use of bulky thermal components and pressure-induced coupling to the skin, resulting in an inability to (i) perform spatial mapping, (ii) track subtle or rapid temporal changes, and (iii) assess natural, unaltered patterns of blood flow. The use of laser heating and infrared mapping of thermal distributions in subsurface vessels (24) avoids these disadvantages but reintroduces high sensitivity to motion.
Here, we present strategies for exploiting electronic devices that adopt physical characteristics of the epidermis to allow precision thermal measurements of blood flow in ways that offer considerable advantages over existing methods. When combined with thermal analysis techniques, these platforms provide routes for quantitative monitoring of both the speed and direction of near-surface blood flow, up to 2 mm in depth, without the aforementioned limitations and constraints associated with contact, movement, and pressure, with potential for continuous use during daily activities. These capabilities follow from ultrathin, flexible, stretchable mechanics of the device components, in which precision thermal detectors intimately conform to the surface of the skin through the action of van der Waals forces alone, without any externally applied pressure. The combination of intimate skin contact and extremely low mass (0.2 to 5 mg cm−2, for 0- to 40-μm silicone support thickness) eliminates relative movement between the skin surface and detectors even during rapid motions of the body (tens of g’s, Supplementary Materials). The low thermal mass (0.2 to 5.7 mJ cm−2 K−1) and high gas permeability [2 g h−1 m−2 for solid silicone support, with options for porous/perforated versions for higher permeability (25)] of these systems minimize perturbation to the natural temperature of skin. Measurements involving human subject volunteers, with quantitative comparisons to state-of-the-art commercial optical blood flow measurement systems, demonstrate the ability to map directional blood flow in large subsurface vessels (e.g., veins), under varied physiological conditions. Quantitative analytical and finite element models provide a systematic framework for converting measured data to blood flow rates. Additional measurements demonstrate capacities for monitoring changes in flow through near-surface microvasculature, that is, arteriolar and capillary bed, induced by deep breathing and slap-mediated hyperemia associated with dermatographic urticaria. An advanced, pulsed operation mode offers potential long-term monitoring via elimination of key sources of drift in the measurement and reduction of the power consumption.
RESULTS
Device design and operational principles
The device incorporates an array of thin (100 nm) metallic thermal actuators and sensors designed for monitoring blood flow beneath a targeted area (~1 cm2 for results presented here) of the skin (Fig. 1A; see the Supplementary Materials for fabrication details). The array includes a single circular thermal actuator (1.5-mm radius composed of a 15-μm-wide filament of 10-nm Cr/100-nm Au) surrounded by two rings of sensors (0.5-mm radius composed of a 10-μm-wide filament of 10-nm Cr/100-nm Au). The first and second rings lie at a 3- and 5-mm center-to-center distance from the central actuator, respectively. Each ring contains seven sensors, spaced at 45° angular increments around the ring (one 45° location is vacant to allow for interconnect wiring). The construction uses narrow, filamentary serpentine traces and thin, low-modulus silicone substrates, following concepts in ultrathin, stretchable electronic sensor design (26–33), to yield a device platform that naturally conforms to the surface of the skin (Fig. 1B) for the type of intimate thermal contact that is critical to the measurements. The sensors rely on temperature-dependent values of their resistance according to previously reported results and offer measurement precision in the range of ~0.01°C with a 2-Hz sampling rate.
Fig. 1. Device design and thermal response to flow.

(A) Schematic illustration of the device layout, including a blood vessel near the skin surface. A large (3-mm diameter) central thermal actuator provides power input into the vessel (typically 25 or 3.5 mW mm−2), at temperatures below the threshold for sensation (<8°C rise above the base skin temperature). Fourteen surrounding sensors allow measurement of the resulting thermal distribution (inset: magnified view of one sensor). An additional sensor serves to detect changes in the background temperature to compensate for drift. An array of bonding pads enables the attachment of a thin (100 μm) flexible cable interface to external data acquisition electronics. (B) Photograph of a device on the skin. (C) An infrared image of a device on the skin over a vein, during application of power to the actuator. (D) Raw data from a device applied to an area above a large vessel. The layout of the graphs corresponds approximately to the spatial distribution of the sensors (black) and actuator (red). The thermal distribution is strongly anisotropic, with bias in the direction of flow. Heating begins at t = 60 s and ends at t = 360 s. (E) Spatial map of the temperature at t = 300 s. The color map uses spatially interpolated data. Black arrows indicate the relative magnitudes of the temperature rise measured by the inner ring of sensors. (F) Same spatial map as that shown in (E), with the signal of the heater removed to enhance the contrast of the data measured by the surrounding sensors. (G) Results of measured thermal flow, calculated from the temperature distribution around the actuator. The vector arrow map shows the calculated convection-driven thermal flow fields. The color map represents the magnitude of the flow field. (H and I) Similar maps as shown in (G), where the color maps represent the magnitude of flow in the (H) x direction (X-comp) and (I) y direction (Y-comp).
Subsurface blood flow leads to anisotropic thermal transport phenomena that can be accurately quantified using this type of system. The central thermal actuator provides a constant source of thermal power to create a mild, well-controlled increase in temperature at the surface of the skin in the vicinity of a targeted vessel (Fig. 1C). Responses of the sensors determine the spatiotemporal distributions of temperature that result from this heating. The actuator dimensions and operating parameters (typically ~3.5 mW mm−2) ensure adequate thermal signals in the surrounding sensors, with peak temperatures (~6°C) that remain below the threshold for sensation. For all cases reported here, the responses linearly depend on power for peak temperatures below ~10°C. [For effects at higher temperatures, see fig. S1 (A and B).] Representative data, in the form of spatially dependent changes in temperature as a function of time, appear in Fig. 1D. Figure 1 (E and F) summarizes color-mapped data interpolations at an instance in time, with and without the actuator signal. The directionality of the local thermal flow can be inferred from differences in the relative increases in temperature at sensors located on opposing sides of the actuator. Such flow field maps indicate relative changes in local flow as well as the directionality components of flow relative to the skin surface (Fig. 1, G to I). Similar data, but with the device placed in a region with no large blood vessels, appear in fig. S2.
Device analysis and modeling
Conversion of the data into quantitative blood flow rates depends on the heterogeneous and time-dependent properties of the tissue. Variables that influence the signals, in addition to blood flow rate and direction, include thermal conductivity (λ), heat capacity (c), and density (ρ) of blood (subscript “f”) and local tissue (subscript “s”); blood vessel depth (h in Fig. 2B); blood vessel radius (R in Fig. 2B); and geometrical parameters of the device (L = 3.5 mm, B = 1.5 mm in Fig. 2A). In general, the thermal properties of blood (λf = 0.5 W m−1 K−1, cf = 3659 J kg−1 K−1, ρf = 1069 kg m−3) are well established (34, 35) and assumed to be known a priori. The tissue properties and blood vessel parameters are unknowns, with values that fall within established physiological ranges (34). Our analysis combines systematic experimental measurement steps, an analytical scaling law, and finite element analysis (FEA). Figure 2 illustrates these steps, along with a representation of the blood vessel under the skin used in modeling [top-down and cross-sectional views of the model system appear in Fig. 2 (A and B, respectively)]. In the first step, a short (2 s) input of power (7 to 8 mW mm−2) is sequentially applied to each sensor in the device (Fig. 2C) as a means to probe the local tissue properties. Analysis of the time dynamics of the temperature rise at each sensor determines the thermal characteristics of the corresponding regions of the skin (thermal diffusivity λs/ρscs = 0.17 mm2 s−1 and thermal conductivity λs = 0.3 W m−1 K−1 for the case in Fig. 2C) following procedures reported elsewhere (36). The results represent important information for the thermal models. The second step involves activating the central thermal actuator while simultaneously recording the temperature of this element and those of the surrounding sensors. Analysis establishes the following transient scaling law, as verified by FEA and in vitro experiments (figs. S3 and S4; see Materials and Methods for details)
| (1) |
where ΔT is the difference between the temperatures of a pair of sensors on opposing sides of the actuator and which lie along the direction of the targeted vessel; ΔTsteady is the final steady-state value of ΔT. Throughout this text, the use of the symbol “Δ” in temperature variables refers to the temperature difference between two sensing elements, whereas temperature variables that lack this symbol refer to the temperature of a single element above a baseline temperature. A venous optical imager (VeinViewer Flex, Christie Medical Holdings Inc.) is useful, during in vivo experiments, for venous mapping of the human forearm (volar aspect, fig. S5) to assist in accurate placement of the device on the vein. The temperature ΔT normalized by its steady-state value ΔTsteady is independent of the radius of the blood vessel R and the blood flow velocity v (figs. S3 and S4), and its dependence on the normalized material properties λs/λf and ρfcf/ρscs and actuator radius B/L on the transient scaling law appears in fig. S6. The only unknown parameter is the depth h. As a result, a comparison of experimental results of ΔT/ΔTsteady versus time, t, to FEA results that use different vessel depths, and the tissue thermal properties measured in the first step, can yield accurate estimates for h. For the case of Fig. 2D, h = 1.25 mm. In the third step, the steady-state temperature difference ΔTsteady between the sensors on opposing sides of the actuator normalized by the temperature at the actuator Tactuator depends on the blood flow velocity along the direction defined by the sensors. Here, the following steady-state scaling law applies, as verified by FEA and in vitro experiments (fig. S7; see Materials and Methods for details)
| (2) |
Fig. 2. Process for quantifying blood flow rates from measured thermal signals.
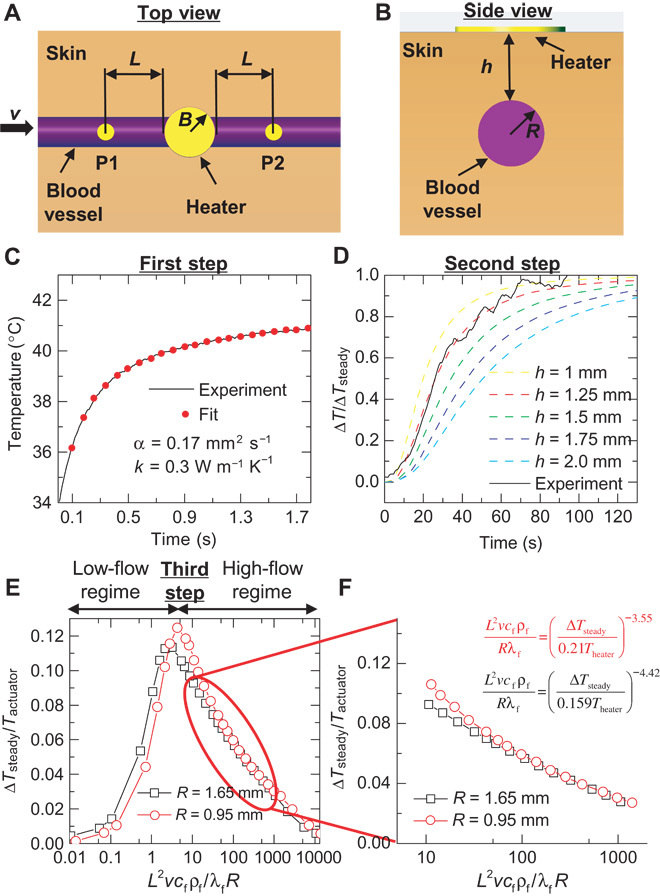
Conversion of thermal signals to blood flow rates relies on models that include a linear vessel of radius R, a distance h beneath the surface of the skin, with a central thermal actuator on the skin surface of radius B, and two sensors, one upstream and one downstream along the vessel, at a distance L (from actuator edge to sensor center). (A and B) Top-down (A) and cross-sectional (B) views of this model system. (C) The first step determines the thermal transport properties of tissue located at each of the sensors and at the actuator. Here, 2 mA of current is applied to each sensor for 2 s. The local thermal conductivity and thermal diffusivity follow from analysis of the thermal transients associated with heating and cooling. (D) The second step approximates the depth of the blood vessel. The experimental initial transient profile of the differential temperature across the thermal actuator is compared to finite element models of the skin to determine the approximate depth of the vessel, using the thermal transport values determined in the first step (C). (E) The third step converts the thermal information to a blood flow velocity, v, using the values determined in the first (C) and second (D) steps. The differential temperature reaches a maximum at low flow velocity. The temperature rise at each sensor determines whether the calculation uses the low- or high-flow regimes. (F) Most physiologically relevant flow rates are expected to fall in the high-flow regime. The radius of the underlying blood vessel, R, has a minor impact on the responses in the high-flow regime, due to their dependence on R/L. The equations represent the numerical fits at R = 0.95 and 1.65 mm of the high-flow regime.
Its dependence on the normalized thermal conductivity λs/λf, depth of blood vessel h/L, and sensor spacing B/L appears in fig. S8. The impact of R is relatively small, such that an approximate value based on the vessel location can be used. As an example, the steady-state scaling law for R = 0.95 and 1.65 mm appears in Fig. 2E. These values of R bound the expected range for the median antebrachial vein segment near the wrist [R = 1.3 ± 0.35 mm (37)], which is used in several experiments subsequently described. The two computed curves have similar shapes but with slightly shifted values. The value of ΔTsteady begins at v = 0 with increasing v (dΔTsteady/dv > 0), peaks at a relatively low flow rate, and then begins to decline (dΔTsteady/dv < 0) as convective cooling of the downstream sensor begins to dominate. We refer to the two sections of the curve as the “low-flow regime,” where dΔTsteady/dv > 0, and the “high-flow regime,” where dΔTsteady/dv < 0 (Fig. 2E). In the high-flow regime (corresponding to most physiologically relevant blood flow velocities, Fig. 2F), R/L has a minor impact on the values of the curve, such that the steady-state scaling law is simplified as
| (3) |
The only unknown in Eq. 3 is the ratio v/R. As a result, a comparison of ΔTsteady/Tactuator from experiments with a numerical fit of the steady-state scaling law obtained by FEA (Fig. 2F shows fits for R = 0.95 mm and R = 1.65 mm) gives the ratio v/R.
The value of ΔTsteady does not, of course, include changes that arise from variations in the blood flow velocity. Experimentally, the sensors respond to an instantaneous change in flow rate with a time constant of ~10 s (fig. S9), depending on the tissue properties. The result is that changes in flow that have frequencies <0.1 Hz can be readily measured. This includes flow changes related to myogenic activity of vascular smooth muscle (0.1 Hz), neurogenic activity of the vessel wall (0.04 Hz), and vascular endothelium influences (0.01 Hz) (38). The dimensionless flow parameter alone allows for assessment of relative changes in blood flow. Analyses of potential sources of noise and other potential sources of uncertainty appear in figs. S10 and S11. The results confirm that the measured values of ΔTsteady/Tactuator used in the analysis are typically more than 10× stronger than experimentally measured electronic and/or environmental noise and more than 5× stronger than signals recorded on skin locations without large vessels. In the following examples, the analysis procedures outlined here provide local values of thermal conductivity and diffusivity, vessel depth, and changes in blood flow.
Measurements of macrovascular flow
Various in vivo experiments demonstrate the utility of these approaches. The first example illustrates the capture of time-varying thermal flow maps that result from changes in blood flow induced by local occlusion of a near-surface vessel (Fig. 3, A to C). Here, the device resides on the volar aspect of the wrist (male, age 27) with the thermal actuator centered above a near-surface vessel. Power applied for 5 min to the actuator establishes a baseline level of heating to reach a steady-state response. The experiment involves application of local occlusive pressure (about 25 kPa over a 0.2-cm2 area), using a cotton-tipped applicator (56810 Solon) with a 15-cm wood shaft, to a series of locations around the outside perimeter of the device. Specifically, pressure is applied first along the vein (second panel in Fig. 3A) for 60 s and then released for 60 s. Sequential application of the same pressure cycle (60 s of pressure, 60 s of no pressure), at locations shifted 45° relative to the thermal actuator until returning to the initial position, completes the experiment. Data show that the device records minimal blood flow when occlusive pressure is directly applied to the vein and strong blood flow at all other times. The flow vector fields (vector maps in Fig. 3C) record the flow direction moving toward the body, as expected for venous flow and confirmed by the VeinViewer (fig. S5). Control experiments (Fig. 3, D to F) conducted on areas of the skin without large vessels indicate negligible effects of applied pressure, as expected. LSCI performed under similar conditions yields inconclusive data due to uncontrolled variations associated with distortions of the skin and associated motion artifacts. The device platform reported here does not suffer from such effects. A movie of the data collected by our device and the LSCI tool captures the results of the entire experiment (movie S1A, with video footage shown in movie S1B).
Fig. 3. Measurements of changes in venous blood flow induced by local applied pressure.
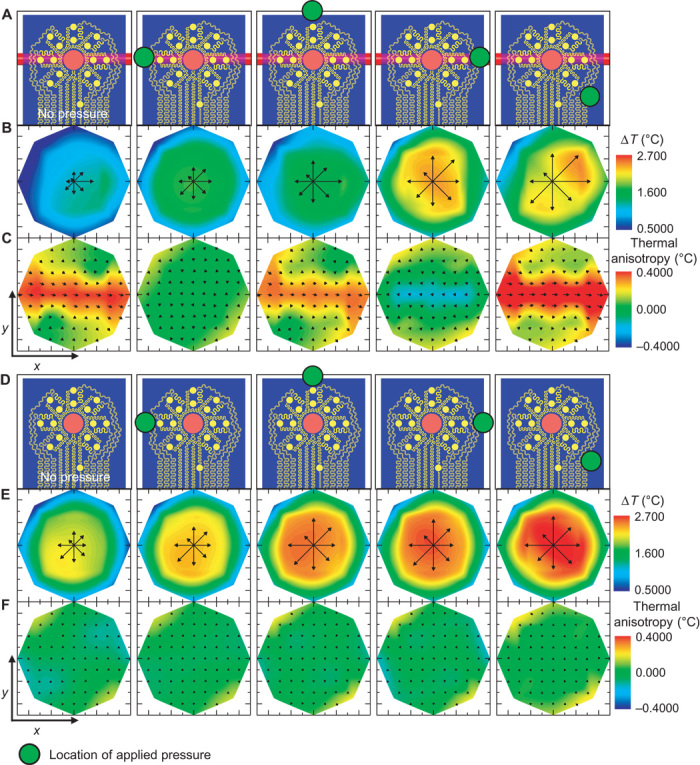
(A) The device resides on the wrist, over a 2-mm-diameter vein with orientation shown in the illustration.  Location of pressure applied (60 s duration) with a cotton swab. (B) The local temperature distribution that follows heating for each pressure location. The temperature of the heater has been removed to improve the contrast. (C) Measured thermal anisotropy fields corresponding to the applied pressure illustration above. Computed color maps correspond to the calculated flow components in the x direction. (D to F) Similar analyses to (A) to (C), except that the device resides over a region of the forearm with no nearby large blood vessels.
The experiment summarized in Fig. 3 represents one of a range of applications that involve abrupt alteration in blood flow by external forces. Another demonstration illustrates the quantitative analysis routine previously outlined. Here, device function during extended periods, without external stimuli, can reveal natural fluctuations in near-surface blood flow (vasomotion). As before, the device resides on the volar aspect of the wrist (male, age 27), with the thermal actuator centered over a visible vein. Measurements continuously proceed as the subject lies still in a dark, quiet room for 45 min. LSCI data are recorded through the transparent regions between the metal traces of the device. Thirty seconds of baseline temperature recording is followed by power application to the thermal actuator at t = 30 s. Power is deactivated at t = 2430 s to allow another set of baseline temperature recording for the final 5 min. The tissue thermal conductivity and diffusivity are 0.32 ± 0.03 W m−1 K−1 and 0.17 ± 0.02 mm2 s−1, respectively, according to the method in Fig. 2C. The vessel depth is 1.3 ± 0.2 mm, according to the method in Fig. 2D. Comparison of the LSCI data with the dimensionless flow calculated from our device indicates good agreement, highlighted by the alignment of peaks and troughs in the flow signal (Fig. 4, A and B; full data video shown in movie S2). Motion artifacts that cannot be completely removed with frame alignment algorithms typically lead to sharp peaks in the LSCI signal. Additionally, we note that neither LSCI nor LDF measurements through the skin provides a direct measurement of blood flow in a subsurface vein, due to the strong influence of signals in the tissue above the vein. However, we find that for near-surface veins on the wrist, the agreement is significant (subsequent experiments, discussed in the following paragraph, illustrate an inability of LSCI to capture signals in deeper veins, which are captured by our device). A comparison of the cross-correlation of the device and LSCI data, compared to the autocorrelation of the LSCI data, as well as the coherence between the two data sets, quantifies the statistical agreement (fig. S12). Frequency-time spectrograms of the data show similar levels of agreement in terms of the alignment of frequency bands in time (Fig. 4, C and D). Related experiments on different subjects and different veins on the wrist and hand yield results that also agree with those of LDF tools (Blood FlowMeter, ADInstruments) (figs. S13 and S14).
Fig. 4. Measurement of small-scale blood flow oscillations over an extended period.
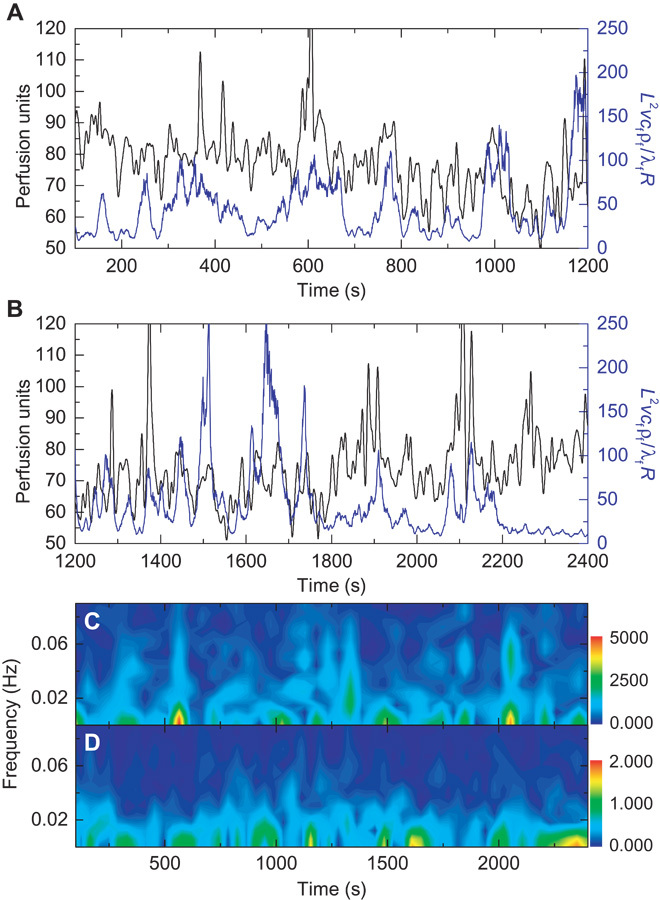
The device resides on the volar aspect of the wrist, over a vein. The subject sits in a reclining chair in a relaxed state with no external stimuli for a 20-min period. (A and B) Changes in blood flow as measured by a laser speckle contrast imager (LSCI perfusion units, black) and our device (dimensionless flow, blue) for (A) t = 100 to 1200 s and (B) t = 1200 to 2400 s. The peaks in the two measurement techniques align well. (C and D) Fourier transform spectrogram for t = 100 to 2400 s determined from (C) LSCI data (FFT length = 128 s, five samples per second; the colorbar is the amplitude of the LSCI spectrogram) and (D) our device (FFT length = 128 s, two samples per second; the colorbar is the amplitude of the thermal anisotropy spectrogram).
Another demonstration involving external forces applied to the entire forearm reveals enhanced variations in the signals, without motion, for comparison to optical tools. Here, we monitor changes in blood flow during a reactive hyperemic response induced by occlusion and reperfusion of the forearm. The device again resides on the volar aspect of the left wrist (male, age 27) with the thermal actuator centered over a subcutaneous surface vein. As before, an LSCI tool simultaneously records data through optically semitransparent regions of the device and around it. The procedure appears in Materials and Methods, and the results appear in Fig. 5 (A to I). We calculate the tissue thermal conductivity and diffusivity to be 0.33 ± 0.03 W m−1 K−1 and 0.17 ± 0.02 mm2 s−1, respectively. The vessel depth is 1.3 ± 0.2 mm. These values are consistent with those for the experiments in Fig. 4, as expected. The LSCI data, taken from above the vein and thermal signals recorded from the device, using the thermal signals on opposing sides of the actuator previously outlined, show good agreement throughout the course of the study (Fig. 5A). This experiment does, however, reveal a limitation of the quantitative analysis routine. At the time of reperfusion, blood flow rapidly transitions from the low-flow to the high-flow regime (fig. S15A), which changes and reverses the slope of the relationship between the thermal signal and blood flow (fig. S15B). As a result, quantitative conversion during this period immediately after reperfusion results in a spurious depression in calculated flow (fig. S15B). This particular set of circumstances is, however, unlikely to occur without rapid changes in flow due to external perturbation. A comparison of the cross-correlation of our thermal device data with the LSCI data, compared to the autocorrelation of the LSCI data, as well as the coherence between data sets, shows excellent statistical consistency (fig. S16). The frequency-time spectrograms of the data in Fig. 5A exhibit similar levels of agreement, including the same step function artifacts (due to the step function in flow data input into the spectrogram) at the time of reperfusion (Fig. 5, B and C). Data from our device, at snapshots in time during peak flow (Fig. 5, D to F) and occluded flow (Fig. 5, G to I), demonstrate the strength and disappearance of the flow signal corresponding to unoccluded and occluded flow, respectively. A movie of data collection with both our device and the LSCI tool captures the results of the entire experiment (movie S3). An additional experiment, following the same procedure as that described for Fig. 5A, but on a different subject (male, age 23) with apparently deeper veins (1.7 ± 0.3 mm, fig. S17), appears in Fig. 5J. Here, our device captures an extraordinary signal from the vein during occlusion (confirmed by infrared) that is almost entirely absent from the LSCI signal. A series of four strong pulses of flow occur during occlusion (400 s < t < 600 s, possibly due to insufficient occlusion or shunting via collaterals), as reflected by four prominent peaks in the signal (Fig. 5J). Close examination of simultaneously recorded infrared signals reveals four strong pulsations of the vein during the occlusion period. Individual frames illustrate pulsation (Fig. 5, K to M), and a video of the infrared recording more clearly reveals the effect (movie S4).
Fig. 5. Measurement of changes in local venous blood flow induced by occlusion and reperfusion of the forearm.

The device resides on the volar surface of the wrist, over a vein. Occlusion and reperfusion induce changes in blood flow. Occlusion with a pressure of ~200 mmHg (80 mmHg above systolic pressure) applied to the bicep begins at t = 300 s. Pressure is released at t = 600 s. (A) Changes in blood flow as measured by a laser speckle contrast imager (LSCI, black) and our device (blue). (B and C) Fourier transform spectrogram determined from (B) LSCI data (FFT length = 128 s, five samples per second; the colorbar is the amplitude of the LSCI spectrogram) and (C) our device (FFT length = 128 s, two samples per second; the colorbar is the amplitude of the thermal anisotropy spectrogram). (D) Illustration of the position of the vein relative to the device. The red arrows show the relative magnitudes of the thermal distribution at peak flow. (E and F) Full thermal distribution map (E) and flow field map (F) during peak flow as measured by our device. (G to I) Similar analyses as (D) to (F), except during occluded flow. (J) A similar experiment as in (A) but on a different subject with apparently deeper veins. Several strong pulsations of flow pulsations appear during occlusion, as measured with our device, but are entirely absent from the LSCI signal. (K to M) Infrared images confirm the result from our device, with examples shown at (K) a pulse trough, (L) a pulse peak (arrow indicates the appearance of downstream heating), and (M) reperfusion. (K) to (M) are uniformly contrast-enhanced to aid visualization. Time points of (K) to (M) are indicated in (J). Movie S3 shows the entire video result, which more clearly shows the changes.
Subjects were immobilized in all experiments presented thus far to allow experimental compatibility with optical tools that provide local blood flow measurements. This condition allows us to assess correlations between thermal data from our device and provides estimates of local flow from optical tools. Subject motion prohibits correlation to actual local flow conditions due to lack of compatibility with the optical measurement tool. Motion experiments can, however, reveal the lack of motion artifacts in our device, even though we cannot make claims about correlation to actual flow without comparison to an established tool for local flow measurements. Additional data from our device, obtained during periods of motion (a Master’s step test), appear in fig. S18 and show no noticeable motion artifacts.
Measurement of microvascular flow
Applications to measurements of changes in microvascular flow, as opposed to the macrovascular applications discussed above, represent related but different areas of interest. For these studies, microvascular is defined as those vessels (that is, arterioles, capillaries, and venules) with diameters typically <200 μm (39, 40). The microvasculature may or may not have a significant anisotropic effect on thermal transport in the plane parallel to the skin surface (same plane as our device) because ~80% of human skin capillaries travel perpendicular to the skin surface. Experiments using our device indicate that the net anisotropy in the parallel plane is relatively small in regions that lack local large vessels. A device design with sensor sizes and density modified for arteriole scales, using the same principles outlined previously, may potentially monitor more localized individual arteriole anisotropies. More generally, the extent of microvascular anisotropy may be dependent on both region and size scale, ultimately determined by the net lateral flow across the area of the device. Here, we focus on changes in the millimeter-scale isotropic transport between the actuator and surrounding sensors. In one demonstration, local trauma—in the form of a “finger slap”—to the volar surface of the forearm (male, age 59) was used to induce dermatographic urticaria, resulting in vasodilation of the local microvasculature and tissue hyperemia (Fig. 6, A and E). A 500 to 700% increase in measured LDF perfusion units following the finger slap (fig. S19), measured within the slap area and 2 cm away from the thermal actuator, confirms the hyperemic effect. Local precision temperature measurements of the skin surface, using our device, before and after trauma (Fig. 6, B and F) reveal expected increases in temperature that result from local vasodilation. Isotropic flow will not induce any appreciable differential temperatures. As a result, the previous discussions on blood flow analysis for large vessels do not apply. Instead, changes in microvascular perfusion alter the rate of heat extraction from the actuator into the skin. This effect can be readily observed in the initial time dynamics and saturation temperature of the actuator under constant applied power. Measurements before and after the onset of vasodilation (Fig. 6, C and G) illustrate the effect. After vasodilation, the actuator reaches a lower saturation temperature increase, above the baseline skin temperature, more rapidly, compared to moments before dilation, quantified as a 130 to 250% increase in measured thermal diffusivity and a 6 to 19% increase in measured thermal conductivity. The saturation temperature increase of the actuator decreases with vasodilation, even though the base temperature of the skin increases, due to the increase in convective heat transfer extracting thermal energy from the actuator. Isotropic heat distributions both before and after vasodilation illustrate the distinct difference between the macrovascular and microvascular effects (Fig. 6, D and H).
Fig. 6. Analysis of changes in local microcirculation induced by dermatographic urticaria and deep breathing.
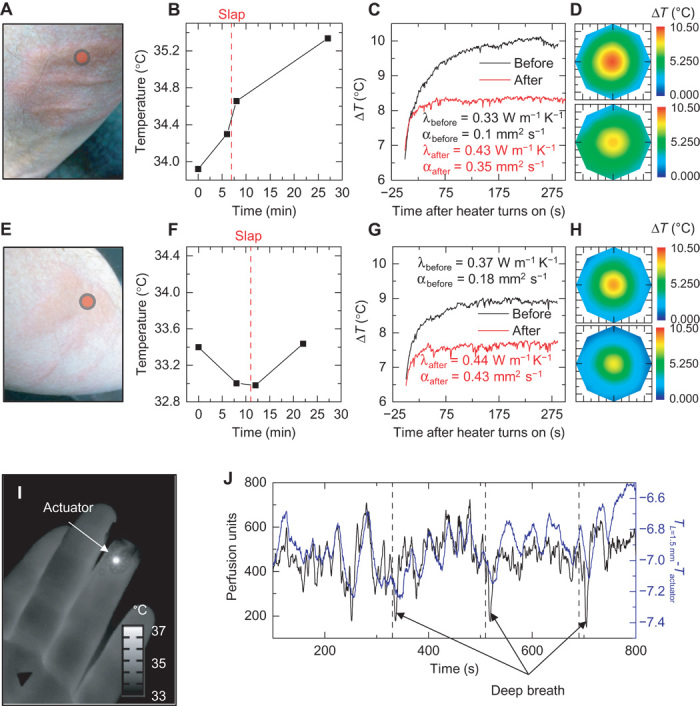
(A) Photograph of slap-induced hyperemia and dermatographic urticaria on the forearm.  Location of the thermal actuator during measurement. (B) Temperature of the region of interest, measured by our device, before and after the onset of dermatographic urticaria. The vertical red dashed line indicates the time the slap was administered. (C) Temperature profile of the central heating element, with background temperature changes removed, before and after onset of dermatographic urticaria. A change in the time dynamics of heating indicates changes in the local heat transfer coefficient. Analysis of the time dynamics allows for calculation of the local thermal conductivity, λ, and thermal diffusivity, α, before and after the onset of dermatographic urticaria. (D) Heat distribution, as measured by our device 280 s after heating, before (top) and after (bottom) the onset of dermatographic urticaria. Even though the local tissue increases in temperature, the temperature rise of the thermal actuator is lower after trauma because of the increase in local heat transfer. (E to H) Similar analyses as shown in (A) to (D) on a different day and body location. (I) Infrared image of the device applied to the fingertip to monitor local changes in microcirculation. (J) Results from LSCI (black) and our device (blue; difference between actuator temperature and the average temperature of the inner ring of sensors). Periodic deep breathing (45-s breath holds) induces rapid dips in blood perfusion, measured by both LSCI and our device.
A separate experiment, with the device located on the fingertip (infrared image, Fig. 6I; data, Fig. 6J), illustrates continuous measurements of natural changes in microcirculation. Analysis of the temperature difference between the actuator and the inner ring of sensors (averaged) provides a measure of time dynamic changes in the heat transfer coefficient, as a result of changes in blood flow. In this case, several deep breaths can induce variations in peripheral circulation [downward spikes in Fig. 6J consistent with literature (41–43)], and all variations, whether a result of deep breathing or otherwise, appear to be captured by the device. Cross-correlation and coherence data show the excellent level of agreement between measurements using LSCI and our device (fig. S20).
Pulsed operation modes
Environmentally induced drifts in the device response and inefficiencies in power consumption represent important considerations for long-term continuous monitoring. A pulsed thermal actuation mode represents one simple strategy to address these issues. The ability to operate the actuator at a reduced duty cycle results in a reduction in power consumption. The benefits to long-term drift are more subtle. In a continuous operation mode, information related to blood flow is extracted from the temperature differential of sensors on opposing sides of the actuator. For each sensor, the relevant temperature is not the absolute value but the change relative to the baseline established after application of power to the actuator. In long-term measurements, local heterogeneous changes in skin temperature may occur for reasons unrelated to the anisotropic convective effects induced by the blood vessel. For example, a local, environmentally induced temperature change at the location of one, but not the opposing, sensor will affect the measurement of blood flow. A pulsed actuation mode effectively removes this type of drift error by continuously adjusting the effective baseline for each temperature differential. Figure 7 illustrates the use of a pulsed actuation mode in a hyperemic response experiment, similar to the one described in Fig. 5. LSCI data from the experiment, measured through the transparent regions of the device as previously done, show the periods of base flow, occlusion, and reperfusion (Fig. 7B). The temperature of the thermal actuator (Fig. 7C), pulsing at a frequency of 0.067 Hz with a 33% duty cycle, illustrates the rapid rates of heating enabled by the ultrathin device design and its low thermal mass. The pulsing frequency is not limited by the actuator but instead by the rate at which heat can transfer through the skin from the actuator to the sensors. The temperature differential of a pair of sensors on opposing sides of the actuator and along the vein (Fig. 7D) reveals a signal at 0.067 Hz that is strong during the periods of flow (due to the anisotropy induced by flow) and weak during occlusion (due to the loss of anisotropy). Frequency and power applied to the heater remain fixed, such that changes in the differential signal cannot arise from changes in the heating. The frequency-time spectrogram (Fig. 7E) of the signal in Fig. 7D and the extracted amplitude at 0.067 Hz (Fig. 7F) illustrate the changes during occlusion. One disadvantage of pulsed actuation is that the time resolution of the extracted blood flow signal is lower than that possible in the continuous operation mode. This limitation follows from the fact that each pulse must be sufficiently long to induce a measurable temperature change in the surrounding sensors, which reduces the effective maximum sampling rate to a value comparable to the pulse rate. Reducing the duration of the pulses leads to decreased signal amplitudes and corresponding reductions in measurement precision but with improved time resolution. In practice, pulse frequencies of 0.05 to 0.1 Hz generate reasonable signals at thermal actuation levels that remain below the threshold for sensation. A 33% duty cycle provides sufficient time between pulses for the actuator to return to the baseline temperature of the skin. A control experiment, in which application of local heating near individual sensors with a hot iron tip (~10°C errors are induced in the sensor readings by proximity of the 65°C iron tip) induces variability, for both the continuous actuation and pulsed actuation modes, results in an average of five times reduction in error in measured flow for the pulsed mode compared to the continuous mode (fig. S21).
Fig. 7. Pulsed heating as an operation mode that reduces environmental effects and power consumption.
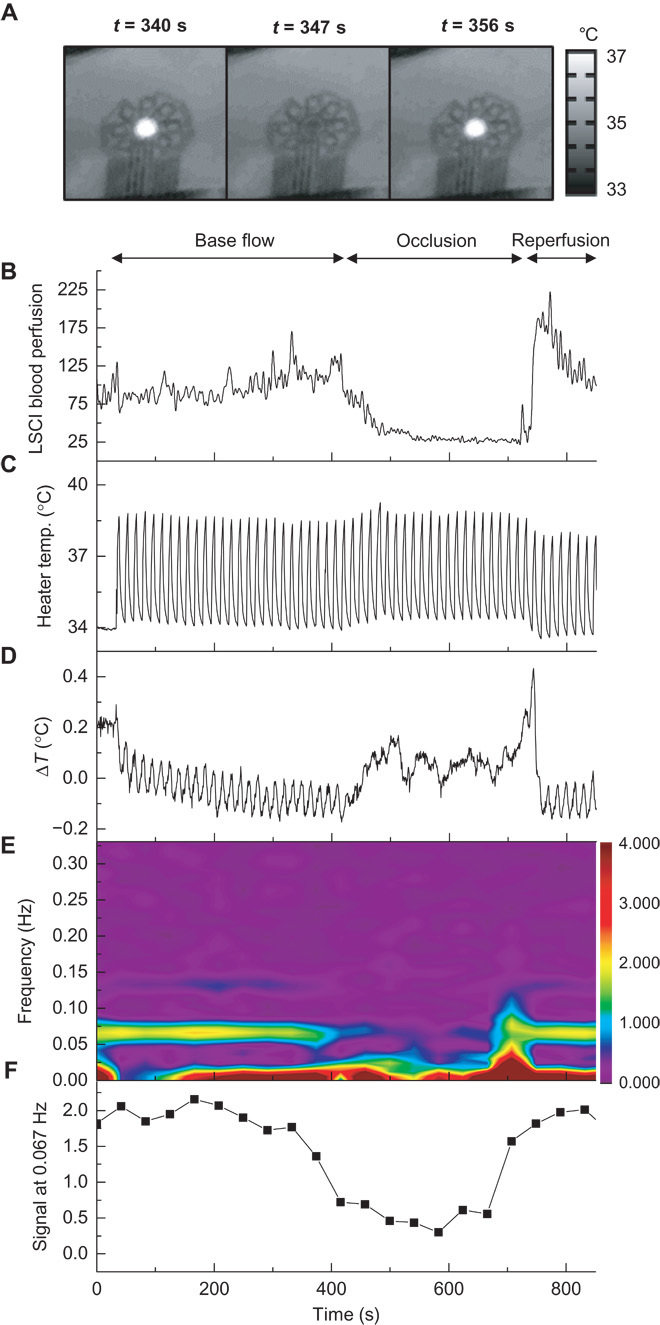
The device resides on the volar aspect of the wrist, over a vein, during a reactive hyperemia protocol. Occlusion with a pressure cuff at the bicep, at 200 mmHg, begins at t = 400 s and ends at t = 700 s. The thermal actuator operates in a pulsed mode, as opposed to the continuous mode shown in prior figures. (A) Infrared images of pulsed heating during one cycle. (B) LSCI signal measured at a point above the vein, subject to a 0.2-Hz low-pass filter. (C) Temperature of the thermal actuator, which continuously oscillates throughout the experiment as a square wave with a 33% duty cycle, a frequency of 0.067 Hz, a 1-mA offset, and a 2-mA peak-to-peak amplitude. (D) The differential temperature measured by sensors on opposing sides of the actuator, along the vein, with L = 1.5 mm. (E) Fourier transform spectrogram of (C). The signal at 0.067 Hz is strong before and after occlusion and diminishes during occlusion owing to loss of anisotropy with loss of venous blood flow. (F) Relative amplitude of the signal at 0.067 Hz, extracted from (D). Frequency locked analysis allows for removal of drift in exchange for decreased time resolution.
DISCUSSION
The devices presented here provide a route to wearable, continuous, noninvasive measurements of local blood flow of the macrovasculature and microvasculature of the skin. These capabilities follow from materials and designs that eliminate relative motion between the actuator/detectors and blood, minimize effects of thermal loading on the skin, and avoid any external application of pressure during wear and measurement. Comparisons to established commercial optical tools, in immobilized settings, validate the accuracy of the measurement. The flow sensitivity of the device to specific vessels is dependent on numerous parameters, such as vessel depth and radius, flow rate regime, and surrounding tissue composition, and can be modified with changes to the device geometry. With these potential variations in mind and on the basis of our experimental and FEA results, we find general guidelines of macrovascular detection limits to be flow in vessels as deep as 2 mm (sensitivity increases with decreasing depth), flow rates of 0.1 to 100 mm s−1 (ΔT at least three times the SD of sensor noise, keeping in mind that the extent and direction of thermal change per unit flow change depend on the flow rate), and a vessel radius down to 0.25 mm (sensitivity increases with increasing radius). The sensitivity to microvascular flows is highly dependent on skin location, although our results indicate a sensitivity near (~50%) that of the LSCI on the fingertip, and our device does not require the immobilization needed for LSCI. Changes to the device geometry would result in changes in these sensitivity ranges, allowing for device designs tailored to specific anatomy.
This class of devices is amenable to low-cost, high-volume production using established microfabrication procedures, thereby suggesting a potential for widespread use, both in the clinic and in the home setting. Applications of interest include monitoring of near-surface blood flow as indicators of vascular health, particularly in diseases with vascular-associated pathologies, as either primary or secondary components (that is, atherosclerosis, sickle cell anemia, diabetes, chronic kidney disease, and vasculitides), and more broadly as a tool for clinical research. This technology also has utility for the continuous monitoring of local microcirculatory changes due to inflammation induced by trauma, environmental exposure [for example, sunburn and chilblains (pernio)], and phenomena that involve local blood flow stasis, insufficiency, retrograde flow, and vasodilation or vasoconstriction, as well as for the long-term monitoring of chronic conditions that result in alterations of peripheral blood flow and tissue perfusion. Further, the flexible, stretchable format of this type of device also lends itself to straightforward use on internal organs, as an integrated element with implantable devices, in vivo diagnostics, surgical tools, or other therapeutics.
MATERIALS AND METHODS
Study design
This study was designed to test the feasibility of measuring blood flow signals through the skin, in a wearable noninvasive manner, with concepts that build on recent technology advancements in stretchable, flexible electronics. As such, the experiments were selected to show proof of concept with several varied applications. Specific experimental procedures, detailed below, were designed after the development of the technology platform to show the concepts and operational features of the device. No data points were excluded from device blood flow readings. All subjects were healthy volunteers. Human subjects were enrolled on a National Institutes of Health research protocol approved by the Institutional Review Board of the National Heart, Lung and Blood Institute (clinicaltrials.gov identifier NCT01441141) and specific university-approved (University of Arizona) protocols for volunteers. Subjects provided written informed consent after the nature and possible consequences of the study were explained.
Statistical analysis
All graphs that display data over time (for our device and for LSCI) were subjected to a 5-s adjacent averaging smoothing filter to improve the display of data. Where specific values of thermal conductivity and diffusivity are reported, they correspond to the mean ± SD of 12 individual sensor element measurements, where the two lowest and two highest values (from the array of 16 sensors) were systematically excluded to account for potential local errors due to body hair. The spatial color maps of temperature and flow fields are determined by a cubic interpolation of experimental data (MATLAB, MathWorks). Statistical correlation graphs are enabled by a numerical time synchronization between epidermal device and LSCI data (MATLAB).
Fabrication of the epidermal device
Detailed fabrication steps appear in the Supplementary Materials. Fabrication begins with a 3-inch Si wafer coated with a 600-nm layer of poly(methyl methacrylate), followed by 1.5 μm of polyimide. Photolithographic patterning of a bilayer of Cr (6 nm)/Au (100 nm) deposited by electron beam evaporation defines the sensing/heating elements. A second multilayer of Ti (10 nm)/Cu (550 nm)/Ti (20 nm)/Au (25 nm), lithographically patterned, forms the connections to sensing/heating elements and nonoxidizing bonding locations for external electrical connection. A second layer of polyimide (1.5 μm) places the sensing/heating elements in the neutral mechanical plane and provides electrical insulation and mechanical strain isolation. Reactive ion etching of the polyimide defines the mesh layout of the array and exposes the bonding locations. Water-soluble tape (3M) enables removal of the mesh structure from the Si wafer, to expose its back surface for deposition of Ti (3 nm)/SiO2 (30 nm) by electron beam evaporation. Transfer to a thin silicone layer (5 μm; Ecoflex, Smooth-On) spin-cast onto a glass slide, surface treated to reduce adhesion of the silicone, results in the formation of strong bonds due to condensation reactions between exposed hydroxyl groups on SiO2 and silicone. Immersion in warm water allows removal of the tape. A thin (100 μm), flexible, conductive cable bonded with heat and pressure to contacting pads at the periphery serves as a connection to external electronics. A final layer of silicone (~40 μm) in combination with a frame of medical tape (3M) provides sufficient mechanical support to allow repeated (hundreds of times) use of a single device.
Data acquisition for the epidermal device
Data acquisition occurs via a custom-built system of universal serial bus (USB) interface control electronics (fig. S22A) integrated into a suitcase for mobility. The full system consists of one precision dc current source (6220, Keithley Instruments), two 22-bit USB-powered digital multimeters (DMMs; USB-4065, National Instruments), and two voltage isolation mechanical relay switching matrices (U802, Ledgestone Technologies). The wiring diagram appears in fig. S22B, where S10 is the central thermal actuator and S1 to S9 and S11 to S16 are the surrounding sensors. The surrounding sensor network shares a common ground path, whereas the thermal actuator (S10) is independently wired. The relays are controlled by a microcontroller that is integrated into the U802 platform. This setup allows for three general modes of operation: (i) To map temperature, the resistance of each sensor element can be sequentially sampled by DMM1, via opening and closing of relevant relays. In this case, DMM1 provides a dc probe current of 0.1 mA and records the resistance. The relays are controlled so that DMM2 takes one resistance recording on one sensor and then switches to the next sensors for one recording, and so on, through the entire array. A DMM aperture time of 0.015 s and a settling time of 0.001 s result in ~2 Hz sampling rate, per sensor, with a resolution of ~0.01 K. (ii) To rapidly sample the local thermal conductivity and thermal diffusivity of each sensor, as described in Fig. 2C, each sensor is sequentially supplied with 2 mA of current from the Keithley 6220, for 2 s each. The voltage from the Keithley 6220 is recorded by DMM2, which allows for calculation of the resistance change over time during actuation. The relay setup allows for isolation from the DMM1 circuit and sequential actuation of each element. An aperture time of 0.005 s and a settling time of 0.005 s provide an adequate sampling rate (100 Hz) for analysis. (iii) To map thermal transport over time, as done for blood flow measurements, the thermal actuator receives a continuous current input (2 mA) from the Keithley 6220. Simultaneously, the sensor resistances are sampled by DMM1, in the same fashion described for mode (i), but this time without sampling S10 (the central actuator). The actuator voltage is read by DMM2. The relay circuit allows isolation of the S10-Keithley-DMM2 circuit from the sensor array-DMM1 circuit.
Mathematical modeling
The conservation of energy for the model system in Fig. 2 (A and B) is
| (4) |
where λ = λf, ρ = ρf, and c = cf for the fluid (blood), and λ = λs, ρ = ρs, and c = cs for the solid (tissue). This equation is numerically solved with FEA. The dimensional analysis, together with the boundary conditions, gives the dependence of normalized temperature on the blood flow velocity v, radius R, and depth h of the blood vessel, as well as other geometric and material parameters, that is
| (5) |
Its steady-state value is the limit of time t approaching infinity, which leads to Eq. 2. Figures S3 and S4 show that ΔT/ΔTsteady is approximately independent for vessel radius R and flow velocity v in their physiological ranges, which then lead to Eq. 1.
Macrovascular flow tests
Local venous occlusion with a cotton swab (Fig. 3)
Figure 3 (A to C): A volunteer (male, age 27) reclined in a chair with his left forearm placed on an armrest. The epidermal device was placed on the volar aspect of the wrist, with the thermal actuator centered over a near-surface vein, as identified by visual inspection (location indicated in fig. S5). The infrared camera and laser speckle contrast imager were both positioned 31 cm from the epidermal device. The subject was instructed to relax, and device measurements began at t = 0. At t = 30 s, continuous application of 2-mA current to the thermal actuator began. At t = 330 s, gentle pressure was applied to the skin (above the vein, 1 cm distal to the epidermal thermal actuator; location shown in the second panel of Fig. 3A) using a cotton swab held in the hand by an investigator. At t = 390 s, pressure was released. At t = 450 s, pressure was applied in the same way 1 cm from the actuator, but now at a location rotated 45° clockwise relative to the actuator. Pressure was released at t = 510 s. This process of 60 s of pressure and 60 s of no pressure was repeated a total of eight times, with each location rotated 45° clockwise relative to the previous location. One location, 270° relative to the first location, was skipped, and the final location was the same as the first location. Thermal actuator ended at t = 1290 s.
Figure 3 (D to F): The control experiment occurred in the same fashion but with the device placed on an area of the volar forearm with no prominent visible veins (location indicated in fig. S5).
Extended test of natural oscillations (Fig. 4)
A volunteer (male, age 27) reclined in a chair with his left forearm placed on an armrest. The epidermal device, infrared camera, and laser speckle contrast imager were positioned in the same fashion as for the previous local venous occlusion with a cotton swab. At t = 0, room lighting was turned off and the subject was instructed to relax. At t = 30 s, continuous application of 2-mA current to the thermal actuator began. Thermal actuation ended at t = 2430 s.
Reactive hyperemia test (Figs. 5 and 7)
Figure 5 (A to I): A volunteer (male, age 27) reclined in a chair with his left forearm placed on an armrest. The epidermal device, infrared camera, and laser speckle contrast imager were positioned in the same fashion as for the previous local venous occlusion with a cotton swab. A pressure cuff was applied to the left bicep region. At t = 0, room lighting was turned off and the subject was instructed to relax. At t = 30 s, continuous application of 2-mA current to the thermal actuator began. At t = 330 s, 200 mmHg of pressure was applied to the pressure cuff. The pressure was released from the cuff, beginning at t = 630 s, at a release rate of 4 mmHg/s. Recordings continued until t = 1200 s.
Figure 5 (J to M): Same experiment with a different volunteer (male, age 23). The epidermal device was placed at a skin location identified as being over a vein on the volar forearm by an optical vein imager (VeinViewer Flex, Christie Medical Holdings Inc.).
Figure 7: Same volunteer and procedure as that done in Fig. 5 (A to I), except that occlusion began at t = 400 s, occlusion ended at t = 700 s, and recordings ended at t = 900 s. The actuator was pulsed with 2 mA of current at 0.067 Hz with a 33% duty cycle.
Microvascular flow tests
Slap-induced dermatographic urticaria and associated hyperemia (Fig. 6, A to H)
A volunteer (male, age 59) sat in a chair with his left forearm resting on a table. The epidermal device was placed on an area of the volar aspect of the forearm without any local, visually prominent veins. At t = 0, temperature measurements began with the epidermal device. At t = 30 s, continuous application of 2-mA current to the thermal actuator began. Thermal actuation ended at t = 330 s. Temperature recordings continued until t = 510 s. After the first set of recordings, the volunteer used his right hand to apply trauma, in the form of a single, rapid finger slap to the measurement location on his left forearm. The device was applied to the same location, about 120 s after the slap, and the same epidermal device measurement procedure was conducted again.
Microcirculation on the fingertip (Fig. 6, I and J)
A volunteer (male, age 27) reclined in a chair with his left forearm placed in an armrest. The epidermal device was placed on the volar aspect of the most distal digit of the middle finger on the left hand. The infrared camera and laser speckle contrast imager were placed 31 cm from the fingertip. At t = 0, room lighting was turned off and the subject was instructed to relax. At t = 30 s, continuous application of 2-mA current to the thermal actuator began. At t = 330 s, the subject was instructed to deeply inhale. At t = 375 s, the subject was instructed to exhale and then normally breathe. At t = 510 s and t = 690 s, the subject was again instructed to inhale and hold his breath for 45 s. Recordings continued until t = 800 s.
Acknowledgments
We thank D. Kang, Z. Yang, and A. Koh for their assistance in device testing. Device fabrication and development was carried out in part at the Frederick Seitz Materials Research Laboratory Central Research Facilities, University of Illinois. We also thank R. Siciliano and D. Lichy for assistance in conducting this study. Funding: R.C.W. acknowledges support from the NSF under grant no. DGE-1144245. Y.M. and X.F. acknowledge support from the National Basic Research Program of China (grant no. 2015CB351900) and National Natural Science Foundation of China (grant nos. 11402135 and 11320101001). This research was supported by the Intramural Research Programs of the National Heart, Lung, and Blood Institute (1 ZIA HL006012 04) and the National Institute of Biomedical Imaging and Bioengineering, NIH. The NIH, its employees, and officers do not recommend or endorse any company, product, or service. Author contributions: Conception, design, and study direction: R.C.W., Y.M., S.K., M.J.S., A.M.G., Y.H., and J.A.R. Device fabrication: R.C.W., S.K., N.H.C., J. Kurniawan, W.H., J. Ayers, and A.G. Experimental validation: R.C.W., S.K., S.Y., M.S., J. Ahad, N.S., T.D., J. Kim, K.C., J.G.T., R.M.P., M.J.S., A.M.G., and J.A.R. Data analysis: R.C.W., Y.M., Y.H., and J.A.R. Theoretical modeling: Y.M., Y.L., X.G., X.F., Y.S., and Y.H. Manuscript writing: R.C.W., Y.M., J.G.T., M.J.S., A.M.G., Y.H., and J.A.R. Competing interests: The authors declare that they have no competing interests. Data and materials availability: All data needed to evaluate the conclusions in the paper are present in the paper and Supplementary Materials. Any additional data sets, analysis details, and material recipes are available upon request.
SUPPLEMENTARY MATERIALS
Supplementary material for this article is available at http://advances.sciencemag.org/cgi/content/full/1/9/e1500701/DC1
Methods: Device fabrication
Materials: Peel strength and adhesion
Fig. S1. Analysis of thermal actuator power levels.
Fig. S2. Epidermal device data output for skin locations with isotropic thermal transport.
Fig. S3. FEA verification for the transient scaling law.
Fig. S4. Comparison between FEA and polydimethylsiloxane experiments.
Fig. S5. Optical VeinViewer image used to accurately identify blood vessel locations.
Fig. S6. The influence of variation of λs/λf, ρfcf/ρscs, and B/L on the transient scaling law.
Fig. S7. Verification for the steady-state scaling law by FEA and experiments.
Fig. S8. The influence of variation of λs/λf, h/L, and B/L on the steady-state scaling law.
Fig. S9. Transient temperature response caused by flow speed change.
Fig. S10. Noise analysis of epidermal data acquisition system.
Fig. S11. Noise analysis of epidermal devices on skin.
Fig. S12. Statistical correlation between LSCI data and epidermal device data from Fig. 4.
Fig. S13. Comparison between LDF signal and epidermal device signal during 10 min of natural flow on the volar aspect of the wrist of a male, age 33.
Fig. S14. Comparison between LDF signal and epidermal device signal during 10 min of natural flow on the dorsal aspect of the hand of a male, age 23.
Fig. S15. Quantitative blood flow conversion of Fig. 5A.
Fig. S16. Statistical correlation between LSCI data and epidermal device data from Fig. 5A.
Fig. S17. Assessment of depth of vein associated with Fig. 5J.
Fig. S18. Device thermal signals during motion.
Fig. S19. LDF measurements before and after slap-induced microvascular hyperemia.
Fig. S20. Statistical correlation between LSCI data and epidermal device data from Fig. 7.
Fig. S21. Comparison of errors induced in the device response for continuous mode and pulsed mode actuation in a control experiment.
Fig. S22. Epidermal device wiring diagram and hardware setup.
Movie S1A. Movie of device signals over time for experiments presented in Fig. 3 (A to C).
Movie S1B. Infrared movie showing the sequential pressure applications for experiments presented in Fig. 3 (A to C) and movie S1A.
Movie S2. Movie of device signals over time for experiments presented in Fig. 4 (A to D).
Movie S3. Movie of device signals over time for experiments presented in Fig. 5 (A to I).
Movie S4. Infrared movie of thermal distribution over time due to device heating for experiments presented in Fig. 5 (J to M). An arrow in the infrared movie shows the location of the pulses, which appear during the period of 460 s < t < 620 s. Text indicators are also displayed during the movie to coincide with each pulse.
REFERENCES AND NOTES
- 1.Shpilfoygel S. D., Close R. A., Valentino D. J., Duckwiler G. R., X-ray videodensitometric methods for blood flow and velocity measurement: A critical review of literature. Med. Phys. 27, 2008–2023 (2000). [DOI] [PubMed] [Google Scholar]
- 2.Flammer A. J., Anderson T., Celermajer D. S., Creager M. A., Deanfield J., Ganz P., Hamburg N. M., Lüscher T. F., Shechter M., Taddei S., Vita J. A., Lerman A., The assessment of endothelial function: From research into clinical practice. Circulation 126, 753–767 (2012). [DOI] [PMC free article] [PubMed] [Google Scholar]
- 3.Petrofsky J. S., Resting blood flow in the skin: Does it exist, and what is the influence of temperature, aging, and diabetes? J. Diabetes Sci. Technol. 6, 674–685 (2012). [DOI] [PMC free article] [PubMed] [Google Scholar]
- 4.Wright C. I., Kroner C. I., Draijer R., Non-invasive methods and stimuli for evaluating the skin’s microcirculation. J. Pharmacol. Toxicol. Methods 54, 1–25 (2006). [DOI] [PubMed] [Google Scholar]
- 5.Petrie J. R., Ueda S., Morris A. D., Murray L. S., Elliott H. L., Connell J. M. C., How reproducible is bilateral forearm plethysmography? Br. J. Clin. Pharmacol. 45, 131–139 (1998). [DOI] [PMC free article] [PubMed] [Google Scholar]
- 6.Wilkinson I. B., Webb D. J., Venous occlusion plethysmography in cardiovascular research: Methodology and clinical applications. Br. J. Clin. Pharmacol. 52, 631–646 (2001). [DOI] [PMC free article] [PubMed] [Google Scholar]
- 7.Allen J., Photoplethysmography and its application in clinical physiological measurement. Physiol. Meas. 28, R1–R39 (2007). [DOI] [PubMed] [Google Scholar]
- 8.Lindner J. R., Microbubbles in medical imaging: Current applications and future directions. Nat. Rev. Drug Discov. 3, 527–532 (2004). [DOI] [PubMed] [Google Scholar]
- 9.Schrope B. A., Newhouse V. L., Second harmonic ultrasonic blood perfusion measurement. Ultrasound Med. Biol. 19, 567–579 (1993). [DOI] [PubMed] [Google Scholar]
- 10.Nilsson G. E., Tenland T., Oberg P. A., Evaluation of a laser Doppler flowmeter for measurement of tissue blood flow. IEEE Trans. Biomed. Eng. 27, 597–604 (1980). [DOI] [PubMed] [Google Scholar]
- 11.Oberg P. A., Laser-Doppler flowmetry. Crit. Rev. Biomed. Eng. 18, 125–163 (1990). [PubMed] [Google Scholar]
- 12.Wårdell K., Jakobsson A., Nilsson G. E., Laser Doppler perfusion imaging by dynamic light scattering. IEEE Trans. Biomed. Eng. 40, 309–316 (1993). [DOI] [PubMed] [Google Scholar]
- 13.Boas D. A., Dunn A. K., Laser speckle contrast imaging in biomedical optics. J. Biomed. Opt. 15, 011109 (2010). [DOI] [PMC free article] [PubMed] [Google Scholar]
- 14.Dunn A. K., Bolay H., Moskowitz M. A., Boas D. A., Dynamic imaging of cerebral blood flow using laser speckle. J. Cereb. Blood Flow Metab. 21, 195–201 (2001). [DOI] [PubMed] [Google Scholar]
- 15.Draijer M., Hondebrink E., Van Leeuwen T., Steenbergen W., Review of laser speckle contrast techniques for visualizing tissue perfusion. Lasers Med. Sci. 24, 639–651 (2009). [DOI] [PMC free article] [PubMed] [Google Scholar]
- 16.Asada H. H., Shaltis P., Reisner A., Rhee S., Hutchinson R. C., Mobile monitoring with wearable photoplethysmographic biosensors. IEEE Eng. Med. Biol. Mag. 22, 28–40 (2003). [DOI] [PubMed] [Google Scholar]
- 17.Fujikawa T., Tochikubo O., Kura N., Kiyokura T., Shimada J., Umemura S., Measurement of hemodynamics during postural changes using a new wearable cephalic laser blood flowmeter. Circ. J. 73, 1950–1955 (2009). [DOI] [PubMed] [Google Scholar]
- 18.Higurashi E., Sawada R., Ito T., An integrated laser blood flowmeter. J. Lightwave Technol. 21, 591–595 (2003). [Google Scholar]
- 19.Zakharov P., Talary M. S., Caduff A., A wearable diffuse reflectance sensor for continuous monitoring of cutaneous blood content. Phys. Med. Biol. 54, 5301–5320 (2009). [DOI] [PubMed] [Google Scholar]
- 20.Nitzan M., Fairs S. L. E., Roberts V. C., Simultaneous measurement of skin blood flow by the transient thermal-clearance method and laser Doppler flowmetry. Med. Biol. Eng. Comput. 26, 407–410 (1988). [DOI] [PubMed] [Google Scholar]
- 21.Nitzan M., Mahler Y., Theoretical analysis of the transient thermal clearance method for regional blood flow measurement. Med. Biol. Eng. Comput. 24, 597–601 (1986). [DOI] [PubMed] [Google Scholar]
- 22.van de Staak W. J. B. M., Brakker A. J. M., de Rijke-Herweijer H. E., Measurements of the thermal conductivity of the skin as an indication of skin blood flow. J. Invest. Dermatol. 51, 149–154 (1968). [DOI] [PubMed] [Google Scholar]
- 23.Thalayasingam S., Delpy D. T., Thermal clearance blood flow sensor—Sensitivity, linearity and flow depth discrimination. Med. Biol. Eng. Comput. 27, 394–398 (1989). [DOI] [PubMed] [Google Scholar]
- 24.Jin C., He Z., Zhang S., Qi M., Sun Z., Di D., Liu J., A feasible method for measuring the blood flow velocity in superficial artery based on the laser induced dynamic thermography. Infrared Phys. Technol. 55, 462–468 (2012). [Google Scholar]
- 25.Jang K.-I., Han S. Y., Xu S., Mathewson K. E., Zhang Y., Jeong J.-W., Kim G.-T., Webb R. C., Lee J. W., Dawidczyk T. J., Kim R. H., Song Y. M., Yeo W.-H., Kim S., Cheng H., Rhee S. I., Chung J., Kim B., Chung H. U., Lee D., Yang Y., Cho M., Gaspar J. G., Carbonari R., Fabiani M., Gratton G., Huang Y., Rogers J. A., Rugged and breathable forms of stretchable electronics with adherent composite substrates for transcutaneous monitoring. Nat. Commun. 5, 4779 (2014). [DOI] [PubMed] [Google Scholar]
- 26.Kim D.-H., Lu N., Ma R., Kim Y.-S., Kim R.-H., Wang S., Wu J., Won S. M., Tao H., Islam A., Yu K. J., Kim T.-i., Chowdhury R., Ying M., Xu L., Li M., Chung H.-J., Keum H., McCormick M., Liu P., Zhang Y.-W., Omenetto F. G., Huang Y., Coleman T., Rogers J. A., Epidermal electronics. Science 333, 838–843 (2011). [DOI] [PubMed] [Google Scholar]
- 27.Rogers J. A., Someya T., Huang Y., Materials and mechanics for stretchable electronics. Science 327, 1603–1607 (2010). [DOI] [PubMed] [Google Scholar]
- 28.Wang C., Hwang D., Yu Z., Takei K., Park J., Chen T., Ma B., Javey A., User-interactive electronic skin for instantaneous pressure visualization. Nat. Mater. 12, 899–904 (2013). [DOI] [PubMed] [Google Scholar]
- 29.Wang S., Li M., Wu J., Kim D.-H., Lu N., Su Y., Kang Z., Huang Y. G., Rogers J. A., Mechanics of epidermal electronics. J. Appl. Mech. 79, 031022 (2012). [Google Scholar]
- 30.Webb R. C., Bonifas A. P., Behnaz A., Zhang Y., Yu K. J., Cheng H., Shi M., Bian Z., Liu Z., Kim Y.-S., Yeo W.-H., Park J. S., Song J., Li Y., Huang Y., Gorbach A. M., Rogers J. A., Ultrathin conformal devices for precise and continuous thermal characterization of human skin. Nat. Mater. 12, 938–944 (2013). [DOI] [PMC free article] [PubMed] [Google Scholar]
- 31.Schwartz G., Tee B. C.-K., Mei J., Appleton A. L., Kim D. H., Wang H., Bao Z., Flexible polymer transistors with high pressure sensitivity for application in electronic skin and health monitoring. Nat. Commun. 4, 1859 (2013). [DOI] [PubMed] [Google Scholar]
- 32.Kaltenbrunner M., Sekitani T., Reeder J., Yokota T., Kuribara K., Tokuhara T., Drack M., Schwödiauer R., Graz I., Bauer-Gogonea S., Bauer S., Someya T., An ultra-lightweight design for imperceptible plastic electronics. Nature 499, 458–463 (2013). [DOI] [PubMed] [Google Scholar]
- 33.Drack M., Graz I., Sekitani T., Someya T., Kaltenbrunner M., Bauer S., An imperceptible plastic electronic wrap. Adv. Mater. 27, 34–40 (2015). [DOI] [PMC free article] [PubMed] [Google Scholar]
- 34.Fiala D., Lomas K. J., Stohrer M., A computer model of human thermoregulation for a wide range of environmental conditions: The passive system. J. Appl. Physiol. 87, 1957–1972 (1985). [DOI] [PubMed] [Google Scholar]
- 35.Shih T.-C., Kou H.-S., Lin W.-L., Effect of effective tissue conductivity on thermal dose distributions of living tissue with directional blood flow during thermal therapy. Int. Commun. Heat Mass Transfer 29, 115–126 (2002). [Google Scholar]
- 36.Webb R. C., Pielak R. M., Bastien P., Ayers J., Niittynen J., Kurniawan J., Manco M., Lin A., Cho N. H., Malyrchuk V., Balooch G., Rogers J. A., Thermal transport characteristics of human skin measured in vivo using ultrathin conformal arrays of thermal sensors and actuators. PLOS One 10, e0118131 (2015). [DOI] [PMC free article] [PubMed] [Google Scholar]
- 37.ten Berge M. G., Yo T. I., Kerver A., de Smet A. A. E. A., Kleinrensink G.-J., Perforating veins: An anatomical approach to arteriovenous fistula performance in the forearm. Eur. J. Vasc. Endovasc. Surg. 42, 103–106 (2011). [DOI] [PubMed] [Google Scholar]
- 38.Kvandal P., Landsverk S. A., Bernjak A., Stefanovska A., Kvernmo H. D., Kirkebøen K. A., Low-frequency oscillations of the laser Doppler perfusion signal in human skin. Microvasc. Res. 72, 120–127 (2006). [DOI] [PubMed] [Google Scholar]
- 39.Intaglietta M., Tompkins W. R., On-line measurement of microvascular dimensions by television microscopy. J. Appl. Physiol. 32, 546–551 (1972). [DOI] [PubMed] [Google Scholar]
- 40.Less J. R., Skalak T. C., Sevick E. M., Jain R. K., Microvascular architecture in a mammary carcinoma: Branching patterns and vessel dimensions. Cancer Res. 51, 265–273 (1991). [PubMed] [Google Scholar]
- 41.Allen J., Frame J. R., Murray A., Microvascular blood flow and skin temperature changes in the fingers following a deep inspiratory gasp. Physiol. Meas. 23, 365–373 (2002). [DOI] [PubMed] [Google Scholar]
- 42.Sangkatumvong S., Khoo M. C. K., Kato R., Detterich J. A., Bush A., Keens T. G., Meiselman H. J., Wood J. C., Coates T. D., Peripheral vasoconstriction and abnormal parasympathetic response to sighs and transient hypoxia in sickle cell disease. Am. J. Respir. Crit. Care Med. 184, 474–481 (2011). [DOI] [PMC free article] [PubMed] [Google Scholar]
- 43.Mayrovitz H. N., Groseclose E. E., Inspiration-induced vascular responses in finger dorsum skin. Microvasc. Res. 63, 227–232 (2002). [DOI] [PubMed] [Google Scholar]
Associated Data
This section collects any data citations, data availability statements, or supplementary materials included in this article.
Supplementary Materials
Supplementary material for this article is available at http://advances.sciencemag.org/cgi/content/full/1/9/e1500701/DC1
Methods: Device fabrication
Materials: Peel strength and adhesion
Fig. S1. Analysis of thermal actuator power levels.
Fig. S2. Epidermal device data output for skin locations with isotropic thermal transport.
Fig. S3. FEA verification for the transient scaling law.
Fig. S4. Comparison between FEA and polydimethylsiloxane experiments.
Fig. S5. Optical VeinViewer image used to accurately identify blood vessel locations.
Fig. S6. The influence of variation of λs/λf, ρfcf/ρscs, and B/L on the transient scaling law.
Fig. S7. Verification for the steady-state scaling law by FEA and experiments.
Fig. S8. The influence of variation of λs/λf, h/L, and B/L on the steady-state scaling law.
Fig. S9. Transient temperature response caused by flow speed change.
Fig. S10. Noise analysis of epidermal data acquisition system.
Fig. S11. Noise analysis of epidermal devices on skin.
Fig. S12. Statistical correlation between LSCI data and epidermal device data from Fig. 4.
Fig. S13. Comparison between LDF signal and epidermal device signal during 10 min of natural flow on the volar aspect of the wrist of a male, age 33.
Fig. S14. Comparison between LDF signal and epidermal device signal during 10 min of natural flow on the dorsal aspect of the hand of a male, age 23.
Fig. S15. Quantitative blood flow conversion of Fig. 5A.
Fig. S16. Statistical correlation between LSCI data and epidermal device data from Fig. 5A.
Fig. S17. Assessment of depth of vein associated with Fig. 5J.
Fig. S18. Device thermal signals during motion.
Fig. S19. LDF measurements before and after slap-induced microvascular hyperemia.
Fig. S20. Statistical correlation between LSCI data and epidermal device data from Fig. 7.
Fig. S21. Comparison of errors induced in the device response for continuous mode and pulsed mode actuation in a control experiment.
Fig. S22. Epidermal device wiring diagram and hardware setup.
Movie S1A. Movie of device signals over time for experiments presented in Fig. 3 (A to C).
Movie S1B. Infrared movie showing the sequential pressure applications for experiments presented in Fig. 3 (A to C) and movie S1A.
Movie S2. Movie of device signals over time for experiments presented in Fig. 4 (A to D).
Movie S3. Movie of device signals over time for experiments presented in Fig. 5 (A to I).
Movie S4. Infrared movie of thermal distribution over time due to device heating for experiments presented in Fig. 5 (J to M). An arrow in the infrared movie shows the location of the pulses, which appear during the period of 460 s < t < 620 s. Text indicators are also displayed during the movie to coincide with each pulse.