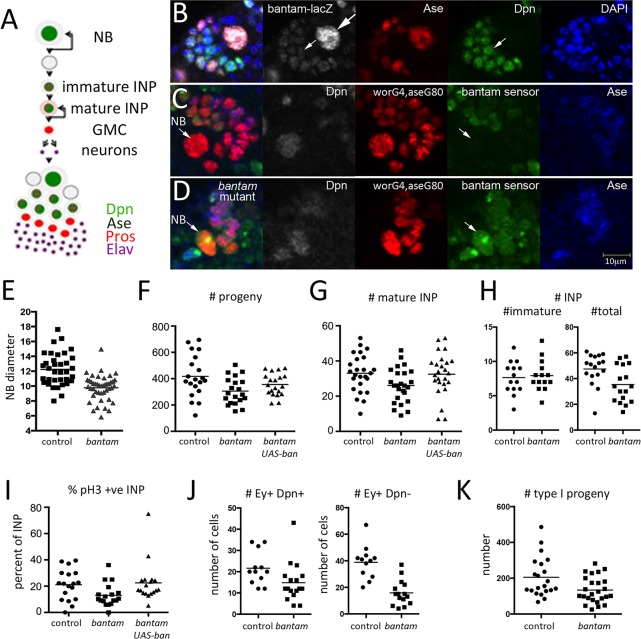
Fig. 3.
bantam is required cell-autonomously in type II NB lineages. (A) Diagram representing a type II NB lineage. Cell types can be identified by a combination of molecular markers: type II NB: nuclear Dpn (light green); immature INP: nuclear Ase (dark green); mature INP: nuclear Dpn, nuclear Ase and cytoplasmic Pros (pink); GMC: nuclear Pros (red); post-mitotic neurons: nuclear Elav (purple). (B) bantam-lacZ expression (gray) in a single type II NB lineage labeled with anti-Dpn (green), anti-Ase (red) and DAPI (blue). Large arrow indicates the large Dpn+Ase− type II NB. Small arrow indicates lower levels of bantam-lacZ observed in Dpn+Ase− immature INP and in Dpn+Ase+ mature INP. (C) A single type II NB lineage showing bantam GFP sensor expression (green) in a WT control brain. The type II lineage was labeled by worniu-Gal4, asense-Gal80-driven UAS-RFP (red). Bantam sensor GFP (green) was very low in the Dpn+ (gray) Ase− (blue) type II NB (arrow). (D) Bantam GFP sensor expression in a bantam mutant brain. Labeling as in panel B. Note the higher level of sensor (green) in the neuroblast and INPs due to loss of bantam-mediated repression of GFP expression. (E) Type II NB diameter (µm) in control (FRT2A) and bantamΔ1/Δ1 mutant type II NB clones. Control: n=35 brains; bantamΔ1/Δ1 n=42 brains. Horizontal line: mean value. P<0.0001, Mann–Whitney test. (F) Total number of GFP+ progeny in control and bantamΔ1/Δ1 mutant type II NB clones±UAS-bantam. n=20 clones/genotype. ANOVA: P<0.05. (G) Total number of mature INPs (Dpn+Ase+) in control and bantamΔ1/Δ1 mutant type II NB clones±UAS-bantam. n=25/genotype. ANOVA: P<0.05. (H) Number of immature and total INPs in control and bantamΔ1/Δ1 mutant type II NB clones. Immature INPs were identified by the absence of nuclear Dpn and presence of nuclear Ase in the MARCM clone. n=14/genotype. P=0.83 for immature INPs and P=0.01 for total INPs (Mann–Whitney test). (I) Percentage of mature INPs with anti-pH3 staining in control and bantamΔ1/Δ1 mutant type II NB clones±UAS-bantam. n=18 clones/genotype. ANOVA: P<0.05. (J) Number of older INPs and their progeny in control and bantamΔ1/Δ1 mutant type II NB clones. Older INPs were identified as cells in the MARCM clones expressing Deadpan and Eyeless (P=0.015, Mann–Whitney test). Progeny were identified as cells in the clones expressing Eyeless, but not Deadpan (n=12 control clones and 17 bantam mutant clones; P<0.0001, Mann–Whitney test). (K) Number of GFP-labeled progeny in type I lineages comparing control and bantamΔ1/Δ1 mutant MARCM clones (P=0.017, Mann–Whitney test).

