
Figure 2. Mean relative abundances of particular genera in pancreatic cancer patients (P) compared to healthy (H) and other disease (O) patient groups.
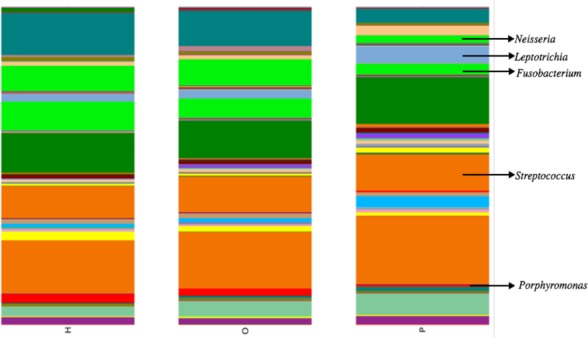
Relative abundances of genera in oral communities from 108 patients. Arrows point to specific genera that showed interesting trends across diagnosis groups.