Abstract
Multiple myeloma (MM) cells typically grow in focal lesions, stimulating osteoclasts that destroy bone and support MM. Osteoclasts and MM cells are hypermetabolic. The coenzyme nicotinamide adenine dinucleotide (NAD+) is not only essential for cellular metabolism; it also affects activity of NAD-dependent enzymes, such as PARP-1 and SIRT-1. Nicotinamide phos-phoribosyltransferase (NAMPT/PBEF/visfatin, encoded by PBEF1) is a rate-limiting enzyme in NAD+ biosynthesis from nicotinamide. Coculture of primary MM cells with osteoclasts induced PBEF1 upregulation in both cell types. PBEF1 expression was higher in experimental myelomatous bones than in nonmyelomatous bone and higher in MM patients’ plasma cells than in healthy donors’ counterparts. APO866 is a specific PBEF1 inhibitor known to deplete cellular NAD+, APO866 at low nanomolar concentrations inhibited growth of primary MM cells or MM cell lines cultured alone or cocultured with osteoclasts and induced apoptosis in these cells. PBEF1 activity and NAD+ content were reduced in MM cells by APO866, resulting in lower activity of PARP-1 and SIRT-1. The inhibitory effect of APO866 on MM cell growth was abrogated by supplementation of extracellular NAD+ or NAM. APO866 inhibited NF-κB activity in osteoclast precursors and suppressed osteoclast formation and activity. PBEF1 knockdown similarly inhibited MM cell growth and osteoclast formation. In the SCID-rab model, APO866 inhibited growth of primary MM and H929 cells and prevented bone disease. These findings indicate that MM cells and osteoclasts are highly sensitive to NAD+ depletion and that PBEF1 inhibition represents a novel approach to target cellular metabolism and inhibit PARP-1 and bone disease in MM.
Hypermetabolism in tumor cells is recognized as a physiologic response to certain metabolic by-products with important roles in signaling associated with tumor cell proliferation, cycle, survival, and drug resistance [1]. Nicotinamide adenine dinucleotide (NAD+) is a coenzyme crucially involved in several cellular functions, including energy metabolism, reactive oxygen species scavenging, DNA repair, and various signaling pathways [2,3], Glycolysis, which is highly utilized by tumor cells, requires relatively more NAD+ to generate adenosine triphosphate (ATP) than that required for oxidative phosphorylation normally occurring in nonmalignant tissues. Key enzymes that are highly dependent on NAD+ and implicated in tumorigenesis are the poly(ADP-ribose) polymerases (PARPs) and the sirtuins [3].
NAD is synthesized intracellulary through either de novo synthesis or one of the recycling pathways [4], Nicotinamide phosphoribosyltransferase (NAMPT) is a key enzyme in the recycling pathway for NAD+ synthesis from nicotinamide. While initially recognized as pre–B-cell colony-enhancing factor (PBEF1), this molecule also exists as an extracellular soluble factor known as visfatin and is proposed to act as an adipokine and inflammatory stimulator by its ability to induce secretion of inflammatory cytokines [5].
APO866 is a specific, competitive, potent inhibitor of NAMPT that displays cytotoxicity in a broad panel of cell lines [6], This agent has also shown therapeutic effects in experimental models of arthritis [5], endotoxic shock [7], and autoimmune encephalitis [8]. Interestingly, various malignant hematologic cells are highly sensitive to NAD+ depletion, in contrast to other malignant cells, presumably because of aberrant metabolic demands and increased reliance on enzymes that depend on NAD+ [9]. In multiple myeloma (MM) cell lines, AFO866 has been shown to induce cell death through induction of autophagy [l0].
In MM, malignant plasma cells typically residing within focal lesions are often quiescent, with low proliferative activity, but still metabolically active as shown by their ability to consume glucose [11-13]. Clinical studies in our institute have demonstrated the prognostic value in MM of magnetic resonance imaging and combined positron-emission tomography–computed tomography [11,13]. Observations obtained from these studies implicate hypermetabolic activity of myeloma cells in focal lesions in tumor burden, metastasis, and survival and highlight the potential of targeting cellular metabolism in this disease. Typical to MM, these focal lesions often become osteolytic due to suppression of osteoblasts and increased osteoclast number and activity [14]. Mature multinucleate osteoclasts are loaded with mitochondria and require high energy for their bone-resorptive activity. These cells have been shown to stimulate myeloma cell survival directly [15] and protect myeloma cells from spontaneous and drug-induced apoptosis [16].
In this study, we report on our investigations of the expression of PBEF1 (encoding NAMPT/PBEF1) in experimental and clinical primary myeloma cells and osteoclasts and of the effect of PBEF1 inhibition on myeloma cell growth, osteoclast activity, and bone disease.
Methods
Complete information on Methods can be found in Supplementary Methods (online only, available at www.exphem.org).
MM cell lines and primary myeloma cells
The MM cell lines ARP1 and CAG were established by our institute. The MM cell lines H929, U266, and 8226 were obtained from American Type Culture Collection (Manassas, VA, USA). MM cell lines were grown in vitro in RPMI 1640 medium supplemented with 10% fetal bovine albumin and antibiotics. For in vivo imaging and monitoring of cell growth in coculture with osteoclasts, H929 and U266 cells were infected with lentivirus containing luciferase–enhanced green fluorescent protein (EGFP) constructs as previously described [17].
Primary myeloma cells were obtained from heparinized bone marrow aspirates from 24 patients with MM. Cells in the bone marrow samples were separated by density centrifugation with Ficoll-Paque (GE Healthcare Bio-Sciences, Piscataway, NJ, USA). CD138-expressing plasma cells were isolated as described previously [18]. Engraftment of MM in vivo was preformed as described [19-23].
Primary myeloma cells and osteoclast cocultures
Cultures of mature osteoclasts were prepared as described previously [15]. For gene expression profiling (GEP) analysis, CD138-selected primary myeloma cells from eight patients were cocultured with osteoclasts in osteoclast medium for 3–4 days. Aliquots of precultured myeloma cells were immediately used for GEP analysis, whereas osteoclasts cultured alone were kept and analyzed as control. In the coculture system, myeloma cells do not adhere tightly to osteoclasts, allowing separation of the two cell populations as described [15,19]. At the end of the experiments, the myeloma cells were separated from the osteoclasts, and the cocultured myeloma cells and osteoclasts were processed for GEP analysis.
GEP analyses of NAMPT/PBEF1
GEP with the Affymetrix U133 Plus 2.0 microarray (Affymetrix, Santa Clara, CA, USA) was performed on CD138-selected plasma cells, MM cell lines, osteoclasts, and whole human bones as previously described [18]. GEP data on plasma cells from normal donors, newly diagnosed MM patients, and MM cell lines have been deposited with the Gene Expression Omnibus 8 at the National Center for Biotechnology Information and are accessible through GEO Series accession number GSE2658.
Myeloma cell growth and apoptosis assays
For all in vitro studies, APO866 (TopoTarget, Lausanne, Switzerland) was diluted with saline. To test its effect on myeloma cell growth, the indicated MM cell lines were cultured in 96-well plates (100,000 cells/well) for 72 hours in the absence and the presence of the indicated concentrations of APO866 (0.1–50 nmol/L). Myeloma cell growth was determined with the MTT (3-(4,5-dimethylthiazol-2-yl)-2,5-diphenyltetrazolium bromide) assay.
To assess the effects of APO866 on the growth of MM cell lines in coculture with osteoclasts, luciferase-expressing MM cell lines H929 and U266 were cocultured with osteoclasts (104 cells/well) in 96-well white plates for 72 hours in the absence or presence of APO866, and cell growth was determined as previously described [17]. Apoptosis was analyzed by flow cytometry using an annexin V–propidium iodide (PI) detection kit (BD Biosciences, San Jose, CA, USA). In indicated experiments, extracellular NAD+ (Sigma-Aldrich, St. Louis, MO, USA) was added to myeloma cell cultures treated with APO866.
PBEF1 content
Total-cell lysate of myeloma cells were prepared with a mammalian cell extraction kit (BioVision, Milpitas, CA, USA). Protein concentrations were measured with Bio-Rad Protein Assay reagent (Hercules, CA, USA). NAMPT/PBEF1 in cell lysates was quantified with the human NAMPT (visfatin/PBEF1) enzyme-linked immunosorbent assay (ELISA) kit from AdipoGen (Seoul, South Korea) according to the manufacturer’s instructions.
NAD+ content
Intracellular NAD+ was measured with an NAD+/NADH quantification kit (BioVision) following the manufacturer’s instructions. NAD+/NADH was extracted from cell samples with extraction buffer and filtered through 10-kDa cutoff filters (Pierce, Rockford, IL, USA). Protein concentration was measured with a Bio-Rad protein assay. For each sample, cell extract was heated to 60°C for 30 min to decompose NAD+ but keep NADH intact. During measurement, both heated and unheated extracts from each sample, together with the NADH standard solutions, were transferred into 96-well plates. NAD cycling mix was added to each well and incubated at room temperature for 5 min to convert NAD+ to NADH; the addition of NADH developer followed. The mixture was incubated for 2 hours and read at an optical density of 450 nm by a kinetic ELISA reader (Spectra MAX 250, Molecular Devices, Sunnyvale, CA, USA). NAD+ content per total protein amount was calculated by subtracting NADH content.
PARP-1 activity
Poly(ADP-ribose) polymerase (PARP) activity was assayed with the Universal Colorimetric PARP Assay kit (Trevigen, Gaithersburg, MD, USA), based on the incorporation of biotinylated ADP-ribose onto histone proteins. Cell lysates from each sample (50 μg) were loaded into a 96-well plate coated with histones and biotinylated poly(ADP-ribose) (for specific detection of PARP-1 activity), treated with horseradish peroxidase (HRP)-conjugated streptavidin, and read all 450 nm with a spectrophotometer.
SIRT-1 activity
Change of NAD+ -dependent deacetylase activity in myeloma cells was determined with the Fluor-de-Lys histone deacetylase (HDAC) fluorometric cellular activity assay kit (Enzo Life Sciences, Farmingdale, NY, USA).
Osteoclast differentiation, activity, and NFκB activity
Osteoclast differentiation and activity assays were performed as described previously [15]. To test the effect on osteoclast differentiation, osteoclast precursors were incubated in the osteoclast medium in the absence and the presence of indicated concentrations of APO866 for 5–7 days. At that time, the cultures were fixed with 10% formalin and stained for tartrate-resistant acid phosphatase (TRAP), and the number of TRAP-positive multinucleate osteoclasts was counted as described [15].
For pit-formation assay, osteoclasts on dentine slices were treated with indicated concentrations of APO866 for 5 days, and pit-formation area was quantified as described [15].
NF-κB activity was quantified using an ELISA-based kit (Active Motif, Carlsbad, CA, USA) which determines the level of p65 in nuclear extracts according to the manufacturer’s instructions.
Statistical analyses
All values are expressed as means ± SEM, unless indicated otherwise. Student t test was used to analyze the effect of treatment on myeloma cell growth and apoptosis, osteoclast formation, and bone mineral density (BMD).
Results
PBEF1 is upregulated in primary myeloma cells and osteoclasts after coculture
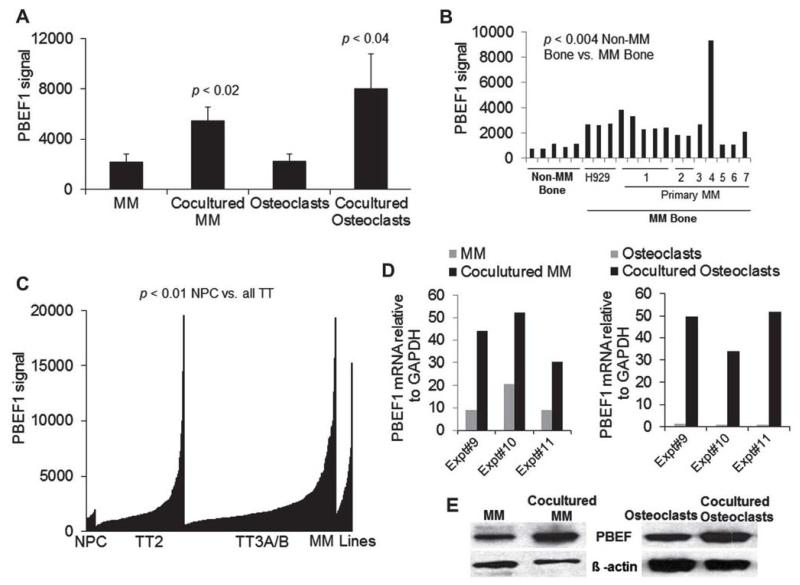
Coculture experiments of primary myeloma cells from eight patients with supportive osteoclasts revealed significant upregulation of PBEF1 in cocultured myeloma cells by threefold (p < 0.02) and in cocultured osteoclasts by fourfold (p < 0.04) as assessed by GEP analysis (Fig. 1A). Our investigation by GEP of PBEF1 expression in nonmyelomatous and myelomatous human bones in the SCID-hu model found threefold upregulation of PBEF1 (p < 0.004) in whole human myelomatous bone from SCID-hu mice engrafted with the H929 MM cell line or primary myeloma cells from seven patients (Fig. 1B). This suggests that myeloma cells are the major source of PBEF1 in myelomatous bone.
Figure 1.
PBEF1 is upregulated in primary myeloma cells and osteoclasts after coculture and in myeloma cells from a subset of patients. (A) Primary myeloma plasma cells from eight patients were cocultured with osteoclasts for 3 days. The cocultured myeloma cells and osteoclasts were separated and subjected to GEP analysis along with precultured myeloma plasma cells from the same patients (MM) and osteoclasts cultured alone (osteoclasts). (B) Human bones from nonmyelomatous (Non-MM Bone) and myelomatous SCID-hu mice (MM Bone) engrafted with H929 cells or primary myeloma cells from seven patients were subjected to GEP analysis. (C) Expression of PBEF1 in plasma cells from healthy donors (NPC; n = 25), primary myeloma cells from the Total Therapy 2 (TT2; n = 249) and Total Therapy 3A/B (TT3A/B; n = 425) clinical trials, and MM cell lines (n = 255). (D) Expression of PBEF1 by qRT-PCR in myeloma cells (left panel) and osteoclasts (right panel) in three additional sets of coculture experiments. (E) PBEF1 protein expression was assessed by Western blot in myeloma cells (left panel) and osteoclasts (right panel) without or after coculture.
We examined PBEF1 expression in myeloma plasma cells from patients with a new diagnosis and who participated in the Total Therapy 2 and 3 clinical trials at our institute and compared their expression to normal plasma cells and MM cell lines [18,24]. As expected, PBEF1 was expressed heterogeneously in patients’ myeloma cells, but overall PBEF1 expression was higher than in normal plasma cells and lower than in MM cell lines (Fig. 1C). Of note, in a subset of patients, PBEF1 expression was comparable to that of the MM cell lines (Fig. 1C).
We validated our GEP findings with quantitative reverse-transcriptase polymerase chain reaction (qRT-PCR) and Western blot by demonstrating upregulation of PBEF1 in osteoclast-cocultured myeloma cells from three additional patients (Fig. 1D and 1E). These data indicate that PBEF1 is upregulated in myeloma cells growing in a supportive microenvironment.
APO866 or PBEF1 knockdown inhibits growth and induces apoptosis in myeloma cells
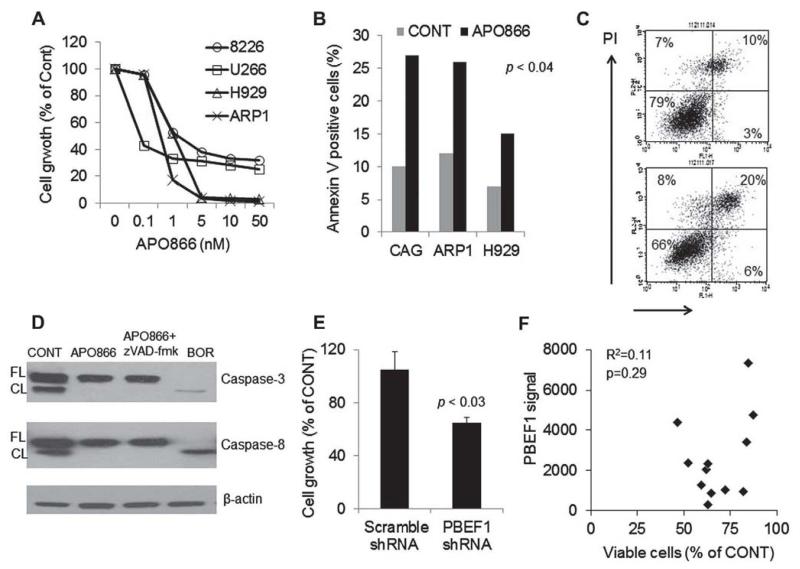
We tested the in vitro effect of APO866 on growth of the 8226, U226, H929, and ARP1 MM cell lines. APO866 inhibited growth of these cells at low nanomolar concentrations in a dose-related manner (Fig. 2A). The 72-hour IC50 growth inhibition values ranged between 0.1 and 5 nmol/L concentrations. This compound also significantly induced apoptosis in the H929, ARP1, and CAG MM cell lines as assessed by annexin V–PI flow cytometry (Fig. 2B and 2C). Because previous report suggested that APO866 induces apoptosis through caspase-independent mechanism [10], we tested the effect of the drug and bortezomib, as a positive control, on activity of caspase-3 and caspase-8 using Western blot. We found that in contrast to bortezomib APO866 (10 nmol/L) had no effect on activation caspase-3 or caspase-8 (Fig. 2D). We also tested the effect of PBEF1 inhibition by short hairpin RNA (shRNA) on growth of luciferase-expressing ARP1 MM cells. PBEF1 gene expression was knockdown by 47%, an effect that was associated with a significant reduction in ARP1 MM cell line growth (Fig. 2E).
Figure 2.
APO866 and PBEF1 knockdown induces apoptosis and inhibits growth of myeloma cells, (A) The indicated MM cell lines were treated with increasing concentrations of APO866 for 72 hours and then subjected to MTT assay. (B, C) The indicated MM cell lines were treated with APO866 (2.5 nmol/L, 48 hours) and then subjected to apoptosis assay with annex in V–PI flow cytometry. Percentages of annex in V–positive (apoptotic) cells (B) and a representative flow cytometry analysis of ARP1 cells (C) are shown. (D) Western blot analysis demonstrating lack of cleavage (activity) of caspase-3 or caspase-8 in the absence or presence of z-VAD-fmk (pan caspase inhibitor) in ARP1 cells exposed to APO866 for 24 hours. The proteasome inhibitor bortezomib (BOR) was used as a positive control measure. (E) Luciferase-expressing ARP1 MM cells were infected with lentiviral particles containing scramble or PBEF1 shRNA and then subjected to growth assay using luciferase activity (96 hours). (F) Freshly obtained CD138-selected MM cells from 13 patients were treated with APO866 (10 nmol/L) for 96 hours. The effect on MM cell survival and growth was assessed by trypan blue exclusion, whereas PBEF1 gene expression was determined by GEP. Overall, APO866 inhibited survival and growth of primary MM cells by 49% ± 4% (p < 0.0001), an effect that was not correlated with expression of PBEF1 in these cells.
We tested the effect of APO866 (10 and 20 nmol/L) on growth of CD138-selected MM cells from 13 patients with MM and looked for the association between response to APO866 and expression of PBEF1 as assessed by GEP. APO866 (10 and 20 nmol/L) inhibited growth of primary MM cells by 49% ± 4% and 37% ± 5%, respectively (p < 0.0001). However, there was no significant correlation (r = 0.11) between PBEF1 expression and response to APO866 (Fig. 2F). Furthermore, in 9 of 12 of these samples, we tested the effect of APO866 on expression of PBEF1 in treated MM cells using qRT-PCR. PBEF1 gene expression was insignificantly changed by 1.09 ± 0.16-fold and 1.07 ± 0.18-fold in primary MM cells following treatment with 10 and 20 nmol/L of APO866, respectively.
To determine the anti-myeloma effect of APO866 in a supportive environment, luciferase-expressing H929 myeloma cells were cultured alone or cocultured with osteoclasts in the absence and presence of increasing concentrations of APO866. Growth of myeloma cells as assessed by bioluminescence analysis was higher in cocultured osteoclasts. APO866 effectively inhibited growth of myeloma cells in cocultures (Supplementary Figure E1A and E1B, online only, available at www.exphem.org). At minimal concentrations that effectively inhibited myeloma cell growth, APO866 had minimal effect on the viability of mature osteoclasts (Supplementary Figure E1C, online only, available at www.exphem.org). Similar results were obtained in coculture of MM cell lines with mesenchymal stem cells (data not shown). These data showed that a low nanomolar concentration of APO866 was effective against myeloma cells even in a supportive environment.
APO866 reduces PBEF1 activity and inhibits myeloma cell growth by depleting cellular NAD+
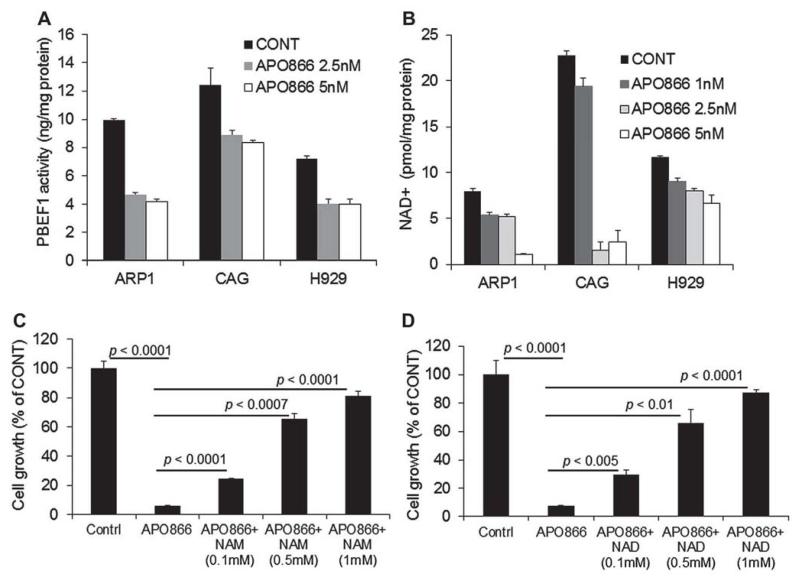
PBEF1 enzymatic activity was measured in the ARP1, CAG, and H929 MM cell lines exposed to 2.5–5-nmol/L concentrations of APO866 for 48 hours. APO866 inhibited PBEF1 activity by 52%, 28%, and 45% in ARP1, CAG, and H929 cells, respectively (p < 0.02; Fig. 3A). This effect of APO866 was associated with parallel reductions in intracellular NAD+ content in the three cell lines (2.5 nmol/L, p < 0.01; 5 nmol/L, p < 0.001; Fig. 3B).
Figure 3.
APO866 reduces PBEF1 and NAD+ contents in myeloma cells, whereas extracellular NAD+ compensates for NAD+ depletion by APO866. (A) PBEF1 content in the indicated MM cell lines cultured for 48 hours in the absence and presence of the indicated concentrations of APO866. (B) NAD+ content in the indicated MM cell lines cultured for 48 hours in the absence and presence of the indicated concentrations of APO866. (C, D) Luciferase-expressing ARP1 myeloma cells were treated with APO866 (5 nmol/L), APO866 and NAM (0.1–1 mmol/L) (C), or APO866+ NAD+ (0.1–1 mmol/L) (D) for 72 hours and then subjected to growth assay by measurement of bioluminescence intensity.
To test whether APO866 mediated myeloma cell growth inhibition through NAD+ depletion, the ARP1 myeloma cells were treated with APO866 in the absence and presence of extracellular NAD+ or NAM. The addition of exogenous NAD+ or NAM restored the APO866-mediated myeloma cell death in a dose-related manner (Fig. 3C, D). These results confirm that APO866 is a PBEF1-specific inhibitor that affects myeloma cell growth by depleting NAD+ content.
PBEF1 inhibition is associated with reduced SIRT-1 and PARP-1 activity in myeloma cells
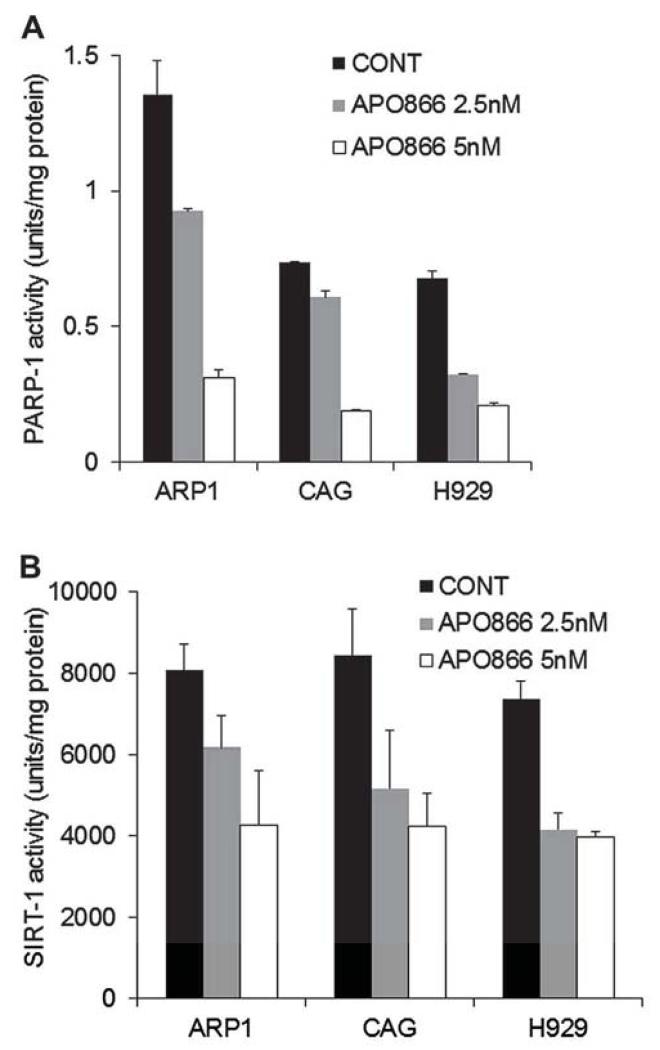
NAD is required for the activity of PARP-1 and sirtuin-l (SIRT-1) [25]. PARP-1 is activated by DNA damage and plays a critical role in the base-excision DNA repair pathway [26]. SIRT-1 has a prominent role in the survival of mammalian cells under stress and is a key downstream effector for PBEF1 in numerous physiologic processes [27], We therefore sought to determine the consequence of NAD+ depletion on the activities of these enzymes in myeloma cells treated with 2.5–5 nmol/L APO866. The activity of both PARP-1 (Fig. 4A) and SIRT-1 (Fig. 4B) was reduced in a dose-related manner in the ARP1, CAG, and H929 MM cell lines. At the lower APO866 concentration (2.5 nmol/L), PARP-1 activity was reduced by 34% ± 10% (p < 0.04), whereas SIRT-1 activity was reduced by 37% ± 6% (p < 0.04).
Figure4.
APO866 reduces PARP-1 and SIRT-l activity in myeloma cells. The indicated MM cell lines were treated with APO866 (2.5 or 5 nmol/L) for 48 hours and then subjected to PARP-1 (A) or SIRT-1 (B) enzymatic activity assay.
APO866 inhibits myeloma growth and associated bone disease in vivo
For the in vivo experiments, SCID-rab mice were engrafted with primary myeloma cells [20,23] expressing high level of PBEF1 from a patient whose disease was molecularly classified as high risk (MF subset). We also engrafted SCID-rab mice with luciferase-expressing H929 cells, which allowed us to assess myeloma growth by live-animal bioluminescence imaging [17,28].
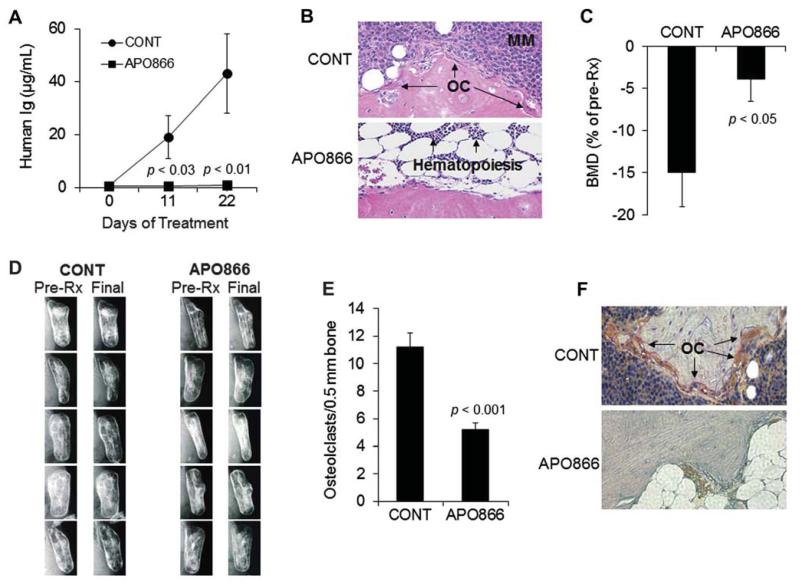
APO866 completely eradicated primary myeloma cell growth in the SCID-rab model as assessed by human immunoglobulin (hIg) measurements in mice sera (Fig. 5A). At the experiment’s end, circulating hIg levels in control and APO866-treated groups were 43 ± 15 μg/mL and 1 ± 0.6 μg/mL, respectively (p < 0.01). Histologic analysis of the myelomatous bones revealed reduced infiltration of myeloma cells (Fig. 5B). BMD values of implanted bones in control mice were reduced by 15% ± 4% from pretreatment levels, but were increased by 3.9% ± 2.7% (p < 0.05) from pretreatment levels in the APO866-treated group (Fig. 5C). Prevention of bone disease by APO866 was also observed on radiographs (Fig. 5D). Histochemical TRAP staining of bone sections revealed lower numbers of osteoclasts in the APO866-treated group (Fig. 5E and 5F).
Figure 5.
APO866 inhibits primary myeloma cell growth and hone disease in the SCID-rab model. SCID-rab mice engrafted with a patient’s myeloma cells were treated with APO866 (20 mg/kg, twiec a day for 5 days/week, subcutaneously; n = 10) or saline (CONT; n = 10) for 3 weeks. (A) Circulating levels of human immunoglobulins (human Ig) at the indicated time points after treatment show marked inhibition of myeloma growth by APO866. (B) Representative histologic bone sections stained with hematoxylin and cosin show the infiltration of myeloma cells in myelomatous bones from control but not APO866-treated hosts. (C) Bone mineral density (BMD) of the implanted bones from hosts treated with saline (CONT) or APO866. (D) Radiographs of the myelomatous bones from five mice in each group were obtained before initiation of treatment (Pre-Rx) and at the end of the experiment (Final). Note that bone destruction was apparent before the initiation of treatment and continued to increase in the control group, whereas APO866 treatment prevented further bone destruction. (E) Number of TRAP-expressing osteoclasts in myelomatous bones of each group. (F) A representative histologic bone section stained for TRAP shows a high number of osteoclasts in bone from control hosts (CONT, osteoclasts stained red), but not in bone from the APO866-treated host.
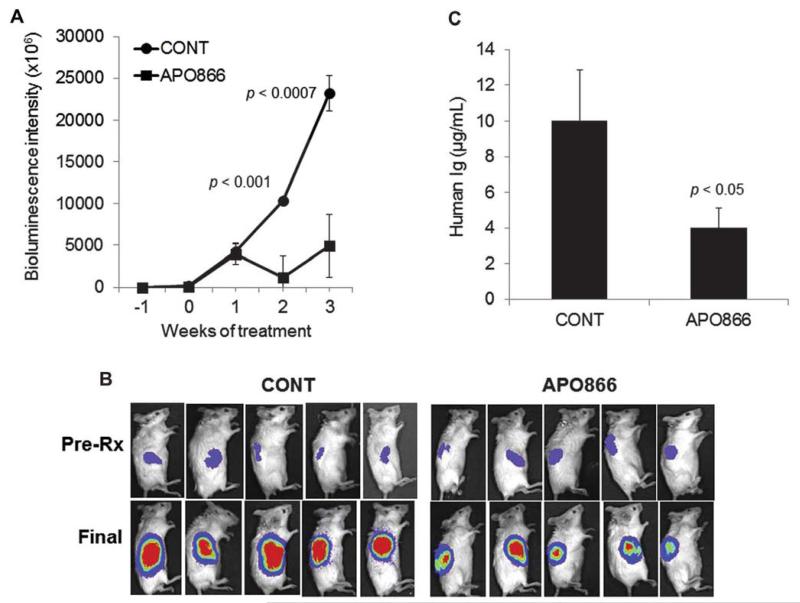
In the second experiment, luciferase-expressing H929 myeloma cells were engrafted in SCID-rab mice and treated with control vehicle or APO866 for 3 weeks. APO866 significantly reduced progression of H929 cells in the hosts as assessed by live-animal imaging (Fig. 6A and 6B) and by measurement of hIg in mice sera (Fig. 6C). These data demonstrate the high in vivo potency of APO866 in inhibiting MM and associated bone disease.
Figure 6.
APO866 inhibits growth of H929 cells in the SCID-rab model. SCID-rab mice engrafted with the luciferase-expressng H929 MM cell line and treated with saline (CONT; n = 6) or APO866 (20 mg/kg, twice a day for 5 days/week, subcutaneously; n = 8) for 3 weeks. (A) Live-animal bioluminescence analysis at the indicated time points shows inhibition of tumor growth by APO866 (B) Representative photographs of five hosts from each group show the bioluminescence intensity of tumors in the implanted bones before initiation of treatment (Pre-Rx) and at the end of the experiment (Final). (C) Circulating levels of human immunoglobulins (Ig) at the end of the experiment indicate a reduced tumor burden in APO866-treated hosts compared with control hosts (CONT).
APO866 or PBEF1 knockdown directly inhibits osteoclast differentiation
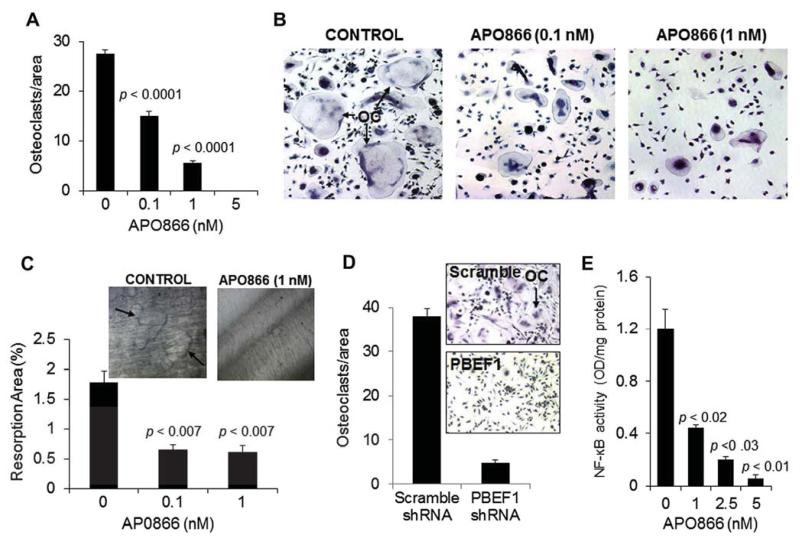
To determine the effect of APO866 on osteoclast differentiation, we generated cultures of osteoclast precursors and tested whether APO866 influences their differentiation into mature multinucleate osteoclasts. At concentrations of 0.1–5 nmol/L, APO866 markedly prevented differentiation of osteoclast precursors into multinucleate, TRAP-expressing osteoclasts (Fig. 7A and 7B). APO866 at 0.1 nmol/L also significantly suppressed the bone resorption activity of mature osteoclasts on dentine slices by approximately 36% (p < 0.007; Fig. 7C). PBEF1 shRNA reduced expression of PBEF1 in culture of osteoclast precursors by 69%, an effect that was associated with suppression of osteoclast formation (Fig. 7D). As shown in Supplementary Figure E1C (online only, available at www.exphem.org), APO866 had no effect on the viability of mature osteoclasts at concentrations that affect osteoclast activity. Finally, we tested the effect of APO866 on NF-κB nuclear localization (activity) and found significant inhibition in a dose-related manner (Fig. 7E).
Figure 7.
APO866 and PBEF1 knockdown suppresses osteoclast formation and activity and inhibits NF-κB activity in osteoclast precursors. (A) Human osteoclast precursors were cultured in osteoclastic medium supplemented with receptor activator of NF-κB ligand (RANKL) and macrophage colony-stimulating factor, treated with the indicated concentrations of APO866 for 5–7 days, and then subjected to TRAP staining for quantification of TRAP-expressing multinucleate osteoclasts. (B) Representative photomicrographs demonstrate TRAP staining in osteoclast precursor cultures treated with vehicle (CONT) or 0.1 or 1 nmol/L APO866. (C) Pit-formation assay of mature osteoclasts treated with 0.1 or 1 nmol/L APO866 for 5 days. Inserted photographs demonstrate pit formation by mature osteoclasts on dentine, an effect that was suppressed by APO866 (1 nmol/L). (D) Human osteoclast precursors were infected with lentiviral particles containing scramble or PBEF1 shRNA and then subjected to osteoclast formation assay as in (A). Inserted photographs demonstrate TRAP staining in osteoclast precursor cultures treated with scramble or PBEF1 shRNA. (E) Changes in levels of NF-κB activity in osteoclast precursors treated indicated concentrations of APO866 for 5 days.
Discussion
In this study focusing on intracellular NAD+ content and PBEF1 activity in myeloma cells, we demonstrated that PBEF1 is upregulated in myeloma cells of a large subset of patients, in MM cell lines, and in cocultured primary myeloma cells and osteoclasts. Depletion of NAD+ by APO866 or PBEF1 knockdown dramatically reduced survival and growth of myeloma cells in vitro, in cocultures, and in vivo, indicating that PBEF1 enzymatic activity is indispensable for disease progression [10]. In addition to inducing energy deficiency, APO866 reduced activity of PARP-1 and SIRT-1, two enzymes that are highly dependent on NAD+ and have critical roles in tumor cell survival [26,29]. Osteoclasts, which are enriched with mitochondria because of excessive energy demand, were also highly sensitive to NAD+ depletion, as APO866 inhibited osteoclast formation and bone-resorbing activity in vitro and in myelomatous bones. Although agents currently used in clinical myeloma, such as dexamethasone, melphalan, and bortezomib, can affect cellular metabolism in myeloma cells, APO866 represents a unique agent directly targeting a specific metabolic pathway to control MM and its associated bone disease.
Previous studies demonstrated that low nanomolar concentrations of APO866 effectively kill various hematopoietic tumor cell lines, including myeloma cells, whereas at similar concentrations the compound has no toxic effects on normal cells in vitro or visible side effects in vivo [9,10]; this is presumably due to high consumption of NAD+ by tumor cells for glycolysis, whereas normal cells either process ATP via oxidative phosphorylation or produce a sufficient amount of NAD through alternative pathways [30]. It should be noted that the extent of the consequences of NAD depletion on myeloma cell survival or growth could be varied depending on the type of assay. For example, tetrazolium-based assays such as MTT (3-(4,5-Dimethylthiazol-2-yl)-2,5-Diphenyltetrazolium Bromide) require NAD+ and could overestimate APO866 efficacy compared with other assays that are independent of intracellular NAD+, such as annexin V–PI. Our study confirmed that low nanomolar levels of APO866 induced apoptosis in myeloma cells, as assessed by various assays including annexin V–PI flow cytometry, and effectively inhibited myeloma growth even in coculture with supporting osteoclasts. Recently, Cea et al. [10] demonstrated that APO866 induced autophagic, caspase-independent cell death in myeloma cells.
Our observation that NAD+ depletion markedly reduced PARP-1 activity strongly suggests that drugs such APO866 could be effective against myeloma cells that are resistant to drugs known to induce double-strand DNA breaks. PARP-1 expression is associated with poor survival in MM [31] and therefore APO866 might sensitize myeloma cells that express increased levels of PARP-1. Indeed, a recent study demonstrated the ability of APO866 to potentiate DNA damage induced by etoposide or cisplatin [32], both of which are routinely used clinically for MM.
Although the role of SIRT-1 in tumorigenesis remains to be determined and probably depends on tumor cell type and disease stage, the antimyeloma effects of APO866 were associated with reduced SIRT-1 activity in MM cell lines that are well transformed because of multiple genetics and epigenetic alterations, SIRT-l and SIRT-2 are class III HDACs that are not affected by antitumor HDAC inhibitors being developed mainly against class I, II, and IV of HDACs. Because increased DNA methylation is prevalent during the transition to progressive stages of MM [33], it is likely that SIRT-1 is hyperactivated and oncogenic at late stages of the disease.
In another aspect of our study, we looked at the effects of APO866 on osteoclast formation and activity. Mitochondria-abundant osteoclasts are hypermetabolic in nature because of the high energy demand for resorbing bone. Our observation that PBEF1 was also upregulated in osteoclasts after coculture with myeloma cells suggests that myeloma cells directly increase the life span and activity of bone-resorbing osteoclasts by upregulating factors such as PBEF1. We also found that high NAD content was required for osteoclast formation and that NAD+ depletion resulted in reduced NF-κB activity in these cells; however, the complete mechanisms and signaling involved in these effects remain to be elucidated.
In summary, we have demonstrated that PBEF1 is upregulated in myeloma cells and osteoclasts after coculture and that high NAD content is required for myeloma cell survival and growth and for induction of osteoclastogenesis. In MM cell lines, biosynthesis of NAD+ is mainly replenished through the nicotinamide pathway, because inhibition of PBEF1 activity by APO866 in MM cell lines markedly reduced NAD+ content, resulting in reduced PARP-1 and SIRT-1 activity, induction of apoptosis, and suppression of growth. APO866 is currently in phase II and I/II clinical trials in advanced melanoma (NCT00432107), cutaneous T cell lymphoma (NCT00431912), and B cell chronic lymphocytic leukemia (NCT00435084). Our findings suggest that targeting the NAD biosynthesis pathway with APO866 and other agents might benefit myeloma patients, particularly those with refractory disease whose myeloma cells express high levels of PBEF1.
Supplementary Material
Acknowledgments
This work was supported by National Cancer Institute grants CA093897 and CA55819 and by Senior and Translational Research Awards from the Multiple Myeloma Research Foundation (to S.Y.).
We wish to thank the faculty, staff, and patients of the Myeloma Institute for Research and Therapy for their support and the Office of Grants and Scientific Publications at the University of Arkansas for Medical Sciences for editorial assistance during preparation of this manuscript.
Footnotes
Author contributions: S.U.V. performed in vitro and in vivo studies, analyzed and interpreted the data, and wrote the paper; S.K., W.L., and R.B. performed cell culture and in vitro and in vivo studies; X.L. prepared luciferase/EGFP-expressing myeloma cells; J.E. performed myeloma cell–osteoclast cocultures and analyzed GEP data; B.B., F.v.R., and S.U. provided clinical specimens and clinical GEP data for the study; S.Y. designed and performed the research, conceptualized the work, analyzed and interpreted the data, and wrote the paper. S.Y. takes responsibility for the integrity of the data analysis.
Conflict of interest disclosure
No financial interest/relationships with financial interest relating to the topic of this article have been declared.
Supplementary data related to this article can be found online at http://dx.doi.org/10.10l6/j.exphem.2013.02.008.
References
- 1.Pollak N, Dolle C, Ziegler M. The power to reduce: pyridine nucleotides–small molecules with a multitude of functions. Biochem J. 2007;402:205–218. doi: 10.1042/BJ20061638. [DOI] [PMC free article] [PubMed] [Google Scholar]
- 2.Garten A, Petzold S, Korner A, et al. Nampt: linking NAD biology, metabolism and cancer. Trends Endocrinol Metab. 2009;20:130–138. doi: 10.1016/j.tem.2008.10.004. [DOI] [PMC free article] [PubMed] [Google Scholar]
- 3.Galli M, Van GF, Rongvaux A, et al. The nicotinamide phosphoribosyltransferase: a molecular link between metabolism, inflammation, and cancer. Cancer Res. 2010;70:8–11. doi: 10.1158/0008-5472.CAN-09-2465. [DOI] [PubMed] [Google Scholar]
- 4.Magni G, Amici A, Emanuelli M, et al. Enzymology of NAD+ homeostasis in man. Cell Mol Life Sci. 2004;61:19–34. doi: 10.1007/s00018-003-3161-1. [DOI] [PMC free article] [PubMed] [Google Scholar]
- 5.Busso N, Karababa M, Nobile M, et al. Pharmacological inhibition of nicotinamide phosphoribosyltransferase/visfatin enzymatic activity identifies a new inflammatory pathway linked to NAD. PLoS One. 2008;3:e2267. doi: 10.1371/journal.pone.0002267. [DOI] [PMC free article] [PubMed] [Google Scholar]
- 6.Hasmann M, Schemainda I. FK866, a highly specific noncompetitive inhibitor of nicotinamide phosphoribosyltransferase, represents a novel mechanism for induction of tumor cell apoptosis. Cancer Res. 2003;63:7436–7442. [PubMed] [Google Scholar]
- 7.Van GF, Galli M, Gueydan C, et al. Intracellular NAD levels regulate tumor necrosis factor protein synthesis in a sirtuin-dependent manner. Nat Med. 2009;15:206–210. doi: 10.1038/nm.1906. [DOI] [PMC free article] [PubMed] [Google Scholar]
- 8.Bruzzone S, Fruscione F, Morando S, et al. Catastrophic NAD+ depletion in activated T lymphocytes through Nampt inhibition reduces demyelination and disability in EAE. PLoS One. 2009;4:e7897. doi: 10.1371/journal.pone.0007897. [DOI] [PMC free article] [PubMed] [Google Scholar]
- 9.Nahimana A, Attinger A, Aubry D, et al. The NAD biosynthesis inhibitor APO866 has potent antitumor activity against hematologic malignancies. Blood. 2009;113:3276–3286. doi: 10.1182/blood-2008-08-173369. [DOI] [PubMed] [Google Scholar]
- 10.Cea M, Cagnetta A, Fulciniti M, et al. Targeting NAD+ salvage pathway induces autophagy in multiple myeloma cells via mTORC1 and extracellular signal-regulated kinase (ERK1/2) inhibition. Blood. 2012;120:3519–3529. doi: 10.1182/blood-2012-03-416776. [DOI] [PMC free article] [PubMed] [Google Scholar]
- 11.Bartel TB, Haessler J, Brown TL, et al. Fl8-fluorodeoxyglucose positron emission tomography in the context of other imaging techniques and prognostic factors in multiple myeloma. Blood. 2009;114:2068–2076. doi: 10.1182/blood-2009-03-213280. [DOI] [PMC free article] [PubMed] [Google Scholar]
- 12.Barlogie B, Crowley J. Could CR mean cure? Blood. 2011;l18:483. doi: 10.1182/blood-2011-05-350322. [DOI] [PubMed] [Google Scholar]
- 13.Waheed S, Mitchell A, Usmani S, et al. Standard and novel imaging methods for multiple myeloma: correlates with prognostic laboratory variables including gene expression profiling data. Haematologica. 2012;98:71–78. doi: 10.3324/haematol.2012.066555. [DOI] [PMC free article] [PubMed] [Google Scholar]
- 14.Yaccoby S. Advances in the understanding of myeloma bone disease and tumour growth. Br J Haematol. 2010;149:311–321. doi: 10.1111/j.1365-2141.2010.08141.x. [DOI] [PMC free article] [PubMed] [Google Scholar]
- 15.Yaccoby S, Wezeman MJ, Henderson A, et al. Cancer and the micro-environment: myeloma-osteoclast interactions as a model. Cancer Res. 2004;64:2016–2023. doi: 10.1158/0008-5472.can-03-1131. [DOI] [PubMed] [Google Scholar]
- 16.Yaccoby S. The phenotypic plasticity of myeloma plasma cells as expressed by dedifferentiation into an immature, resilient, and apoptosis-resistant phenotype. Clin Cancer Res. 2005;11:7599–7606. doi: 10.1158/1078-0432.CCR-05-0523. [DOI] [PMC free article] [PubMed] [Google Scholar]
- 17.Li X, Pennisi A, Zhan F, et al. Establishment and exploitation of hyperdiploid and non-hyperdiploid human myeloma cell lines. Br J Haematol. 2007;138:802–811. doi: 10.1111/j.1365-2141.2007.06742.x. [DOI] [PMC free article] [PubMed] [Google Scholar]
- 18.Zhan F, Huang Y, Colla S, et al. The molecular classification of multiple myeloma. Blood. 2006;108:2020–2028. doi: 10.1182/blood-2005-11-013458. [DOI] [PMC free article] [PubMed] [Google Scholar]
- 19.Yaccoby S, Wezeman MJ, Zangari M, et al. Inhibitory effects of osteoblasts and increased bone formation on myeloma in novel culture systems and a myelomatous mouse model. Haematologica. 2006;91:192–199. [PMC free article] [PubMed] [Google Scholar]
- 20.Yata K, Yaccoby S. The SCID-rab model: a novel in vivo system for primary human myeloma demonstrating growth of CD138-expressing malignant cells. Leukemia. 2004;18:1891–1897. doi: 10.1038/sj.leu.2403513. [DOI] [PubMed] [Google Scholar]
- 21.Yaccoby S, Barlogie B, Epstein J. Primary myeloma cells growing in SCID-hu mice: a model for studying the biology and treatment of myeloma and its manifestations. Blood. 1998;92:2908–2913. [PubMed] [Google Scholar]
- 22.Yaccoby S, Epstein J. The proliferative potential of myeloma plasma cells manifest in the SCID-hu host. Blood. 1999;94:3576–3582. [PubMed] [Google Scholar]
- 23.Yaccoby S, Ling W, Zhan F, et al. Antibody-based inhibition of DKK1 suppresses tumor-induced bone resorption and multiple myeloma growth in vivo. Blood. 2007;109:2106–2111. doi: 10.1182/blood-2006-09-047712. [DOI] [PMC free article] [PubMed] [Google Scholar]
- 24.Shaughnessy JD, Jr, Zhan F, Burington BE, et al. A validated gene expression model of high-risk multiple myeloma is delined by deregulated expression of genes mapping to chromosome 1. Blood. 2006;109:2276–2284. doi: 10.1182/blood-2006-07-038430. [DOI] [PubMed] [Google Scholar]
- 25.Schreiber V, Dantzer F, Ame JC, de MG. Poly(ADP-ribose): novel functions for an old molecule. Nat Rev Mol Cell Biol. 2006;7:517–528. doi: 10.1038/nrm1963. [DOI] [PubMed] [Google Scholar]
- 26.Jagtap P, Szabo C. Poly(ADP-ribose) polymerase and the therapeutic effects of its inhibitors. Nat Rev Drug Discov. 2005;4:421–440. doi: 10.1038/nrd1718. [DOI] [PubMed] [Google Scholar]
- 27.Schwer B, Verdin E. Conserved metabolic regulatory functions of sirtuins. Cell Metab. 2008;7:104–112. doi: 10.1016/j.cmet.2007.11.006. [DOI] [PubMed] [Google Scholar]
- 28.Pennisi A, Li X, Ling W, et al. The proteasome inhibitor, bortezomib suppresses primary myeloma and stimulates bone formation in myelomatous and nonmyelomatous bones in vivo. Am J Hematol. 2009;84:6–14. doi: 10.1002/ajh.21310. [DOI] [PMC free article] [PubMed] [Google Scholar]
- 29.Kim EJ, Um SJ. SIRT1: roles in aging and cancer. BMB Rep. 2008;41:751–756. doi: 10.5483/bmbrep.2008.41.11.751. [DOI] [PubMed] [Google Scholar]
- 30.Imai S. The NAD World: A new systemic regulatory network for metabolism and aging–Sirt1, systemic NAD biosynthesis, and their importance. Cell Biochem Biophys. 2009;53:65–74. doi: 10.1007/s12013-008-9041-4. [DOI] [PMC free article] [PubMed] [Google Scholar]
- 31.Neri P, Ren L, Gratton K, et al. Bortezomib-induced “BRCAness” sensitizes multiple myeloma cells to PARP inhibitors. Blood. 2011;118:6368–6379. doi: 10.1182/blood-2011-06-363911. [DOI] [PMC free article] [PubMed] [Google Scholar]
- 32.Travelli C, Drago V, Maldi E, et al. Reciprocal potentiation of the anti-tumoral activities of FK866, an inhibitor of nicotinamide phosphoribosyltransferase, and etoposide or cisplatin in neuroblastoma cells. J Pharmacol Exp Ther. 2011;338:829–840. doi: 10.1124/jpet.111.184630. [DOI] [PubMed] [Google Scholar]
- 33.Walker BA, Wardell CP, Chiecchio L, et al. Aberrant global methylation patterns affect the molecular pathogenesis and prognosis of multiple myeloma. Blood. 2011;117:553–562. doi: 10.1182/blood-2010-04-279539. [DOI] [PubMed] [Google Scholar]
Associated Data
This section collects any data citations, data availability statements, or supplementary materials included in this article.


