

Abstract
Sleep and behavioral monitoring of young mice is necessary for understating the progress of symptoms in congenital and acquired diseases associated with sleep and movement disorders. In the current study, we have developed a non-invasive sleep monitoring system that identifies wake and sleep patternsof newborn mice using a simple piezoelectric transducer (PZT). Using this system, we have succeeded in detecting age-dependent occurrences and changes in sleep fragmentation of orexin/ataxin-3 narcoleptic mice (a narcoleptic mouse model of postnatal hypocretin/orexin cell death) across the disease onset. We also detected REM sleep/cataplexy patterns (i.e., immobility with clear heartbeat [IMHB] signals due to the flaccid posture) by the PZT system, and found that sudden onset of REM sleep-like episodes specifically occur in narcoleptic, but not in wild type mice, suggesting that these episodes are likely cataplexy. In contrast, gradual onset of IMHB likely reflects occurrence of REM sleep.
In summary, we have shown that the PZT system is useful as a non-invasive sleep and behavior monitoring system to analyze the developmental aspects of sleep and movement disorders in mice models.
Keywords: Narcolepsy, Hypocretin/orexin, Cataplexy, Piezoelectric system, REM sleep, Mice, Disease onset
Introduction
Narcolepsy is characterized by excessive daytime sleepiness, a fragmented sleep/wake pattern, cataplexy and other dissociated manifestations of REM sleep (Nishino and Mignot, 1997; Scammell, 2003). In a narcoleptic mouse model (i.e., orexin/ataxin-3 transgenic [TG] mice), its pathophysiology and sleep and behavioral phenotype are similar to those of human narcolepsy (Hara et al., 2001). In this model, a toxic transgene derived from an ataxin-3 human gene mutation (from a patient with Machado–Joseph disease) was driven by the preprohypocretin promoter, resulting in narcoleptic mice lacking hypocretin-containing neurons (Hara et al., 2001). Hypocretin-containing neurons in TG mice are selectively ablated postnatally, and over 99% of them are lost by 84 days, and sleep/wake fragmentation and cataplexy are observed in adult mice (Hara et al., 2001). These symptoms likely occur with progressions of hypocretin-containing neuron loss in these mice. However, the onset of sleep fragmentation and cataplexy in these mice has not been systematically evaluated, because the symptoms likely start at an early postnatal period. This missing information is critical in understanding pathophysiological mechanisms for sleep abnormalities and for clinical interventions in hypocretin-ligand deficient narcolepsy.
Most researchers are now studying mouse models of sleep disorders by monitoring mice with a variety of devices such as electrodes for electroencephalogram (EEG), electromyogram (EMG), and implantable transmitters for EEG, body temperature and locomotor activity measures (Fujiki et al., 2009; Okuro et al., 2010). Although these EEG-based sleep analyses are informative, they require surgical implantations of devices, and therefore possible interferences from the surgical stress and behavioral restrictions, such as from connecting cables, cannot be completely excluded from the analysis. In addition, it is difficult to perform operations in small mice especially during the early postnatal period.
Recently, several researchers demonstrated the use of a non-invasive piezoelectric (PZT) system for monitoring sleep and other physiological signals (Flores et al., 2007; Sato, 2008; Sato et al., 2006; Zehendner et al., 2013). The PZT sensor can detect movements that mostly occur during the wake period and resting states that mostly occur during the sleep period. These characteristics have been used for automatic detection of wake and sleep patterns in mice (Flores et al., 2007). By filtering the raw signal which is a mixed component of various biosignals, the device can also detect heartbeats and respiratory sounds, together with movements and convert them into an electrical signal using a custom-designed analog circuitry and a microprocessor program (see (Sato et al., 2006)). With this device, non-invasive measurement of these signals is accomplished simply by putting a mouse on the sensor of the PZT system.
Since PZT recording is non-invasive, we were able to longitudinally monitor the sleep of narcoleptic mice from 2 weeks old and examined the sleep changes across the onset of disease. We also tried to identify the PZT signal corresponding to cataplexy in these mice, and monitored the occurrences of this phenomenon during the progressional loss of hypocretin containing neurons.
Materials and methods
Animals
Six hypocretin/ataxin-3 transgenic (TG) narcoleptic mice from the congenic line (N13-15, backcrossed to C57BL/6) and 6 respective wild type (WT) littermates were used. We also collected the sleep EEG and PZT signals simultaneously in 4 WT mice (a total of 8999 ten-second epochs for 4 mice) and used this to analyze the agreement of the auto-PZT sleep/wake scoring with EEG/EMG-based sleep/wake scoring and the viability for using the PZT system to detect REM sleep. In a separate session, 6 TG narcoleptic mice were videotaped to evaluate the sensitivity of the PZT system to detect cataplexy-like behavior in narcoleptic mice. Mice were maintained on a stable light cycle of 12 hour light and 12 hour dark (LD 12:12). Room temperature was maintained at 24 ± 1 °C throughout experimentation. The study was approved by and conducted in accordance with the guidelines of Stanford University Administrative Panel on Laboratory Animal Care and the Akita University Institutional Committee for Animal Studies.
PZT data collection
The PZT system (ATC-402, Unique Medical Co., Ltd, Tokyo, Japan) consists of a cage and a floor equipped with a heater. The PZT-sensor was used for sleep monitoring (Figs. 1A–D). The PZT sensor consists of an upper sensor plate (95 × 165 mm) and a lower heater plate, which were combined with 6 small spacers (5 mm tall) placed around the corners of the plates. The sensor plate was made of a 3-mm thick aluminum plate and had a PZT element [disk shaped, 27-mm outer diameter (OD), EE27A-39A, FDK Corporation, Tokyo, Japan], which was adhered to the undersurface of the plate. The PZT surface temperature was set at 31.0 ± 0.5 °C by controlling the heater plate. PZT signals were amplified with a DC amplifier (0–10 kHz) and stored by using the data acquisition software developed by one of the authors (NH) via an AD converter (ADA16-32/2(CB)F; CONTEC Co., Ltd., Osaka, Japan) at a sampling rate of 512 Hz. The heartbeat signals were analyzed using the output signal with high pass (280 Hz) and low pass (1 kHz) filters equipped in ATC-402.
Fig. 1.
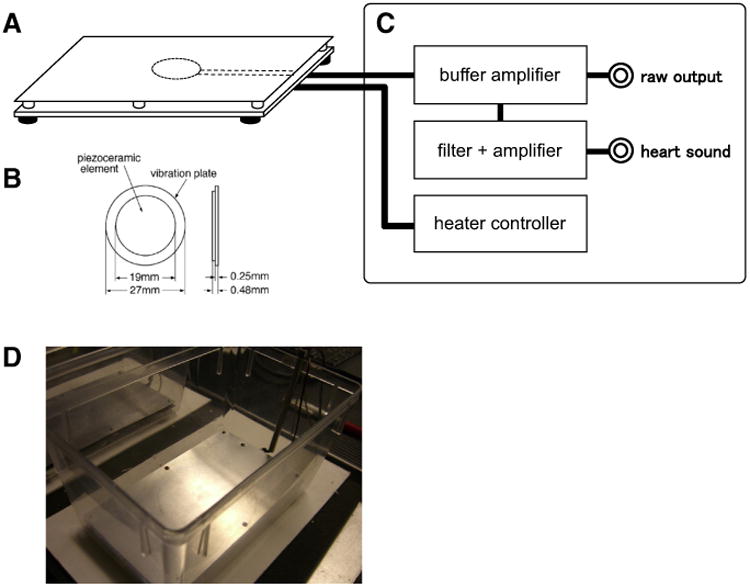
Piezoelectric transducer (PZT) system. A: Sensor device, B: piezoelectric (PZT) element, C: the main unit, and D: appearance of the cage with a PZT sensor.
Mice were placed on the PZT-sensor for 3 h during the light period (from zeitgeber time [ZT] 2 to 5). For the developmental experiments, the recordings of the mice were repeated on 14, 28, 56, 84 and 98 days after birth.
Surgery for simultaneous EEG and PZT sleep recording
In a separate session, we also recorded the EEG sleep and PZT signals simultaneously using 4 WT mice. The mice were surgically prepared for EEG and EMG recordings with a headstage attached to a cable recorder (Fujiki et al., 2009). Under 3% isoflurane anesthesia, 2 of 4 electrodes for the EEG (stainless steel screws) were screwed into the skull 1.5 mm lateral and 1.5 mm anterior to the bregma (over the motor cortex); the other 2 were screwed 3 mm lateral and 1 mm anterior to the lambda (over the visual cortex), and 2 EMG electrodes (multistranded stainless steel wires) were inserted into the neck extensor muscle. The 6 leads for these electrodes were attached to one 2 × 3 pin header that was secured to the skull using dental acrylic.
After surgery, surgical wounds, animal behaviors, and body weight were monitored, with an analgesic (carprofen) and an antibiotic (enrofloxacin) supplied as needed. Mice were allowed to fully recover for a minimum of 2 weeks before the experiments.
Simultaneous EEG and PZT data collection
After 2 weeks of recovery period from the surgery, the mice were moved to the PZT system covered with a specially modified Nalgene microisolator cage equipped with a low-torque slip-ring commutator (Biella Engineering, Irvine, CA), and the cage was placed in the PZT-equipped recording chamber. The headstage of the animal was connected to a slip ring commutator through 15 to 20 cm of a lightweight 6-strand shielded signal cable (NMUF6/30-4046SJ; Cooner Wire, Chatsworth, CA). The commutator output was connected to the amplifier. The animals were allowed full freedom of movement in the recording cages. The EEG–EMG signals were acquired using Grass Instruments (West Warwick, RI) model 12 amplifiers. The EEG and EMG signals, digitally filtered (30 Hz low pass filter for EEG; 10–100 Hz band pass filter for EMG), were captured at 256 Hz using the data acquisition software developed by one of the authors (NH). EEG signals collected with ipsilateral bipolar EEG electrodes placed over motor and visual cortices together with the bipolar EMG signals were used for sleep scoring. We started the experiment at ZT = 2 and recorded the data for 6–7 h for each animal and the total recording time was 25 h (8999 ten-second epochs).
Sleep scoring by PZT signals
First, the whole recorded signals were statistically analyzed, which yielded the averaged levels and the standard deviations. Subsequently, the absolute value of the difference from the averaged level was examined on each sampled data of every one second epoch. The epoch was marked as wake when the signal amplitude exceeded one standard deviation from the mean calculated from the whole recorded signal (Fig. 2A). The period between wake epochs was considered as resting (wake without movement) and also marked as wake when the period length was less than 20 s. After that, the consecutive epochs with the same state were chosen as a single bout. Wake bouts of less than 10 s were considered as noise or immature, transitional states and therefore were marked as a continuous sleep bout. Lastly, all the one-second epochs were cast into 10-second epochs for comparison with the visual score by the human scorer. Each 10-second epoch was marked as wake when it contained five or more one-second wake epochs.
Fig. 2.
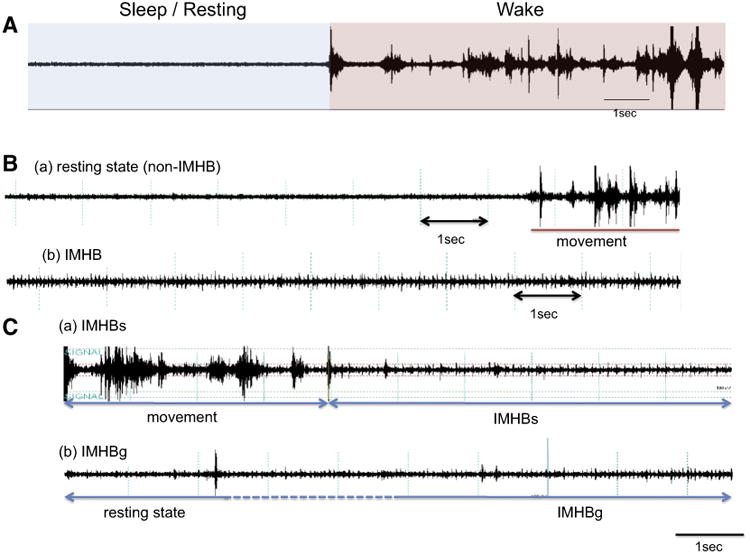
Piezoelectric (PZT) signals. A: Large amplitude signals appear during movement (wake) while very little amplitude appears during rest (sleep). B: Both (a) ordinary resting (non-IMHB) and (b) IMHB show lower amplitude than movement period but IMHB is characterized by the appearance of heartbeat (heart sound) signals. C: (a) IMHBs: Sudden onset and large movement followed by IMHB. No fewer than 40 s of movement period must exist before IMHBs. (b) IMHBg: Gradual onset IMHB. Fewer than 40 s of movement period before IMHBg.
Sleep scoring by sleep polygraph signals
We visually scored the sleep stages based on EEG and EMG signals in 10-second epochs using our standard scoring criteria using SleepSign (Kissei America, Irvine, CA, USA). Fifty percent or more of a particular state in each epoch is required to score the epoch as that state. Briefly, wakefulness is characterized by a desynchronized, low-amplitude, mixed-frequency (>4 Hz) EEG and high EMG activity. Rhythmic theta/ alpha (7–9 Hz) waves with high EMG activities may also appear. NREM is characterized by a synchronized, high-amplitude, low-frequency (0.25–4 Hz) EEG and reduced EMG activity compared to wakefulness. EEG activity in REM sleep is similar to that in wakefulness with desynchronized, mixed-frequency, low-amplitude waves. EMG activity during REM sleep is reduced even further than that during NREM and is completely absent in many cases. Some muscle twitching may be apparent in the EMG trace during REM sleep. During the REM sleep, rhythmic theta/alpha (7–9 Hz) waves with reduced EMG activity may be dominant, but not necessarily, as has been shown in other species (Kushida et al., 1985; Rechtschaffen and K.A., 1968). Sleep state changes were recorded when at least one 10-second epoch was scored as having a different sleep stage, and state episode length was defined as the length of a continuous single state episode. All scoring was done by a single investigator (YS), blind to the animal information.
To determine the concordance rate of the result of the autoscored PZT signal and that of manually scored EEG, we collected the EEG sleep and PZT signals simultaneously in 4 WT mice.
Immobile with heartbeat (IMHB) signal analysis
Since PZT is very sensitive in detecting movements, we tried to identify the PZT signals corresponding to cataplexy. We observed that resting (sleep) PZT patterns most often occur during behavioral cataplexy, and more systematically examined resting (sleep) PZT periods, in relation to cataplexy. We found two different patterns of PZT signals during resting (sleep) periods. One is an ordinary resting pattern (Fig. 2B(a)), while the other is a unique PZT signal pattern characterized by no movement signal (resting), but with clear heartbeat signals (Fig. 2B(b)). We named the latter pattern as “episodes of immobility with heartbeat (IMHB) signal”. Heartbeat signals can be detected when a mouse is flaccid and a larger part of the body is closely attached to the floor (i.e., PZT sensor). We therefore created manual scoring criteria for IMHB and scored IMHB episodes and recorded the start and the end time of each IMHB episode. The data was used to calculate the frequency of appearance and distribution of IMHB across ages and between genotypes. All scoring was done blind to the genotype information.
Scoring criteria for IMHB and IMHB subtypes
Resting state is defined as the state with lower PZT signal power than that for movement state (see the Sleep scoring by PZT signals section). IMHB signals are characterized by the appearance of heartbeat signals, and the amplitudes of heartbeat signals are more than twice as large as the resting PZT signals. Heartbeat signals (the combination of S1 and S2 heart sounds) appear at a rate of 8–12 beats per second (480–720 bpm).
IMHB signals are divided into a gradual onset type (IMHBg) and a sudden onset type (IMHBs, wake preceding 40 s) (Fig. 2C(a)). Consistent with the definition of direct transitions from wakefulness to REM sleep (DREM) (Fujiki et al., 2009), PZT signals show no fewer than 40 s of movement period before IMHBs. On the other hand, IMHBg is defined as the gradual onset of IMHB (Fig. 2C(b)). Less than 40 s of movement period is followed by IMHBg.
Video monitoring of behavioral cataplexy and IMHBs
To evaluate the sensitivity for detecting behavioral cataplexy using the PZT system, the mice were videotaped simultaneously with the PZT recording for 4 h. All instances of behavioral cataplexy were recorded by video monitoring (by SK). Cataplexy was defined as a sudden onset of behavioral arrest or muscle atonia. Each instance was considered a case of behavioral cataplexy if the mouse showed at least 5 s of no movement, and the starting and the ending time of each episode were recorded. The mouse occasionally moved during cataplexy, and if such motion lasted for less than 10 s, we recorded the episode as a single bout. In the second half of the process, we visually scored PZT signals for each cataplexy episode (as IMHBg, IMHBs and non-IMHB) and calculated the sensitivity to detect behavioral cataplexy using the PZT signals (i.e. IMHBs). Moving was defined as episodes with large movement signals, and resting was defined as episodes with no movement that do not meet the IMHB scoring criteria. When longer than 5 s IMHBs episodes appeared during a single cataplexy episode, we assumed that cataplexy was detected by IMHBs.
Sensitivity and specificity of IMHBg for REM sleep detection
To evaluate the specificity and sensitivity for detecting REM sleep using the PZT system, the PZT signals of 4 WT mice in each 10-second epoch were (a total of 8999 epochs for 4 mice) visually classified into IMHBg, IMHBs and non-IMHB. These data were compared to EEG scoring results to obtain sensitivity and specificity values in detecting REM sleep by IMHBg.
Statistical analyses
Statistical significances of the wake and sleep amounts and the wake and sleep bout length in narcoleptic and WT mice were evaluated using a two-way analysis of variance (ANOVA) with genotype and age as the independent variables. The frequency of appearance and distribution of IMHB across ages and between genotypes were evaluated using the Kolmogorov–Smirnov (K–S) test for the distribution and the Wilcoxon test for the mean duration. Differences were considered to be significant when p < 0.05.
Results
Agreement between PZT and EEG based sleep scoring
To determine whether the PZT sleep scoring agrees with the EEG-based sleep scoring, we first evaluated the concordance rate of the autoscored PZT signal and that of manually scored EEG. The number of epochs of the vigilance state scored by PZT and polygraph signals is shown in Table 1. Since the PZT autoscoring did not distinguish REM and NREM sleep, the REM and NREM sleep epoch numbers were only listed for EEG-based scoring. The reliability of the PZT scorings for wake/sleep was calculated as EEG-based wake/sleep epochs divided by PZT-based wake/sleep epochs. The detection rates of the PZT scorings for wake and sleep patterns are 74.5% and 70.3% respectively. In the PZT-based scoring, 48.9% of REM sleep was scored as “Sleep”, while 73% of NREM was scored as “Sleep”, indicating that about half of REM sleep epochs were mislabeled as “Wake”. Overall, the agreement of the result of the autoscored PZT signal and that of manually scored EEG (percentage of total epochs scored correctly) was 73.1%.
Table 1.
The result of agreement of auto scoring.
| PZT-based scoring (10 s epochs) | Totals | Detection rate (%) | |||
|---|---|---|---|---|---|
|
| |||||
| Wake | Sleep | ||||
| EEG-based scoring (10 s epochs) | Wake | 4366 | 1493 | 5859 | 74.5 |
| Sleep | 932 | 2208 | 3140 | 70.3 | |
| REM | 178 | 170 | 348 | 48.9 | |
| NREM | 754 | 2038 | 2792 | 73 | |
| Totals | 5298 | 3701 | 8999 | 73.1* | |
The agreement of the result of autoscored PZT signal and that of manually scored EEG (percentage of total epochs scored correctly) was 73.1%.
Developmental changes in wake/sleep amounts and bout length
In order to evaluate if our PZT scoring can detect sleep abnormalities and their onset in the narcoleptic mice, we calculated the wake/sleep amounts and wake/sleep bout lengths across the disease onset.
There was no significant difference in the sleep and wake amounts between TG narcoleptic and WT mice, nor age-dependent changes in these parameters (Fig. 3), although modest decreases in sleep amounts and increases in wake amounts were observed in WT in P84 and P98 (73.4% in P84, 87.1% in P98 for sleep and 138% in P84, 123% in P98 for wake from respective P14 amounts). In contrast, we found that the sleep bout length in TG narcoleptic mice decreased significantly with age (72.9%, p < 0.05 for 84 day, 66.1%, p < 0.01 for 98 day old mice) (Fig. 4), while no age-dependent change was observed in WT mice. As a result, significant differences in sleep bout length between the genotypes were observed when the mice were 84 days old (p < 0.05 for 84 and 98 day old mice). On the other hand, no significant decline in wake bout length was observed in TG mice.
Fig. 3.

Developmental changes of the amount of sleep and wake in WT and TG narcoleptic mice. There was no significant difference in the sleep and wake amounts between TG narcoleptic and WT mice, nor observed age-dependent changes in these parameters, although modest decreases in sleep amounts and increases in wake amounts were observed in WT in P84 and P98. Amount of sleep: genotype effect (p = 0.076), age effect (p = 0.360), and genotype × age interaction (p = 0.473). Amount of wake: genotype effect (p = 0.316), age effect (p = 0.187), and genotype × age interaction (p = 0.797).
Fig. 4.

Developmental changes of sleep and wake bouts in WT and TG mice. Sleep bout length in TG narcoleptic mice decreased significantly with age (*p < 0.05 for 84 day, **p < 0.01 for 98 day old mice), while no age-dependent change was observed in WT mice. Significant differences in sleep bout length between the genotypes were observed after 84 daysold(★p < 0.05 for 84 and 98 day old mice). No significant decline in wake bout length was observed in TG mice. Sleep bouts: genotype effect (p < 0.001), age effect (p = 0.164), and genotype × age interaction (p = 0.243). Wake bouts: genotype effect (p = 0.151), age effect (p = 0.223), and genotype × age interaction (p = 0.999).
IMHB characteristics between genotypes
A total of 173 IMHB signals were observed in WT and TG mice, including 105 IMHBs and 68 IMHBg (Figs. 5A, B, C, Table 2). The mean duration of IMHBs is significantly shorter than that of IMHBg (11.8 vs. 45.5 s, p < 0.001). It should be noted that IMHBs signals were observed in the TG narcoleptic mice specifically (104 in TG vs. 1 in WT) (Figs. 5D, E, Table 2), while IMHBg signals were observed in both WT and TG nar-coleptic mice at a similar frequency (37 in TG vs. 31 in WT, p = 0.131) (Figs. 5F, G, Table 2). The IMHBs signals were observed as early as in 14 days old in TG narcoleptic mice and the frequency of IMHBs increased with age and reached a plateau after 84 days (Fig. 6).
Fig. 5.

Frequency distribution of IMHB (total), IMHBs and IMHBg. There was a different distribution between IMHBs and IMHBg, and the duration of the most of IMHBs is short and is less than 56.1 s. Almost all IMHBs were observed in narcoleptic TG mice (TG:WT = 104:1), while IMHBg signals were observed similarly in TG and WT mice (p = 0.131 by K–S test).
Table 2.
IMHB characteristics between genotypes.
| Number | Max (s) | Min (s) | Meana (s) | |
|---|---|---|---|---|
| IMHB | 173 | 139 | 2 | 25.0 ± 2.1 |
| IMHBs | 105 | 56.1 | 2 | 11.8 ± 2.3 |
| IMHBg | 68 | 139 | 8.9 | 45.5 ± 4.0 |
| IMHBs | 105 | 56.1 | 2 | 11.8 ± 2.3 |
| IMHBs-TG | 104 (99%) | 56.1 | 2 | 11.9 ± 2.3 |
| IMHBs-WT | 1 (1%) | 8.9 | 8.9 | 8.9 |
| IMHBg | 68 | 139 | 8.9 | 45.5 ± 4.0 |
| IMHBg-TG | 37 (54%) | 107 | 8.9 | 45.6 ± 4.7 |
| IMHBg-WT | 31 (46%) | 139 | 9 | 45.3 ± 6.9 |
Mean ± SEM.
Fig. 6.
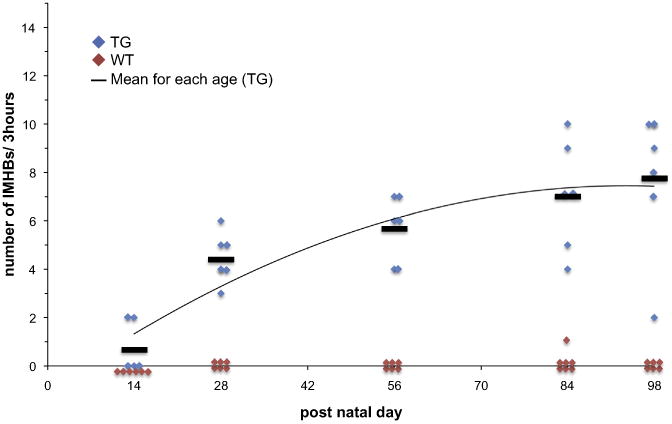
Developmental changes in the number of appearance of IMHBs. The IMHBs signals were observed as early as 14 days old in TG narcoleptic mice and the frequency of IMHBs increased with age and reached a plateau after 84 days.
Sensitivity of IMHBs for detecting cataplexy
We have recorded 85 cataplexy episodes from 6 narcoleptic mice, and 71 episodes were scored as IMHBs, 11 episodes were scored as IMHBg and 3 episodes were classified as non-IMHB. Therefore, the sensitivity to detect cataplexy with IMHBs was 83.5%.
Sensitivity and specificity for detecting REM sleep
A total of 348 REM sleep epochs, 2792 NREM sleep epochs, and 5859 wake epochs were observed, and 236 (out of 348) REM sleep epochs were scored as IMHBg, indicating 67.8% sensitivity to detect EEG-based REM sleep. 307 (out of 5859) wake epochs and 316 (out of 2792) NREM epochs were also scored as IMHBg, indicating 92.8% specificity.
Discussion
In this study, we developed an automated sleep scoring system in mice using non-invasive PZT signals with a simple algorithm. Since the mice are simply placed on the PZT system equipped with the recording device on the floor, the system allows us to monitor sleep/ wake patterns in the mice repeatedly from the early postnatal period. With this device, we were, for the first time, able to detect the sleep fragmentation in TG narcoleptic mice during the progressive loss of hypocretin-containing neurons.
Hara and her colleagues reported that hypocretin neurons in TG narcoleptic mice are genetically ablated and lost by 84 days of age, and the mice develop sleep/wake fragmentation and cataplexy thereafter (Hara et al., 2001). Other authors demonstrated that wake and sleep fragmentation is one of the major characteristics of sleep abnormalities seen in adult narcoleptic mice (Fujiki et al., 2009; Hara et al., 2001; Zhang et al., 2007). However, to our knowledge, no prior studies have examined when and how these sleep symptoms develop.
Using PZT, we found that the sleep bouts in TG mice shortened from P28 gradually in an age-dependent manner. The significant decrease of the sleep bout lengths from those at P14 appeared at 84 and 98 days (72.9% in P84 and 66.1% in P98 from the respective P14 bout lengths).
However, our result did not show the significant decrease in the wake bout lengths (Fig. 4). This is possibly due to the time of the day of the recordings (light periods), as our previous EEG sleep recordings did not find significant wake-fragmentation during light periods (Fujiki et al., 2009; Zhang et al., 2007). It is also possible that our criteria may not be sensitive enough to detect wake-fragmentation as brief movement episodes (less than 10 s) when sleep were scored as a continuous sleep bout.
We did not observe significant changes in sleep and wake amounts between genotypes, although modest decreases in sleep and increases in wake amounts were seen in aged WT mice, suggesting that hypocretin neuronal loss may not affect sleep/wake amounts significantly. However, limitations in recording conditions, such as short recording hours (3 h per day), should also be considered.
Cataplexy is another key symptom, associated with hypocretin deficiency, but its onset and progress were not known in relation to hypocretin neuronal loss. Cataplexy monitoring, either by video or EEG (i.e., DREM), is difficult to carry out in young mice, and no data are also available about the onset of cataplexy in these narcoleptic mice. In this study, we also tried to identify cataplexy using non-invasive PZT signals. We found two IMHB patterns, namely IMHBs and IMHBg when mice are immobile and flaccid. We found that IMHBs specifically reflects the sudden onset of resting periods with muscle flaccidness specifically occurring in TG narcoleptic mice (92.8% specificity). We also evaluated sensitivity to detect cataplexy by IMHBs, and this was 83.5%. Several authors had reported that cataplexy mostly occurs during dark (active) periods (Fujiki et al., 2009; Scammell et al., 2009), but others also reported that cataplexy can occur even in resting period when mice are stimulated by wolf urine (Shiromani, personal communication), and we think that cataplexy can be induced sufficiently in a new environment during resting period (i.e., after acutely moved to the PZT recording cage). IMHBs signals were observed as early as 14 days in TG narcoleptic mice and the frequency of IMHBs increased with age and reached a plateau after 84 days of age, suggesting that cataplexy occurrences progress (with sleep fragmentation) as the hypocretin neuronal loss progresses (see (Hara et al., 2001)).
Since IMHBg occurred in both WT and narcoleptic TG mice when they are immobile and body muscle was flaccid, IMHBg may reflect the occurrences of REM sleep. We therefore analyzed the specificity and sensitivity for detecting REM sleep by IMHBg PZT patterns, and found that specificity was high and was 92.8%, but the sensitivity was modest and was 67.8%. Several researchers demonstrated that the PZT system can also detect signals from the chest and abdominal movements related to respiration (Flores et al., 2007; Sato et al., 2006; Zehendner et al., 2013) in addition to heartbeat sounds. These signals may also be included into the sleep scoring to improve REM sleep detection because significant fluctuations of these parameters are known to occur in REM sleep (Sato et al., 2010).
In summary, we have shown that the PZT system is useful as a noninvasive sleep and behavior monitoring system, as we successfully detected the progresses in sleep fragmentation in narcoleptic mice. The PZT system can be used as a novel sleep experimental method to analyze the sleep development or pathogenesis/course of sleep disorders since even newborn mice can be monitored non-invasively (see (Sato, 2008)). Successful detection of cataplexy in narcoleptic mice in our study also suggests that the PZT system is useful for understanding the development of movement and REM sleep behavior disorders, such as mouse models of Parkinson's disease and myotonic dystrophy, as well as for the aspects related to the sleep–wake alterations in these diseases.
Acknowledgments
This research was supported by the NIH grant R21 NS072942. The authors thank Ms. Mari Matsumura for editing the manuscript.
References
- Flores AE, Flores JE, Deshpande H, Picazo JA, Xie XS, Franken P, Heller HC, Grahn DA, O'Hara BF. Pattern recognition of sleep in rodents using piezoelectric signals generated by gross body movements. IEEE Trans Biomed Eng. 2007;54:225–233. doi: 10.1109/TBME.2006.886938. [DOI] [PubMed] [Google Scholar]
- Fujiki N, Cheng T, Yoshino F, Nishino S. Specificity of direct transition from wake to REM sleep in orexin/ataxin-3 transgenic narcoleptic mice. Exp Neurol. 2009;217:46–54. doi: 10.1016/j.expneurol.2009.01.015. [DOI] [PMC free article] [PubMed] [Google Scholar]
- Hara J, Beuckmann CT, Nambu T, Willie JT, Chemelli RM, Sinton CM, Sugiyama F, Yagami K, Goto K, Yanagisawa M, Sakurai T. Genetic ablation of orexin neurons in mice results in narcolepsy, hypophagia, and obesity. Neuron. 2001;30:345–354. doi: 10.1016/s0896-6273(01)00293-8. [DOI] [PubMed] [Google Scholar]
- Kushida CA, Baker TL, Dement WC. Electroencephalographic correlates of cataplectic attacks in narcoleptic canines. Electroencephalogr Clin Neurophysiol. 1985;61:61–70. doi: 10.1016/0013-4694(85)91073-9. [DOI] [PubMed] [Google Scholar]
- Nishino S, Mignot E. Pharmacological aspects of human and canine narcolepsy. Prog Neurobiol. 1997;52:27–78. doi: 10.1016/s0301-0082(96)00070-6. [DOI] [PubMed] [Google Scholar]
- Okuro M, Fujiki N, Kotorii N, Ishimaru Y, Sokoloff P, Nishino S. Effects of paraxanthine and caffeine on sleep, locomotor activity, and body temperature in orexin/ataxin-3 transgenic narcoleptic mice. Sleep. 2010;33:930–942. doi: 10.1093/sleep/33.7.930. [DOI] [PMC free article] [PubMed] [Google Scholar]
- Rechtschaffen A, K A. A Manual of Standardized Terminology, Techniques, and Scoring System for Sleep Stages of Human Subjects. National Institutes of Health; Washington, D.C: 1968. [Google Scholar]
- Sato S. Quantitative evaluation of ontogenetic change in heart rate and its autonomic regulation in newborn mice with the use of a noninvasive piezoelectric sensor. Am J Physiol Heart Circ Physiol. 2008;294:H1708–H1715. doi: 10.1152/ajpheart.01122.2007. [DOI] [PubMed] [Google Scholar]
- Sato S, Yamada K, Inagaki N. System for simultaneously monitoring heart and breathing rate in mice using a piezoelectric transducer. Med Biol Eng Comput. 2006;44:353–362. doi: 10.1007/s11517-006-0047-z. [DOI] [PubMed] [Google Scholar]
- Sato S, Kanbayashi T, Kondo H, Matsubuchi N, Ono K, Shimizu T. Rapid increase to double breathing rate appears during REM sleep in synchrony with REM – a higher CNS control of breathing? Adv Exp Med Biol. 2010;669:249–252. doi: 10.1007/978-1-4419-5692-7_50. [DOI] [PubMed] [Google Scholar]
- Scammell TE. The neurobiology, diagnosis, and treatment of narcolepsy. Ann Neurol. 2003;53:154–166. doi: 10.1002/ana.10444. [DOI] [PubMed] [Google Scholar]
- Scammell TE, Willie JT, Guilleminault C, Siegel JM International Working Group on Rodent Models of, N. A consensus definition of cataplexy in mouse models of narcolepsy. Sleep. 2009;32:111–116. [PMC free article] [PubMed] [Google Scholar]
- Zehendner CM, Luhmann HJ, Yang JW. A simple and novel method to monitor breathing and heart rate inawake and urethane-anesthetized newborn rodents. PLoS One. 2013;8:e62628. doi: 10.1371/journal.pone.0062628. [DOI] [PMC free article] [PubMed] [Google Scholar]
- Zhang S, Zeitzer JM, Sakurai T, Nishino S, Mignot E. Sleep/wake fragmentation disrupts metabolism in a mouse model of narcolepsy. J Physiol. 2007;581:649–663. doi: 10.1113/jphysiol.2007.129510. [DOI] [PMC free article] [PubMed] [Google Scholar]