

Abstract
Background
Pediatric low-grade gliomas (PLGGs), the most frequent pediatric brain tumor, comprise a heterogeneous group of diseases. Recent genomic analyses suggest that these tumors are mostly driven by mitogene-activated protein kinase (MAPK) pathway alterations. However, little is known about the molecular characteristics inherent to their clinical and histological heterogeneity.
Methods
We performed gene expression profiling on 151 paraffin-embedded PLGGs from different locations, ages, and histologies. Using unsupervised and supervised analyses, we compared molecular features with age, location, histology, and BRAF genomic status. We compared molecular differences with normal pediatric brain expression profiles to observe whether those patterns were mirrored in normal brain.
Results
Unsupervised clustering distinguished 3 molecular groups that correlated with location in the brain and histological subtype. “Not otherwise specified” (NOS) tumors did not constitute a unified class. Supratentorial pilocytic astrocytomas (PAs) were significantly enriched with genes involved in pathways related to inflammatory activity compared with infratentorial tumors. Differences based on tumor location were not mirrored in location-dependent differences in expression within normal brain tissue. We identified significant differences between supratentorial PAs and diffuse astrocytomas as well as between supratentorial PAs and dysembryoplastic neuroepithelial tumors but not between supratentorial PAs and gangliogliomas. Similar expression patterns were observed between childhood and adolescent PAs. We identified differences between BRAF-duplicated and V600E-mutated tumors but not between primary and recurrent PLGGs.
Conclusion
Expression profiling of PLGGs reveals significant differences associated with tumor location, histology, and BRAF genomic status. Supratentorial PAs, in particular, are enriched in inflammatory pathways that appear to be tumor-related.
Keywords: BRAF duplication, BRAF mutation, expression, heterogeneity, pediatric low-grade glioma
Pediatric low-grade gliomas (PLGGs), classified as WHO grade I-II, are the most common brain tumors in children. They encompass more than 15 histological subtypes based on morphological features and the dominant cell type,1 but subtype classification is often poorly reproducible.2,3 Indeed, many PLGGs, often called low-grade glioma not otherwise specified (LGG NOS), remain unclassified.
The discovery of recurrent BRAF, FGFR1, NTRK2, and MYB/MYBL1 genetic alterations in PLGGs has significantly increased our understanding of the mechanisms behind tumorigenesis.4–10 These often activate mitogene-activated protein kinase (MAPK) signaling (notably BRAF fusions in pilocytic astrocytomas [PAs] and BRAF-V600E mutations in gangliogliomas [GGs] and pleomorphic xanthoastrocytomas [PXAs]).11,12 However, very little is known about other molecular and genomic alterations that are associated with the pathogenesis of these tumors, especially non-PAs.
Unlike adult low-grade gliomas (ALGGs), PLGGs are usually compatible with often long-term survival, possibly resulting from a switch to a quiescent state coincident with maturation of the pediatric brain.13 This suggests that changes in the tumor environment can reverse the neoplastic nature of many PLGGs. For example, modification of microenvironment effectors, such as CXCL12 in the brain,14 has been proposed to arrest PLGG growth. Lack of telomere maintenance may also play a role.15
High-throughput mRNA expression profiling is a useful approach for characterizing molecular alterations in tumors. However, such profiling has not been done extensively in pediatric non-PAs.16–18 The small numbers of patients with these diseases have limited the availability of tissue (particularly fresh-frozen tissue), which is required by many genomic assays.
Here we characterized the gene expression profiles of 151 paraffin-embedded PLGGs, across 6 histological subtypes using an innovative platform that allows expression profiling of more than 6100 commonly cancer-dysregulated genes in paraffin-embedded samples. These data segregate tumors according to phenotypic features and identify differences in molecular patterns between different types of tumors including supratentorial (ST) and infratentorial (IT) PAs and between BRAF-duplicated, V600E-mutated and BRAF wild-type tumors. We also compared expression profiles as function of age.
We related these differences to publicly available expression profiles from normal developing brains to determine whether the differences we observed were reflected in normal brains.
Materials and Methods
Tumor Sample Collection
All tissues used were paraffin embedded and obtained from Boston Children's Hospital through IRB-approved protocols. Diagnoses were made according to the WHO classification scheme by consensus of 3 neuropathologists (J.C., K.L.L., S.S.). For 137 samples (91%), we performed fluorescence in-situ hybridization to assess the presence of BRAF-KIAA fusion transcripts.19 We genotyped for BRAF-V600E mutations in 94 samples (62%) using targeted sequencing.12 All tumors were clinically annotated with outcomes.
RNA Isolation and Microarray Analysis
RNA was extracted using TRIzol (Life Technologies) followed by purification using the RNeasy MinElute Cleanup Kit (Qiagen). Expression profiles were generated using the Illumina DASL platform20 and normalized using cubic spline interpolation.21,22 This platform used 6100 genes that harbor the largest variation across a large sample panel across tissue types, as described.21 Samples were run in 3 batches; we applied batch correction using ComBat.23 Z scores were generated for each gene across samples. Self-organizing maps (SOMs),24 hierarchical clustering,25 comparative marker selection analysis,26,27 and gene set enrichment analysis (GSEA)28,29 were performed using GenePattern.30 Principal component analyses were generated in Matlab. For clustering, principal components analysis (PCA) plots, and distance measurements, we used the 250 genes with highest variance. Use of 100, 500, or 1000 genes gave similar results but poorer average silhouette values (data not shown). For comparative marker selection, we only report genes with differences in mean z scores >0.5. The data have been deposited in the Gene Expression Omnibus31 (accession number GSE60898).
Normal Brains
Normalized RNA-sequencing data across brain regions and ages (infancy, childhood, and adolescence) were uploaded from BRAINSPAN.32 To allow comparison between BRAINSPAN and DASL data, we selected the 5483 genes assessed by both. Forty-three BRAINSPAN samples (0/234 embryos, 13/73 infants, 22/101 childhood samples, 6/59 adolescents, and 2/112 adults; Supplementary material, Fig. S1) exhibited low expression levels across most genes and average levels <10 RPKM (2 SDs below the mean), suggesting tissue degradation. These were removed.
Immunohistochemistry
HLA-DRA immunohistochemistry (Abcam, 1:250) was performed in an additional cohort of 18 PA tumors using the Dual Link Envision+ (Dako) detection system. Citrate was used for antigen retrieval and diaminobenzidine (DAB) as the chromogen. We assessed DAB surface and intensity staining using Cell Profiler (Broad Institute)33 in 15 representative tumor sections for each sample.
Statistical Analysis
Fisher's exact and Mann-Whitney tests were used to generate P values as appropriate. False discovery rates (FDRs) were determined to account for multiple hypotheses,34 and FDR<0.25 was considered significant. Log-rank (Mantel-Cox) tests were used to examine differences in event-free survival.
Results
We analyzed expression of 6100 genes in 151 paraffin-embedded PLGG samples spanning 6 histological subtypes: pilocytic astrocytomas (PAs), gangliogliomas (GGs), diffuse astrocytomas (DAs), dysembryoplastic neuroepithelial tumors (DNTs), oligodendroglial tumors (ODs), and PLGGs Not Otherwise Specified (NOS) (Fig. 1A). The cohort included tumors from 13 infants (birth to 18 months), 89 children (19 months to 11 years), and 49 adolescents (12 to 19 years). Primary tumors constituted 135 samples; 16 were collected after second surgery for relapse or progression, including 9 for which we had paired primary and recurrent samples.
Fig. 1.
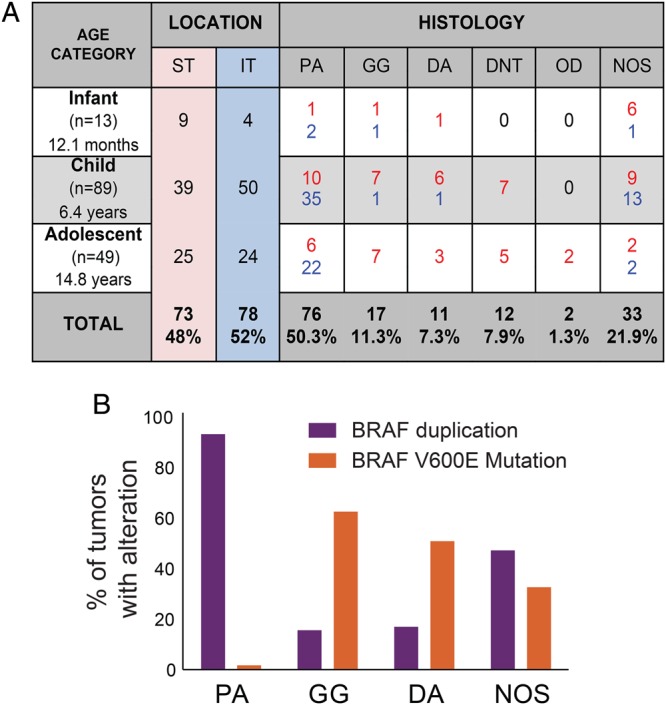
Description of the sample set. (A) Summary of tumor locations and histologies by age in the pediatric population. Red and blue numbers indicate supratentorial (ST) and infratentorial (IT) tumors, respectively. (B) BRAF genomic status by histology. Dysembryoplastic neuroepithelial tumors (DNTs) and oligodendroglial (OD) tumors did not harbor either the BRAF duplication or the BRAF-V600E point mutation.
NOS tumors were the only histological subtype that occurred with equal frequency in both the supratentorium and infratentorium. DAs, GGs, DNTs, and ODs occurred most commonly in the supratentorium (P < .0001); PAs were primarily infratentorial (and primarily cerebellar; P < .0001) (Fig. 1A).
Consistent with prior reports,8,9,11,35 we observed BRAF-KIAA duplications most frequently in PAs (P < .0001); BRAF-V600E mutations were significantly associated with GGs (P < .0002) (Fig. 1B). Similar fractions of NOS tumors harbored BRAF-duplications (38%) and V600E mutations (26%) (Fig. 1B). Tumors with BRAF duplications were predominantly IT (81%, P < .0001); those with BRAF-V600E mutations were predominantly ST (90%, P < .0001).
Pediatric Low-grade Gliomas Cluster in 3 Molecular Groups According to Location, Histological Subtype, and BRAF Genomic Status
The 135 newly diagnosed PLGGs segregated into 3 clusters (“supratentorial,” “BRAF-duplicated,” and “mixed”; Fig. 2A), associated with different histologies (Fig. 2B) by Euclidean SOM24 (Supplementary material, Figs S2 and S3). DAs were enriched in the ST cluster (P = .0014), as were ODs and DNTs (P values < .001). PAs were enriched in the BRAF-duplicated cluster (P < .0001), with most of the remaining in the mixed cluster. GGs were primarily distributed between clusters 1 and 3 (P = .160). NOS tumors were distributed almost equally across all 3 clusters, indicating that they are molecularly heterogeneous. NOS tumors with BRAF duplications preferentially segregated into the BRAF-duplicated cluster (P = .05), which was otherwise dominated by BRAF-duplicated IT PAs. NOS tumors with V600E point mutations mostly segregated in clusters 1 and 3 (P = .2) with the ST GGs and other ST tumors.
Fig. 2.

Pediatric low-grade gliomas (PLGGs) divide into 3 molecular clusters. (A) Self-organizing map (SOM) clustering heat map including the 135 primary PLGGs. (B–D) Distributions among the 3 clusters of histology: (B) supratentorial tumors (ST), (C) infratentorial tumors (IT), and (D) BRAF genomic status (*P < .001, Fisher exact test between members of the starred cluster vs both other clusters). (E) Event-free survival curves for the 3 clusters.
The supratentorial cluster was significantly enriched with ST PLGGs (P < .0001), whereas IT tumors were significantly enriched in the BRAF-duplicated cluster (P < .0001; Fig. 2C). The mixed cluster was not significantly enriched with tumors from either location (P = .591).
Tumors from different age groups segregated almost evenly across the 3 clusters. To determine how adult low-grade gliomas (ALGGs) relate to these clusters, we added 15 primary ALGGs, all ST (7 ODs, 5 DAs, 2 PAs, 1 NOS tumor), to the pediatric cohort and performed SOM clustering on the combined cohort of 150 tumors. We again obtained 3 clusters that substantially aligned with the 3 clusters in the original analysis (Supplementary material, Fig. S4). Of the 15 ALGGs, 12 (80%) segregated with the ST PLGGs in cluster 1.
BRAF-duplicated tumors were significantly enriched in cluster 2 (58%, P < .0001), whereas BRAF–V600-mutated tumors were enriched in clusters 1 and 3 (P = .066; Fig. 2D). This observation reflects the finding that BRAF-duplicated tumors are more frequent among IT PAs, whereas ST PLGGs more commonly harbor the BRAF-V600E point mutation. The BRAF status of the NOS tumors followed the same distribution, with a significant enrichment of NOS BRAF-duplicated tumors in cluster 2 and BRAF–V600E-mutated tumors in clusters 1 and 3 (P = .045).
The 3 clusters exhibited no differences in event-free survival (Fig. 2E).
We compared molecular signatures between the different clusters using GSEA and the 1320 gene sets in the C2 canonical pathway (CP) set. The ST cluster was significantly enriched for 34 gene sets (Q value < 0.25; Supplementary material, Table S5A). Of these, 7 were associated with neurotransmission mechanisms (of 18 total; P < .0001), suggesting a neuronal signature. No gene sets were significantly enriched in the BRAF-duplicated cluster. The mixed cluster was significantly enriched for 33 gene sets (Supplementary material, Table S5B), including 3 of 21 gene sets associated with cell-cycle control (P = .0139) and 5 of 67 gene sets associated with immune response (P = .0227).
Variations in Expression Patterns Across Histological Subtypes
We analyzed how expression profiles vary across the 4 major histologies (PAs, DAs, DNTs, and GGs) using comparative marker selection analysis and GSEA. We controlled for location by comparing only the ST tumors.
We found that 205 genes and 90 gene sets were significantly differentially expressed between the ST PAs and the ST DAs (Fig. 3A, Supplementary material, Table S6A and S6B) and that 230 genes and 120 gene sets were significantly differentially expressed between the ST PAs and the 12 ST DNTs (Fig. 3B, Supplementary material, Table S6C and S6D). In both comparisons, 57 gene sets were enriched among PAs, including 3 gene sets from each of 2 families: inflammatory pathways (KEGG complement disease, KEGG antigen processing and presentation, and reactome interferon gamma signaling) and extracellular matrix organization (PID integrin 3 pathway, reactome extracellular matrix organization, and reactome collagen formation). Similarly, 99 genes were significantly differentially expressed in ST PAs relative to both ST DAs and ST DNTs; 2 of the 5 genes with the largest differences in expression (SERPING1 and CD74) are in inflammatory pathways. Twenty-eight gene sets were enriched in ST DNTs relative to PAs. Thirteen of these related to a neuron or neuronal transmission, including 4 of the 5 most significant gene sets (reactome post NMDA receptor activation events, reactome neurotransmitter release cycle, reactome neurotransmitter receptor binding, and reactome neurotransmission across chemical synapses). The 4 genes with the greatest expression in ST DNTs relative to ST PAs are all related to signal transduction (SCN2A2, STMN2, SNAP25, and VSNL1). No gene sets were significantly upregulated in ST DAs relative to ST PAs; among the 5 genes that had the greatest expression, ST DAs relative to ST PAs, 2 (SL17A7 and ATP1A2) are involved in ion transport. We found no genes or gene sets that were significantly differentially expressed between the ST PAs and the 15 ST GGs and either the ST PAs or DAs.
Fig. 3.

Variation in gene expression profiles across different histological subtypes. (A and B) Heat maps representing genes found to be differentially expressed between (A) supratentorial (ST) pilocytic astrocytomas (PAs) and diffuse astrocytomas (DAs) and (B) between ST PAs and dysembryoplastic neuroepithelial tumors (DNTs) (C) Principal components analyses comparing the expression patterns of ST PAs and ST DAs, (D) ST PAs and ST DNTs (D), and (E) ST PAs and ST gangliogliomas (GGs).
Using the first 3 components of a PCA analysis, we observed differences between the ST PAs and DAs (Fig. 3C) and between the ST PAs and DNTs (Fig. 3D); the ST PAs and GGs appear to be mixed (Fig. 3E). However, these global differences only trend towards statistical significance. We compared the Euclidean distances within and between all PAs and DAs, PAs and DNTs, and PAs and GGs and determined the significance of these differences by permuting class labels. We controlled for the location by permuting separately ST and IT tumors within each group of tumors. We found no significant differences between any of these groups (P = .09, .08, .13, respectively).
Variations in Expression Patterns by Tumor Location
We also observed significant differences in expression between ST and IT tumors on both a global scale (P = .0001; Fig 4A and B) and at the individual gene level after controlling for histology. We compared Euclidean distances within and between the 2 groups, controlling for histology by maintaining histology class labels. We also found significant differences after restricting the analysis to PAs (P = .02). These differences can be visualized using the first 3 principle components of a PCA across the whole cohort (Fig. 4A) and across the PAs (Fig. 4B).
Fig. 4.

Supratentorial (ST) and infratentorial (IT) pilocytic astrocytomas (PAs) exhibit different molecular patterns. (A) Principal components analyses (PCA) comparing ST and IT pediatric low-grade gliomas (PLGGs) and (B) ST and IT PAs. (C) Heat map of genes found to be differentially expressed between ST and IT PAs. (D) Enrichment plot of an IL12 gene set found to be significantly enriched in ST PAs relative to IT PAs. (E) HLA-DRA immunohistochemical staining of individual ST and IT PAs (top) and summary results across 8 ST and 8 IT tumors (bottom). The Y-axis represents the area under the curve (AUC) metric from Cell Profiler. *P < .05.
Among PAs, 31 genes and 21 gene sets were significantly differentially expressed between ST and IT tumors (Fig. 4C, Supplementary material, Table S7A and B). All 21 differentially expressed gene sets were enriched among the ST tumors, including 3 that were associated with IL12 pathway activation (out of 4 total; P < .0001; Fig. 4D).
Among the ST tumors, 58 were cortical, and 15 were midline. After controlling for histology as a confounder, we observed 73 genes and 3 gene sets significantly differentially expressed between the 2 ST regions (Supplementary material, Table S7D-E).
These differences between ST and IT tumors appear to be tumor specific and not reproduced in normal brain tissue. We compared ST and IT expression profiles from 12 children's brains in the publicly available BRAINSPAN dataset.32 Among the 31 genes that were differentially expressed between ST and IT PAs, 30 were also included in the BRAINSPAN dataset. Among these, 14 genes were differentially expressed in the same direction and 16 in the opposite direction between tumors and normal brains (P = .29). We also performed GSEA on 12 ST and 12 IT normal samples from children in the BRAINSPAN database (Supplementary material, Table S7C). We did not observe significant enrichment in either direction of any inflammatory pathways. However, we did find indications of increased IL12 pathway activation in ST tumors in expression data from an independent set of 16 ST and 30 IT PAs.8 We evaluated all 4 IL12 gene sets included in the C2 CP set. One of these was enriched in the ST PAs (P = .03); the other 3 exhibited trends in that direction (P = .0984, P = .1262, and P = .2350, respectively).
We further evaluated this finding by performing immunohistochemistry for HLA-DRA in an independent set of 8 ST and 8 IT PAs. HLA-DRA is a major effector in immune response and was one of the genes overexpressed in ST relative to IT PAs. We observed significantly higher expression of HLA-DRA in the ST (Fig. 4E, P = .007). The cells that stained positive for HLA-DRA included cells within vessels (possibly lymphocytes) and also cells with glial morphology within the tumor, suggesting that both populations may contribute to the increase in inflammatory signatures in ST PAs.
Molecular Differences Associated With BRAF Alterations
We observed significant differences in levels of individual genes and gene sets between BRAF-duplicated and BRAF–V600E-mutated tumors. We performed comparative marker selection between the BRAF-duplicated or mutated tumors and WT tumors, controlling for both location and histology as possible confounders by maintaining these class labels during all permutations. We evaluated both individual gene scores and sums of scores across all genes within the gene sets listed in the MSigDBC2P database.36 No genes or gene sets were significantly differentially expressed between the BRAF-duplicated tumors and WT tumors or between BRAF–V600E-mutated and WT tumors. We did find 15 genes that were differentially expressed between the BRAF-duplicated and -V600E mutated tumors (Fig. 5A, Supplementary material, Table S8). Eleven genes were overexpressed in BRAF-duplicated tumors, including the calcium-binding protein S100A1 (involved in the regulation of cell cycle progression and differentiation) and the transcription factor ID4. Four genes were overexpressed in BRAF–V600E-mutant tumors, including ANK1, an ankyrin involved in cell motility and proliferation, and the tyrosine kinase PTK2B, which regulates neuronal activity.
Fig. 5.

Variation in gene expression between BRAF-KIAA duplicated and BRAF–V600E-mutated tumors. (A) Heat map representing genes found to be differentially expressed between BRAF-duplicated and V600E-mutated tumors. (B) Histogram representing the Euclidean distances between and within BRAF-duplicated and wild-type (WT) tumors, between and within BRAF-V600E mutated and WT tumors, and between and within BRAF-duplicated tumors and BRAF–V600E-mutated tumors. P values represent the probability that the Euclidean distances between tumor groups are significantly higher than distances within tumor groups.
To evaluate global differences, we compared the Euclidean distances between BRAF-duplicated, BRAF–V600E-mutated, and BRAF-WT tumors to Euclidean distances between tumors within each of these classes after controlling for location and histology. We found no significant differences between any of these groups (P = .15, P = .40, P = .26, respectively; Fig. 5B).
Differences Between Primary and Recurrent Tumors
Our cohort included 31 primary tumors from children who went on to have recurrences and 16 recurrent tumors, with overlap in 9 cases. We observed no significant differences in the overall Euclidean distances between primary and recurrent tumor samples or between the 104 primary tumors with no record of recurrence and the 31 tumors that went on to progress (P = .12, P = .9, respectively; Fig. 6A and B). We also found no genes or gene sets whose expression differed significantly between primary and recurrent PLGGs after controlling for location and histology.
Fig. 6.

Recurrent and primary pediatric low-grade gliomas (PLGGs) do not exhibit clearly distinct molecular patterns. Principal components analyses (PCA) comparing the expression pattern of primary and recurrent PLGGs: (A) the 104 primary tumors that have no record of recurrence, (B) the 31 primary tumors that have relapsed or progressed, and (C) the 9 paired primary and recurrent samples. Arrows match each primary to its recurrent pairs.
Compared with primary tumors from the same patients, recurrent tumors exhibited enrichment of 2 genes: the zinc finger ZNF652 and the kinase anchor protein AKAP9 that interacts with signaling proteins from various signal transduction pathways. However, there was no significant difference in overall Euclidean distances between the paired primary and recurrent tumors (P = .28), and the changes between them did not favor any direction or magnitude (Fig. 6C).
Similar Expression Patterns in Childhood and Adolescent Pilocytic Astrocytomas
Tumors that occurred in young children also exhibited no significant differences compared with those of adolescents approaching adulthood. We evaluated both individual genes and gene sets and controlled for location and histology by selecting only IT PAs for comparison.
Discussion
PLGGs are characterized by a spectrum of histological subtypes, different ages and locations of development within the brain, and varied genetic alterations. We examined how expression profiles of PLGGs are shaped by their clinical, histopathological, and BRAF genomic characteristics and whether differences associated with age and location were reflected in expression profiles from normal brain.
We identified substantial differences between ST and IT tumors after controlling for histology, indicating that tumor location significantly influences PLGG expression profiles. Only tumors with purities greater than 70% were included in this analysis, however. The differences were also not significantly similarly reflected in ST and IT normal brain expression, suggesting that the differences were specific to the cancer cells or to their interactions with normal cells within the tumor. ST and IT PAs have previously been found to harbor distinct expression17,18 and methylation profiles.37 However, the genes found to be differentially expressed in the prior study17,18 did not overlap with our gene set. Among the 15 genes reported to be differentially expressed in that study that were represented in our DASL platform, two-thirds were similarly differentially expressed between normal brain ST and IT regions (P = .3).
ST PAs are enriched for IL12 pathway activity compared with IT PAs. IL12 activates T cells and regulates the production of IFN-γ via JAK2 and STAT4.38,39 HLA-DRA, which drives various inflammatory pathways, was specifically enriched among ST PAs.40 These findings suggest either an inflammatory signal in ST PA tumor cells or inflammatory activation in the tumor microenvironment. HLA-DRA expression in colorectal cancer has been reported to reflect an immunological response in the tumor bed that is associated with a better outcome.41,42
We identified molecular differences between PAs and DAs and between PAs and DNTs, even after controlling for location. Although DAs and PAs are both classified as astrocytic tumors by the WHO consensus, the differences we detected suggest either that they arise from distinct cells of origin or the distinct genomic abnormalities that drive these tumor subtypes are reflected in their expression profiles. Conversely, other PLGG subtypes such as PAs and GGs tend to cluster together in the same SOM group and did not exhibit statistically significant differences using a distance permutation test. This was surprising because their morphologies and BRAF alterations differ. It is possible that differences will be revealed by larger tumor cohorts with increased statistical power.
NOS tumors distributed equally across the 3 clusters in our unsupervised analyses, suggesting that they do not constitute a unified molecular class. The finding that their distribution was dependent on their BRAF alteration status suggests the NOS class includes tumors with strong molecular similarities to existing histological classes (eg, PAs and GGs). It may be appropriate to include such molecular features in the diagnostic criteria for these tumors in order to reclassify the NOS tumors among the well-defined histological groups with which they are most similar.
BRAF-duplicated and BRAF–V600E-mutated tumors exhibited differences after controlling for location and histological subtype, including differences in expression levels of genes involved in cell development and differentiation. However, these differences were not extensive. These tumors also tended to cluster separately in our unsupervised analysis but not to a statistically significant degree. It is possible that we would detect greater differences in a larger cohort or by using an assay that evaluates larger numbers of genes. However, the minimal differences between these tumor subsets, as compared with the differences between ST and IT tumors, may indicate that these alterations lead to similar downstream effects. Similarly, our inability to detect substantial differences in gene expression profiles of BRAF-altered tumors compared with wild-type tumors might be related to a lack of power for detecting small differences in our dataset, to a minimal impact of BRAF alterations on gene expression profiles, or to the existence of genomic alterations in the wild-type tumors that lead to similar downstream effects. These alterations might include mutations or copy-number alterations of FGFR1 or NTRK2 rearrangements, all of which have been recently described in PLGGs and shown to lead to MAPK activation.8,9
We found that PLGG expression patterns do not substantially evolve with progression. This is consistent with clinical observations that PLGGs rarely undergo malignant transformation13 and often respond to the same chemotherapy regimen,43 although they often progress or recur.
We also found no significant differences in outcome between the 3 different clusters of primary tumors, possibly due to lack of power because PLGGs grow slowly.
A significant complication in the analysis of bulk gene expression profiles, as obtained here, is that they reflect the sum of profiles across the many subclones and cell states of both tumor and normal cells within the sample.44,45 For example, the finding that ST PAs exhibit enhanced inflammatory pathways may reflect changes within the cancer cells or an increased inflammatory response. Single-cell expression profiling46,47 may enable us to disentangle these different contributions to the bulk profile, thereby providing important information about the molecular programs that are altered specifically in the tumor cells and in their microenvironment.
Supplementary Material
Funding
Pediatric Low Grade Astrocytoma Foundation (G.B., P.B., C.S., R.S., K.L.L., M.W.K., R.B.), Nuovo-Soldati Foundation and Philippe Foundation (G.B.), St Baldricks Foundation (P.B.), R01 DK099558 (Y.H.), Stop&Shop Pediatric Brain Tumor Program and Andrysiak Fund for LGG (P.B. and M.W.K.), Friends of DFCI (G.B., P.B.), Friends for Life Fellowship (B.P.), Team Jack Foundation (P.B., C.S. and M.W.K.), the Mill Foundation for Kids (M.W.K.), the Sontag Foundation (R.B.), Gray Matters Foundation (R.B.), NIH P01 CA142536 (R.S. and C.S.), P01CA142536 (K.L.L., C.S., L.C.G., M.K.), INCA grant PHRC 2008, and L′Etoile de Martin (J.G.)
Conflict of interest statement. Dr Beroukhim and Dr Stiles have grants and consulting relationships with Novartis Pharmaceuticals. Dr Kieran serves on advisory boards for Novartis, Sanofi, Incyte, Boehringer, SigmaTau, and Merck Pharmaceutical. Dr Ligon serves on the advisory board for Midatech.
Supplementary Material
References
- 1.Bergthold G, Bandopadhayay P, Bi WL, et al. Pediatric low-grade gliomas: how modern biology reshapes the clinical field. Biochim Biophys Acta. 2014;1845(2):294–307. [DOI] [PMC free article] [PubMed] [Google Scholar]
- 2.Gilles FH, Tavare CJ, Becker LE, et al. Pathologist interobserver variability of histologic features in childhood brain tumors: results from the CCG-945 study. Pediatr Dev Pathol. 2008;11(2):108–117. [DOI] [PubMed] [Google Scholar]
- 3.Bernhardtsen T, Laursen H, Bojsen-Møller M, Gjerris F. Sub-classification of low-grade cerebellar astrocytoma: is it clinically meaningful? Childs Nerv Syst. 2003;19(10–11):729–735. [DOI] [PubMed] [Google Scholar]
- 4.Pfister S, Janzarik WG, Remke M, et al. BRAF gene duplication constitutes a mechanism of MAPK pathway activation in low-grade astrocytomas. J Clin Invest. 2008;118(5):1739–1749. [DOI] [PMC free article] [PubMed] [Google Scholar]
- 5.Jones DT, Kocialkowski S, Liu L, et al. Tandem duplication producing a novel oncogenic BRAF fusion gene defines the majority of pilocytic astrocytomas. Cancer Res. 2008;68(21):8673–8677. [DOI] [PMC free article] [PubMed] [Google Scholar]
- 6.Dougherty MJ, Santi M, Brose MS, et al. Activating mutations in BRAF characterize a spectrum of pediatric low-grade gliomas. Neuro Oncol. 2010;12(7):621–630. [DOI] [PMC free article] [PubMed] [Google Scholar]
- 7.Cin H, Meyer C, Herr R, et al. Oncogenic FAM131B-BRAF fusion resulting from 7q34 deletion comprises an alternative mechanism of MAPK pathway activation in pilocytic astrocytoma. Acta Neuropathol. 2011;121(6):763–774. [DOI] [PubMed] [Google Scholar]
- 8.Zhang J, Wu G, Miller CP, et al. Whole-genome sequencing identifies genetic alterations in pediatric low-grade gliomas. Nat Genet. 2013;45(6):602–612. [DOI] [PMC free article] [PubMed] [Google Scholar]
- 9.Jones DT, Hutter B, Jager N, et al. Recurrent somatic alterations of FGFR1 and NTRK2 in pilocytic astrocytoma. Nat Genet. 2013;45(8):927–932. [DOI] [PMC free article] [PubMed] [Google Scholar]
- 10.Ramkissoon LA, Horowitz PM, Craig JM, et al. Genomic analysis of diffuse pediatric low-grade gliomas identifies recurrent oncogenic truncating rearrangements in the transcription factor MYBL1. Proc Natl Acad Sci USA. 2013;110(20):8188–8193. [DOI] [PMC free article] [PubMed] [Google Scholar]
- 11.MacConaill LE, Campbell CD, Kehoe SM, et al. Profiling critical cancer gene mutations in clinical tumor samples. PLoS One. 2009;4(11):e7887. [DOI] [PMC free article] [PubMed] [Google Scholar]
- 12.Dias-Santagata D, Lam Q, Vernovsky K, et al. BRAF V600E mutations are common in pleomorphic xanthoastrocytoma: diagnostic and therapeutic implications. PloS One. 2011;6(3):e17948. [DOI] [PMC free article] [PubMed] [Google Scholar]
- 13.Bandopadhayay P, Bergthold G, London WB, et al. Long-term outcome of 4,040 children diagnosed with pediatric low-grade gliomas: An analysis of the Surveillance Epidemiology and End Results (SEER) database. Pediatr Blood Cancer. 2014;617:1173–1179. [DOI] [PMC free article] [PubMed] [Google Scholar]
- 14.Warrington NM, Woerner BM, Daginakatte GC, et al. Spatiotemporal differences in CXCL12 expression and cyclic AMP underlie the unique pattern of optic glioma growth in neurofibromatosis type 1. Cancer Res. 2007;67(18):8588–8595. [DOI] [PubMed] [Google Scholar]
- 15.Tabori U, Vukovic B, Zielenska M, et al. The role of telomere maintenance in the spontaneous growth arrest of pediatric low-grade gliomas. Neoplasia. 2006;8(2):136–142. [DOI] [PMC free article] [PubMed] [Google Scholar]
- 16.Gutmann DH, Hedrick NM, Li J, et al. Comparative gene expression profile analysis of neurofibromatosis 1-associated and sporadic pilocytic astrocytomas. Cancer Res. 2002;62(7):2085–2091. [PubMed] [Google Scholar]
- 17.Sharma MK MD, Reifenberger G, Perry A, et al. Distinct genetic signatures among pilocytic astrocytomas relate to their brain region origin. Cancer Res. 2007;67(3):890–900. [DOI] [PubMed] [Google Scholar]
- 18.Tchoghandjian A, Fernandez C, Colin C, et al. Pilocytic astrocytoma of the optic pathway: a tumour deriving from radial glia cells with a specific gene signature. Brain. 2009;132(Pt 6):1523–1535. [DOI] [PubMed] [Google Scholar]
- 19.Tian Y, Rich BE, Vena N, et al. Detection of KIAA1549-BRAF fusion transcripts in formalin-fixed paraffin-embedded pediatric low-grade gliomas. J Mol Diagn. 2011;13(6):669–677. [DOI] [PMC free article] [PubMed] [Google Scholar]
- 20.Fan JB, Yeakley JM, Bibikova M, et al. A versatile assay for high-throughput gene expression profiling on universal array matrices. Genome Res. 2004;14(5):878–885. [DOI] [PMC free article] [PubMed] [Google Scholar]
- 21.Hoshida Y, Villanueva A, Kobayashi M, et al. Gene expression in fixed tissues and outcome in hepatocellular carcinoma. N Engl J Med. 2008;359(19):1995–2004. [DOI] [PMC free article] [PubMed] [Google Scholar]
- 22.Workman C, Jensen LJ, Jarmer H, et al. A new non-linear normalization method for reducing variability in DNA microarray experiments. Genome Biol. 2002;3(9):1–16, research0048. [DOI] [PMC free article] [PubMed] [Google Scholar]
- 23.Johnson WE, Li C, Rabinovic A. Adjusting batch effects in microarray expression data using empirical Bayes methods. Biostatistics. 2007;8(1):118–127. [DOI] [PubMed] [Google Scholar]
- 24.Tamayo P, Slonim D, Mesirov J, et al. Interpreting patterns of gene expression with self-organizing maps: methods and application to hematopoietic differentiation. Proc Natl Acad Sci USA. 1999;96(6):2907–2912. [DOI] [PMC free article] [PubMed] [Google Scholar]
- 25.Eisen MB, Spellman PT, Brown PO, et al. Cluster analysis and display of genome-wide expression patterns. Proc Natl Acad Sci USA. 1998;95(25):14863–14868. [DOI] [PMC free article] [PubMed] [Google Scholar]
- 26.Golub TR, Slonim DK, Tamayo P, et al. Molecular classification of cancer: class discovery and class prediction by gene expression monitoring. Science. 1999;286(5439):531–537. [DOI] [PubMed] [Google Scholar]
- 27.Gould J, Getz G, Monti S, et al. Comparative gene marker selection suite. Bioinformatics. 2006;22(15):1924–1925. [DOI] [PubMed] [Google Scholar]
- 28.Subramanian A, Tamayo P, Mootha VK, et al. Gene set enrichment analysis: a knowledge-based approach for interpreting genome-wide expression profiles. Proc Natl Acad Sci USA. 2005;102(43):15545–15550. [DOI] [PMC free article] [PubMed] [Google Scholar]
- 29.Mootha VK, Lindgren CM, Eriksson KF, et al. PGC-1alpha-responsive genes involved in oxidative phosphorylation are coordinately downregulated in human diabetes. Nat Genet. 2003;34(3):267–273. [DOI] [PubMed] [Google Scholar]
- 30.Reich M, Liefeld T, Gould J, et al. GenePattern 2.0. Nat Genet. 2006;38(5):500–501. [DOI] [PubMed] [Google Scholar]
- 31.Edgar R, Domrachev M, Lash AE. Gene Expression Omnibus: NCBI gene expression and hybridization array data repository. Nucleic Acids Res. 2002;30(1):207–210. [DOI] [PMC free article] [PubMed] [Google Scholar]
- 32.BrainSpan: Atlas of the Developing Human Brain [Internet]. Funded by ARRA Awards 1RC2MH089921-01, 1RC2MH090047-01, and 1RC2MH089929-01. © 2011. Available from: http://developinghumanbrain.org, last accessed 2011.
- 33.Carpenter AE, Jones TR, Lamprecht MR, et al. CellProfiler: image analysis software for identifying and quantifying cell phenotypes. Genome Biol. 2006;7(10):R100. [DOI] [PMC free article] [PubMed] [Google Scholar]
- 34.Hochberg Y, Benjamini Y. More powerful procedures for multiple significance testing. Stat Med. 1990;9(7):811–818. [DOI] [PubMed] [Google Scholar]
- 35.Jacob K, Albrecht S, Sollier C, et al. Duplication of 7q34 is specific to juvenile pilocytic astrocytomas and a hallmark of cerebellar and optic pathway tumours. Br J Cancer. 2009;101(4):722–733. [DOI] [PMC free article] [PubMed] [Google Scholar]
- 36.Liberzon A, Subramanian A, Pinchback R, et al. Molecular signatures database (MSigDB) 3.0. Bioinformatics. 2011;27(12):1739–1740. [DOI] [PMC free article] [PubMed] [Google Scholar]
- 37.Lambert SR, Witt H, Hovestadt V, et al. Differential expression and methylation of brain developmental genes define location-specific subsets of pilocytic astrocytoma. Acta Neuropathol. 2013;126(2):291–301. [DOI] [PubMed] [Google Scholar]
- 38.Bacon CM, Petricoin EF, 3rd, Ortaldo JR, et al. Interleukin 12 induces tyrosine phosphorylation and activation of STAT4 in human lymphocytes. Proc Natl Acad Sci USA. 1995;92(16):7307–7311. [DOI] [PMC free article] [PubMed] [Google Scholar]
- 39.Sugimoto N, Nakahira M, Ahn HJ, et al. Differential requirements for JAK2 and TYK2 in T cell proliferation and IFN-gamma production induced by IL-12 alone or together with IL-18. Eur J Immunol. 2003;33(1):243–251. [DOI] [PubMed] [Google Scholar]
- 40.Cogswell JP, Zeleznik-Le N, Ting JP. Transcriptional regulation of the HLA-DRA gene. Crit Rev Immunol. 1991;11(2):87–112. [PubMed] [Google Scholar]
- 41.Matsushita K, Takenouchi T, Kobayashi S, et al. HLA-DR antigen expression in colorectal carcinomas: influence of expression by IFN-gamma in situ and its association with tumour progression. Br J Cancer. 1996;73(5):644–648. [DOI] [PMC free article] [PubMed] [Google Scholar]
- 42.Lovig T, Andersen SN, Thorstensen L, et al. Strong HLA-DR expression in microsatellite stable carcinomas of the large bowel is associated with good prognosis. Br J Cancer. 2002;87(7):756–762. [DOI] [PMC free article] [PubMed] [Google Scholar]
- 43.Packer RJ, Lange B, Ater J, et al. Carboplatin and vincristine for recurrent and newly diagnosed low-grade gliomas of childhood. J Clin Oncol. 1993;11(5):850–856. [DOI] [PubMed] [Google Scholar]
- 44.Gerlinger M, Rowan AJ, Horswell S, et al. Intratumor heterogeneity and branched evolution revealed by multiregion sequencing. N Engl J Med. 2012;366(10):883–892. [DOI] [PMC free article] [PubMed] [Google Scholar]
- 45.Saunders NA, Simpson F, Thompson EW, et al. Role of intratumoural heterogeneity in cancer drug resistance: molecular and clinical perspectives. EMBO Mol Med. 2012;4(8):675–684. [DOI] [PMC free article] [PubMed] [Google Scholar]
- 46.Barrett CL, Schwab RB, Jung H, et al. Transcriptome sequencing of tumor subpopulations reveals a spectrum of therapeutic options for squamous cell lung cancer. PloS One. 2013;8(3):e58714. [DOI] [PMC free article] [PubMed] [Google Scholar]
- 47.Duechler M, Peczek L, Zuk K, et al. The heterogeneous immune microenvironment in breast cancer is affected by hypoxia-related genes. Immunobiology. 2014;219(2):158–165. [DOI] [PubMed] [Google Scholar]
Associated Data
This section collects any data citations, data availability statements, or supplementary materials included in this article.