

Abstract
Cell death-inducing DFFA-like effector c (CIDEC, also known as Fsp27) has emerged as an important regulator of metabolism associated with lipodystrophy, diabetes, and hepatic steatosis. It is required for unilocular lipid droplet formation and optimal energy storage. The mechanism between this gene and livestock growth traits, however, has yet to be reported. In this study, we found ten novel single nucleotide polymorphisms (SNPs) in the 5’ transcriptional region of CIDEC in Nanyang (NY) cattle, which are located in the recognition sequences (potential cis-acting elements) of 22 transcription factors, and the nine haplotypes represent nine different combinations of polymorphic potential cis-acting elements. The results indicated that individuals with the H8-H8 diplotype had heavier body weights and faster growth rates (P < 0.01) at 18th months than those with H1-H8. We evaluated the transcriptional activities of different haplotypes in vitro, the results were consistent with the association analysis. The H8 haplotype had 1.88-fold (P < 0.001) higher transcriptional activity than the H1 haplotype. We speculate that the haplotypes of the potential cis-acting elements may affect the transcriptional activity of CIDEC, thus affecting the growth traits of cattle. This information may be used in molecular marker-assisted selection of cattle breeding in the future.
The family of CIDE proteins, comprising three members (CIDEA, CIDEB, and CIDEC), have emerged as important regulators in various aspects of metabolism1. CIDEC, also named fat-specific protein 27 (Fsp27) in rodents and CIDE3 in humans, was recognized to be vital in unilocular lipid droplet formation and optimal energy storage. CIDEC-knockout mice have a lean phenotype and atrophic adipose tissue as a result of high energy expenditure. This mouse line is also protected against diet-induced obesity and insulin resistance2,3. In human foam cells, CIDEB and CIDEC were shown to be important for the formation and catabolism of intracellular lipid droplets and the process of atherosclerosis4. CIDEC was also found to be expressed in the steatotic liver of the type-II diabetes model mice. The physiological roles of CIDEC in adipose tissue and the liver demonstrate its significance as a factor in the development of metabolic disorders5.
Variations in CIDEC are associated with abnormal lipid metabolism. For example, a female patient who was found to be homozygous for a premature truncation variation in the conserved CIDE-C-terminal domain had partial lipodystrophy and insulin-resistant diabetes6. Based on previous studies, we hypothesized that the CIDEC gene plays an important role in bovine growth traits; however, to date there is no research on the variations in the bovine CIDEC gene. In this study, we found nine potential cis-acting element haplotypes involving ten novel variations in the bovine CIDEC gene, and then we assessed the genetic impacts of these haplotypes on bovine body weight (BW) and average daily gain (ADG). In addition, we analyzed the mechanisms of these genetic impacts based on transcriptional activity. The results of this research will contribute to the understanding of the regulatory mechanisms of the CIDEC gene, and may be used in molecular marker-assisted selection of live cattle breeding in the future.
Results
Ten novel SNPs were identified in the transcriptional regulatory region of the CIDEC gene
The bovine CIDEC gene is located on chromosome 22 and encodes 222 amino acids, including five exons. In the present study, polymorphisms in the 5’ region of the bovine CIDEC gene were identified by DNA pool sequencing, and ten novel SNPs were identified [AC_000179.1: g.−501 G > A; −546 T > C; −643 T > G; −714 T > C; −727 C > T; −762 C > T; −763 C > T; −841 T > C; −956 G > A; −974 C > T]. These ten SNPs were novel and have been deposited in the GenBank database (see Fig. 1 and Supplementary Table S1).
Figure 1. The structure of bovine CIDEC and the SNPs in intron 1 and its flanking region.

Note: 1321F and 1321R were the primers used to detect the genotypes.
As shown in Supplementary Table S2, the genotype and allele frequencies and the diversity parameters of the bovine CIDEC were directly calculated for all 213 animals. There were three genotypes for each locus, except g.−714 T > C, for which the CC genotype was not observed. The distribution of the genotype and allele frequencies of g.−956 G > A; −841 T > C; −763 C > T; −727 C > T, and −546 T > C were similar, and g.−643 T > G and −501 G > A had the same genotype frequency distribution.
The values of He approached 0.500, and the g.−714 T > C locus had the lowest He value (0.025). The values of Ne approached 2.000 for most of loci except the g.−714 T > C locus, which had a value of 1.024. Apart from g.−714 T > C, the other loci had intermediate polymorphisms.
SNP variation in potential cis-acting elements of the CIDEC gene
A search of the Genomatix database (http://www.genomatix.de) revealed 208 potential cis-acting elements in the 1.321 kb region (5’ relative to the translation start site, including these ten SNPs) of CIDEC. Therefore, those recognition sequences containing one or two SNPs, or being adjacent to SNPs, were evaluated. Accordingly, similarity to a total of 25 known regulatory motifs was scored on both strands of the bovine CIDEC sequence, of which 16 were located in the plus strand and nine in the minus strand. Detailed information on the SNPs and motifs is presented in Table 1.
Table 1. The SNPs in the bovine CIDEC that alter or are adjacent to the cis-acting elements.
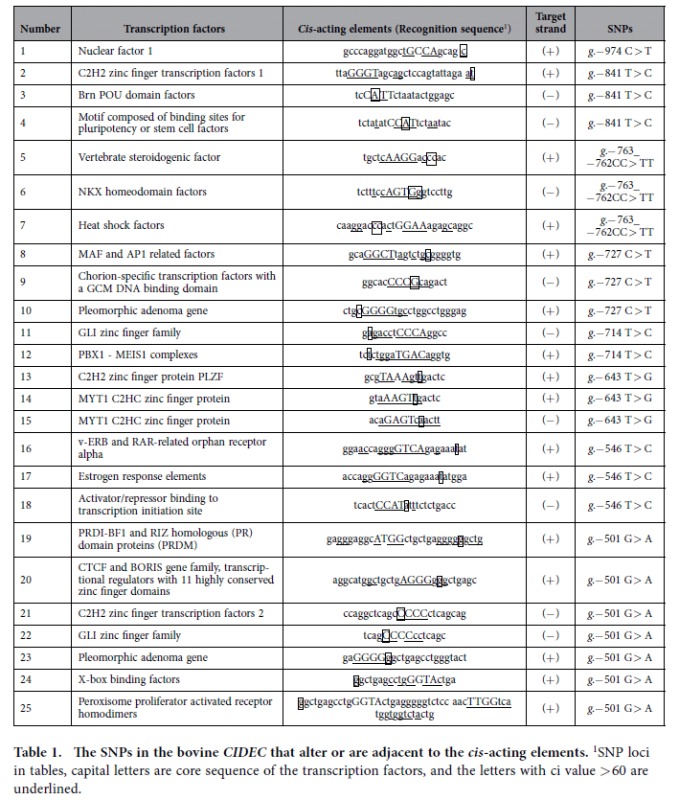
1SNP loci in tables, capital letters are core sequence of the transcription factors, and the letters with ci value >60 are underlined.
Haplotypes of the potential cis-acting elements in the CIDEC
The degrees of linkage disequilibrium between these ten CIDEC SNPs are shown in Supplementary Table S3. The D’ values ranged from 0.895 to 1.000, and the r2 values ranged from 0.003 to 1.000. It is noteworthy that two linkage disequilibrium blocks were observed among these SNPs (block 1: g. −956 G > A, g. −841 T > C, and g. −763 C > T, r2 = 1.000; block 2: g. −643 T > G and g. −501 G > A, r2 = 1.000).
Haplotypes were reconstructed with the PHASE computer program. Nine haplotypes were identified in this sample of NY cattle (Table 2). The frequencies of the haplotypes ranged from 0.000 to 0.464. H8 had the highest frequency (0.464). Combined with the information from the potential cis-acting elements in Table 1, we found that the potential cis-acting elements were changed in all nine haplotypes. H1 and H2 both led to fourteen mutated potential cis-acting element sequences (of which four potential cis-acting elements had variations in their core sequence), followed by H5, which led to nine mutated cis-acting element sequences. H8, which resulted in only three variations in potential cis-acting elements, had the highest frequency among the NY cattle studied. We found that this bovine population was mainly composed of individuals with fewer variations in potential cis-acting elements.
Table 2. Haplotypes and haplotype frequencies of ten SNPs in bovine CIDEC in the NY cattle population.
| Haplotypes | g.−974 | g.−956 | g.−841 | g.−763 | g.−762 | g.−727 | g.−714 | g.−643 | g.−546 | g.−501 | Frequency |
|---|---|---|---|---|---|---|---|---|---|---|---|
| AC_000179.1 | C > T | G > A | T > C | C > T | C > T | C > T | T > C | T > G | T > C | G > A | (%) |
| H1 | C | A | C | T | C | T | T | G | C | G | 0.119 |
| H2 | C | A | C | T | T | T | T | G | C | G | 0.155 |
| H3 | C | G | T | C | C | C | T | G | T | G | 0.024 |
| H4 | C | G | T | C | C | C | T | T | T | A | 0.202 |
| H5 | C | G | T | C | C | T | T | G | C | G | 0.012 |
| H6 | C | G | T | C | T | C | T | G | T | G | 0.000 |
| H7 | T | G | T | C | C | C | C | G | T | G | 0.012 |
| H8 | T | G | T | C | C | C | T | G | T | G | 0.464 |
| H9 | T | G | T | C | C | T | T | G | T | G | 0.012 |
Haplotypes in the promoter region of the CIDEC were associated with the BW and ADG of NY cattle
To further assess the associations between the diplotypes of these ten SNPs and both BW and ADG in NY cattle, the diplotypes of the ten SNPs were constructed. As shown in Table 2, there were nine haplotypes in the NY breed. Because the frequencies of H3 (0.024), H5 (0.012), H6 (0.000), H7 (0.012), and H9 (0.012) were small, our association analysis for the effect of diplotypes excluded the diplotypes related to these haplotypes. Therefore, four haplotypes were included: H1 (0.119), H2 (0.155), H4 (0.202), and H8 (0.484), and five diplotypes were used in the correlation analysis (Table 3). Individuals with the H8-H8 (TT-GG-TT-CC-CC-CC-TT-GG-TT-GG) diplotype had heavier BW and higher ADG at the 18th months, as compared to individuals with all other diplotypes (P < 0.05) (Table 3). However, the associations between the diplotypes and BW and ADG were not significant at other time points (P > 0.05), so the detailed results are not displayed in this paper.
Table 3. Associations between the CIDEC diplotypes and body weight and average daily gain in NY cattle.
| Diplotype | Sample size |
Growth traits (Mean ± SE) |
|
|---|---|---|---|
| BW18 | ADG18 | ||
| H8-H8 | 62 | 349.000Aa ± 14.056 | 0.680Aa ± 0.075 |
| H4-H8 | 40 | 309.667ABb ± 11.477 | 0.460ABb ± 0.061 |
| H2-H4 | 28 | 303.200ABb ± 12.572 | 0.341Bb ± 0.067 |
| H1-H8 | 34 | 294.000Bb ± 12.572 | 0.449ABb ± 0.067 |
| H2-H8 | 34 | 287.727Bb ± 8.476 | 0.352Bb ± 0.045 |
| P value | 0.016 | 0.011 | |
Values with different superscripts within the same column differ significantly at P < 0.05 (a, b) and P < 0.01 (A, B). SE: standard error. BW18: body weight at 18 months-old; ADG 18: average daily gain at 18 months-old.
Haplotypes of the potential cis-acting elements in the CIDEC possessed different transcriptional activities
Pooled genomic DNA from 213 NY cattle was used as a template, and a pair of specific primers (see Supplementary Table S4) were used to get these different haplotypes (see Table 2) by polymerase chain reaction (PCR), and then the transcriptional activities of these haplotypes were determined using a dual-luciferase reporter assay system in a mouse embryonic fibroblast-adipose-like cell line (3T3-L1). The H8 haplotype had a 2.27-fold (P < 0.001) higher activity comparing with the H1 haplotype (Fig. 2); these two haplotypes differed at 11 potential cis-acting elements (3–10 and 16–18 in Table 1).
Figure 2. In vitro constitutive activities of the bovine CIDEC haplotypes.

The numbers in the left part of the figure refers to the potential cis-acting elements (Table 1), and the red color of the numbers indicates that there are mutations existing in the corresponding element. The histograms in the right part of the figure refer the transcriptional activities of the candidate haplotypes. The ratio of firefly luciferase to renilla luciferase was used to normalize the promoter activity. The error bars represent the standard error of the mean (SE) from three independent assays.
Discussion
In leptin-deficient (ob/ob) mice, the Fsp27 expression level was significantly up-regulated in the white adipose tissue (WAT) and liver7. In the WAT of Fsp27-deficient mice, the expression levels of BAT-selective genes and WAT-selective genes were significantly up-regulated and down-regulated, respectively, the WAT was “browning”8. Fsp27-/- mice had lower visceral fat volume, smaller adipocyte size of WAT and brown adipose tissue (BAT)9, higher glucose intake rates, higher lipolysis rates, dramatically lower levels of TAG, and increased mitochondrial volumes in white adipocytes10. Fsp27/leptin double-deficient mice were resistant to diet-induced obesity and displayed increased insulin sensitivity8,10. Overall, animals with Fsp27 deficiencies have lean phenotypes with higher energy expenditure.
CIDEC is mainly expressed in human subcutaneous adipocytes that are located on the surface of lipid droplets; its expression increases during differentiation11 and declines in response to reduced caloric intake3. In obese humans, the hepatic expression of CIDEC increases and its expression is strongly correlated to BMI at the time of gastric bypass surgery12. In BMI-matched obese humans, CIDEC levels in WAT are positively correlated with insulin sensitivity. In human adipocytes, insulin may increase CIDEC mRNA expression, which suggests that it plays a role in controlling adipose lipolysis and thus circulating fatty acids13,14. Overall, CIDEC gene is a novel regulator of obesity, type 2 diabetes, and liver steatosis.
In this study, the cattle with the H8-H8 diplotype showed heavier BW and higher ADG than individuals with other diplotypes at 18th months (P = 0.016 and P = 0.011, respectively). Why did individuals with different diplotypes show different growth traits? We hypothesize that the variations in the flanking region of the CIDEC may change the associated cis-acting elements and thus its transcription15,16,17. In the current study, these nine haplotypes represent nine potential cis-acting element compositions, and the dual-luciferase reporter assay indicated that the transcriptional activities was associated with these mutations: the individuals with fewer variations in potential cis-acting elements had higher transcriptional activity. For example, the BtCIDEC-H8 with the least mutated potential cis-acting elements (only three) had the highest transcriptional activity, and individuals with the H8-H8 diplotype had the highest BWs. These results are consistent with previous research on rodents and human in that individuals with higher CIDEC expression levels had better growth rates.
It is worth mentioning that the associations between diplotypes with BW and ADG were significant only at 18 months-old; there was no correlation at other time points, which may be explained by an inconsistent bovine growth rate18. Further determination of the expression profile of CIDEC during bovine growth and development may help us to understand the temporal heterogeneity of this biological process.
We detected ten novel SNPs in NY cattle CIDEC gene, and these SNPs led to variations in 22 potential cis-acting elements. Haplotypes with different combinations of potential cis-acting elements exhibited different transcriptional activity, and the differences in transcriptional activity may be the biological basis of the association between the potential cis-acting elements and growth traits. This information may be used in molecular marker-assisted selection of cattle breeding in the future.
Methods
Ethics statement
The experiments and animal care were performed according to the Regulations for the Administration of Affairs Concerning Experimental Animals (Ministry of Science and Technology, China, 2004) and approved by the Institutional Animal Care and Use Committee (College of Animal Science and Technology, Northwest A&F University, China). Adult cattle were allowed access to feed and water ad libitum under normal conditions and all efforts were made to minimize suffering.
Cattle population, data collection, and genomic DNA isolation
The cattle used in this research were an indigenous Chinese breed, NY cattle. This breed is suited for large-scale farming and meat production and is distributed in the Henan province of China. Many other provinces have introduced NY cattle to improve their local cattle breeds. The test herd used in this study was reared at the Henan Nanyang Cattle Conservation Farm, where the cattle were kept under the same conditions. The animals were weaned at an average of six months age and raised on a diet of corn and corn silage.
The variable under investigation in this study were body weight (BW) in kilograms and average daily gain (ADG) in kilograms at birth (30.468 ± 2.986), six months-old (162.065 ± 19.237, 0.731 ± 0.099), 12 months-old (226.032 ± 25.766, 0.355 ± 0.102), 18 months-old (303.387 ± 32.785, 0.429 ± 0.177), and 24 months-old (395.710 ± 40.062, 0.512 ± 0.262).
Blood samples from 213 female NY cattle (which came from different five sires and each one has one dam) were obtained by jugular venipuncture using vacuum tubes treated with 0.25% ethylene diamine tetraacetic acid (EDTA). Genomic DNA was extracted from the blood samples using a standard method19.
Primer design, PCR amplification, and SNP detection
Five pairs of PCR primers were designed to amplify all exons (exons 1–6) and the 5' untranslated region (UTR) of the bovine CIDEC (AC_000179.1), including the intron–exon boundaries and proximal flanking regions. The primer sequences are displayed in Supplementary Table S4.
PCR amplifications were carried out using pooled genomic DNA from the 213 NY cattle as a template20. The 25 μL PCR reaction volume contained 50 ng of pooled genomic DNA, 0.5 μM of primer, 1 × buffer (including 1.5 mM MgCl2), 200 μM dNTPs, and 0.625 units of Taq DNA polymerase (MBI, Vilnius, Lithuania). The cycling protocol was 5 min at 95 °C; 34 cycles of 30 s at 94 °C, annealing for 30 s (the annealing temperature for each pair of primers is listed in Supplementary Table S4) and 72 °C for 30 s, and a final extension of 10 min at 72 °C. The PCR products were sequenced using an ABI PRISM 3730XL DNA sequencer (Sangon Biotech, Shanghai, China), and the variations in the bovine CIDEC were then analyzed with Vector NTI software (Invitrogen). To further analyze the ten variations in the 5’ flanking region, one pair of PCR primers was designed to amplify the transcriptional regulatory region of the bovine CIDEC (P6 in Supplementary Table S4). The PCR products for the 213 NY cattle were sequenced using an ABI PRISM 3730XL DNA sequencer, and the SNP information was analyzed using the SEQMAN package (DNA Star Lasergene software).
Analysis of potential cis-acting elements in 1.321 kb of the bovine CIDEC sequence
The transcriptional regulatory region of the CIDEC (1.321 kb, AC_000179.1, from 16909073 to 16918356), which included these ten SNPs, was analyzed using MATINSPECTOR 8.0 (Genomatix software GmbH) on its default settings. Then, the potential cis-acting elements with variations located in or adjacent to their recognition sequences were selected for further analysis.
Construction of linkage disequilibrium (LD) maps and haplotypes of the potential cis-acting elements in the CIDEC
The LD structure was constructed with HAPLOVIEW (version 3.32)21, which was used to calculate D′ and r2. Some research has shown that r2 is not as sensitive as D′ to allele frequencies; therefore, r2 was used as a pairwise measurement of LD in our analysis22.
Haplotypes were obtained for each animal using the PHASE (version 2.1) computer program23. Nine haplotypes for the CIDEC were detected among the 213 NY cattle. These haplotypes were combined with the potential cis-acting elements in Table 1; with the exception of −956 G > A and −974 C > T, all SNPs were located in 22 potential cis-acting elements. Different haplotypes corresponded to different sequences of the potential cis-acting elements. In total, there were nine haplotypes that represented nine haplotypes of potential cis-acting elements.
Plasmid construction
Because the frequencies of the haplotypes H5, H6, and H7 (0.012, 0.000, and 0.012, respectively) were too low, haplotypes H1–H4 and H8–H9 of potential cis-acting elements in the CIDEC were amplified and inserted into the pGL3-Basic vector to determine their transcriptional activities using a dual-luciferase reporter assay system (Promega, Heidelberg, Germany). KpnI and XhoI restriction sites were added to the forward and reverse primers, respectively. The PCR products were cleaned using a TIANquick Midi Purification Kit (Tiangen, Beijing, China) following the manufacturer’s instructions, and then digested with KpnI and XhoI. The PCR products with sticky ends were inserted into the pGL3-Basic vector, and a sample of the ligation mix was then transferred into Top 10 E. coli cells (Promega). Positive clones were selected based on the restriction digestion profiles of the plasmid DNA and were further confirmed by DNA sequencing.
Determination of the transcriptional activities of different haplotypes of potential cis-acting elements in the CIDEC
3T3-L1 cells (Type Culture Collection of the Chinese Academy of Sciences, Shanghai, China) were maintained in Dulbecco’s Modified Eagle Medium (DMEM) and supplemented with 10% newborn calf serum (NBCS) and antibiotics (100 IU/mL penicillin; 100 ug/mL streptomycin) at 37 °C and 5% CO2 in a normal atmosphere incubator. One day before transfection, 0.5–2 × 10⁵ cells were grown overnight to 90% confluence in 250 μL of growth medium without antibiotics in 48-well plates. In each well, 385 ng of the expression construct (H1, H2, H3, H4, H8, or H9), 15 ng of pRL-TK normalizing vector, and 1 μL of Lipofectamine 2000 (Invitrogen) were incubated with 60 μL of serum-free DMEM. The pGL3-Basic vector was used as a negative control. Transfections were performed in 250 μL of serum-free DMEM for 6 h, and then the medium was replaced with 250 μL of fresh 10% NBCS DMEM. Cell lysates were collected 24 h post-transfection and used for the measurement of the relative transcriptional activity of each fragment with the Dual-Luciferase Reporter Assay System (Promega), according to the manufacturer’s protocol. The relative luciferase activities were determined using a VICTORTM X2 Multilabel Plate Reader (PerkinElmer, Inc., Waltham, MA, USA). At least three parallel experiments were performed for statistical analysis.
Statistical analysis
The genotype and allele frequencies of the SNPs in the bovine CIDEC from the 213 NY cattle were determined by direct counting. Gene homozygosity (Ho), heterozygosity (He), the effective allele number (Ne), and the polymorphism information content (PIC) were evaluated by Nei’s methods24.
Associations between the diplotypes of the CIDEC and growth traits in NY cattle were analyzed using the General Linear Model (GLM) in SPSS (version 16.0). All analyses were performed in two steps: first, a full animal model was used, and second, a reduced animal model was used. The full animal model included fixed effects for marker diplotypes, birth year, season of birth (spring vs. fall), ages of the dam and sire, farm, and random effects (permanent environment, animal, and residual). The effects associated with the season of birth, age of the dam and sire, farm, and random effects were not matched in the linear model because preliminary statistical analyses indicated that these effects did not have a significant influence on trait variability in the analyzed populations (P > 0.05). Thus, the reduced model, which included fixed effects for age and diplotypes, was used in the final analysis. The linear model was as follows: Yij = μ + Ai + Dj + Eij, where Yij is the trait measured for the ijth animal, μ is the overall population mean, Ai is the fixed effect due to the ith age, Dj is the fixed effect associated with the jth diplotype, and Eij is the random error. In this model, age and marker diplotypes were considered fixed effects and the growth traits were considered the dependent variables. The results of the multiple comparisons were corrected by Bonferroni correction, and the differences were considered significant at P < 0.05. The transcriptional activities for the different haplotypes of potential cis-acting elements were expressed as the mean ± SE.
Additional Information
How to cite this article: Wang, J. et al. Haplotypes in the promoter region of the CIDEC gene associated with growth traits in Nanyang cattle. Sci. Rep. 5, 12075; doi: 10.1038/srep12075 (2015).
Supplementary Material
Acknowledgments
This study was supported by National Natural Science Foundation of China (Grant No. 31272408), the National 863 Program of China (Grant No. 2013AA102505), Program of National Beef Cattle and Yak Industrial Technology System (Grant No. CARS-38). We thank Dr. Wei Chen (Department of Evolutionary Ecology and Genetics, Zoological Institute, Christian Albrechts-Universitaet zu Kiel, Germany) for language editing of the manuscript.
Footnotes
Author Contributions J.W. gathered samples, conceived the report, participated in its design, performed data analysis, interpreted results and drafted the manuscript. Y.Z.H. and Z.J.L. isolated RNA and DNA, performed the SNP detection. H.P. and M.X.L. contributed to Plasmid construction. L.S.H. and L.Z.Z. participated in intellectual discussion. X.Y.L., C.Z.L. and H.C. provided guidance on experimental design and funding. C.J.L. provided editorial suggestions and revisions. All authors read and approved the final manuscript.
References
- Traini M. & Jessup W. Lipid droplets and adipose metabolism: a novel role for FSP27/CIDEC. Curr Opin Lipidol. 20, 147–149 (2009). [DOI] [PubMed] [Google Scholar]
- Kim J. Y. et al. Assessment of fat-specific protein 27 in the adipocyte lineage suggests a dual role for FSP27 in adipocyte metabolism and cell death. Am J Physiol Endocrinol Metab. 294, E654–E667 (2008). [DOI] [PubMed] [Google Scholar]
- Magnusson B. et al. Cell death-inducing DFF45-like effector C is reduced by caloric restriction and regulates adipocyte lipid metabolism. Metabolism: clinical and experimental. 57, 1307–1313 (2008). [DOI] [PubMed] [Google Scholar]
- Li H. et al. Identification of lipid droplet-associated proteins in the formation of macrophage-derived foam cells using microarrays. International journal of molecular medicine. 26, 231–239 (2010). [DOI] [PubMed] [Google Scholar]
- Matsusue K. A physiological role for fat specific protein 27/cell death-inducing DFF45-like effector C in adipose and liver. Biol Pharm Bull. 33, 346–350 (2010). [DOI] [PubMed] [Google Scholar]
- Rubio-Cabezas O. et al. Partial lipodystrophy and insulin resistant diabetes in a patient with a homozygous nonsense mutation in CIDEC. EMBO Mol Med. 1, 280–287 (2009). [DOI] [PMC free article] [PubMed] [Google Scholar]
- Matsusue K. et al. Hepatic steatosis in leptin-deficient mice is promoted by the PPARgamma target gene Fsp27. Cell metabolism. 7, 302–311 (2008). [DOI] [PMC free article] [PubMed] [Google Scholar]
- Li D. et al. Regulation of gene expression by FSP27 in white and brown adipose tissue. BMC genomics. 11, 446 (2010). [DOI] [PMC free article] [PubMed] [Google Scholar]
- Peng X. G. et al. Comparison of brown and white adipose tissue fat fractions in ob, seipin, and Fsp27 gene knockout mice by chemical shift-selective imaging and (1)H-MR spectroscopy. American journal of physiology. Endocrinology and metabolism. 304, E160–E167 (2013). [DOI] [PubMed] [Google Scholar]
- Toh S. Y. et al. Up-regulation of mitochondrial activity and acquirement of brown adipose tissue-like property in the white adipose tissue of fsp27 deficient mice. PloS one. 3, e2890 (2008). [DOI] [PMC free article] [PubMed] [Google Scholar]
- Li F. et al. Cell death-inducing DFF45-like effector, a lipid droplet-associated protein, might be involved in the differentiation of human adipocytes. The FEBS journal. 277, 4173–4183 (2010). [DOI] [PubMed] [Google Scholar]
- Hall A. M., Brunt E. M., Klein S. & Finck B. N. Hepatic expression of cell death-inducing DFFA-like effector C in obese subjects is reduced by marked weight loss. Obesity (Silver Spring). 18, 417–419 (2010). [DOI] [PMC free article] [PubMed] [Google Scholar]
- Puri V. et al. Cidea is associated with lipid droplets and insulin sensitivity in humans. Proceedings of the National Academy of Sciences of the United States of America. 105, 7833–7838 (2008). [DOI] [PMC free article] [PubMed] [Google Scholar]
- Ito M., Nagasawa M., Hara T., Ide T. & Murakami K. Differential roles of CIDEA and CIDEC in insulin-induced anti-apoptosis and lipid droplet formation in human adipocytes. Journal of lipid research. 51, 1676–1684 (2010). [DOI] [PMC free article] [PubMed] [Google Scholar]
- Jiang Z. et al. Comparative understanding of UTS2 and UTS2R genes for their involvement in type 2 diabetes mellitus. Int J Biol Sci. 4, 96–102 (2008). [DOI] [PMC free article] [PubMed] [Google Scholar]
- Bahar B. et al. Bovine lactoferrin (LTF) gene promoter haplotypes have different basal transcriptional activities. Anim Genet. 42, 270–279 (2011). [DOI] [PubMed] [Google Scholar]
- Satyanarayana Chakradhara Rao U. et al. Functional characterization of promoter region polymorphisms of human CYP2C19 gene. Mol Biol Rep. 38, 4171–4179 (2011). [DOI] [PubMed] [Google Scholar]
- Du M. et al. Fetal programming of skeletal muscle development in ruminant animals. Journal of animal science. 88, E51–E60 (2010). [DOI] [PubMed] [Google Scholar]
- Sambrook J. G. et al. Identification of the ancestral killer immunoglobulin-like receptor gene in primates. BMC Genomics. 7, 209 (2006). [DOI] [PMC free article] [PubMed] [Google Scholar]
- Sham P., Bader J. S., Craig I., O’Donovan M. & Owen M. DNA Pooling: a tool for large-scale association studies. Nat Rev Genet. 3, 862–871 (2002). [DOI] [PubMed] [Google Scholar]
- Barrett J. C., Fry B., Maller J. & Daly M. J. Haploview: analysis and visualization of LD and haplotype maps. Bioinformatics. 21, 263–265 (2005). [DOI] [PubMed] [Google Scholar]
- Marty A. et al. Genetic variability and linkage disequilibrium patterns in the bovine DNAJA1 gene. Mol Biotechnol. 44, 190–197 (2010). [DOI] [PubMed] [Google Scholar]
- Stephens M., Smith N. J. & Donnelly P. A new statistical method for haplotype reconstruction from population data. American journal of human genetics. 68, 978–989 (2001). [DOI] [PMC free article] [PubMed] [Google Scholar]
- Nei M. Analysis of gene diversity in subdivided populations. Proc Natl Acad Sci USA 70, 3321–3323 (1973). [DOI] [PMC free article] [PubMed] [Google Scholar]
Associated Data
This section collects any data citations, data availability statements, or supplementary materials included in this article.