Scientific Reports 4: Article number: 5485 10.1038/srep05485; published online: June302014; updated on: July202015
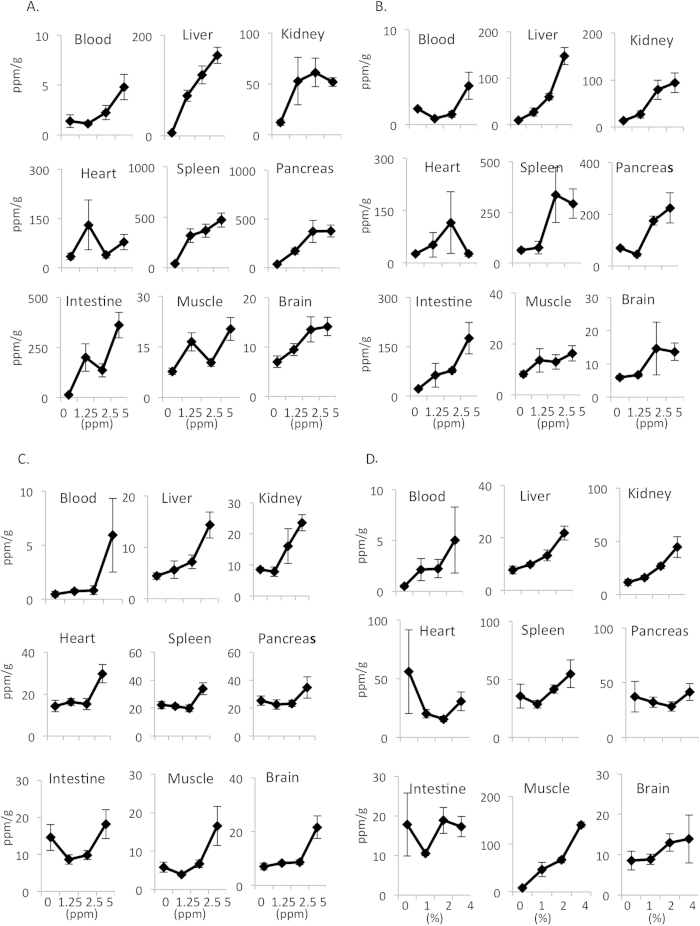
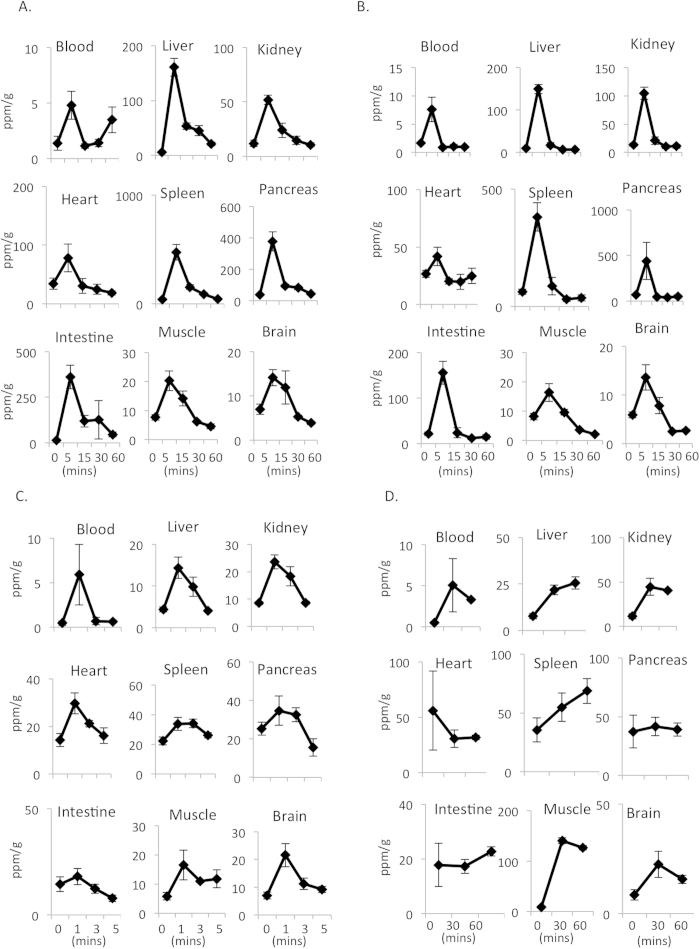
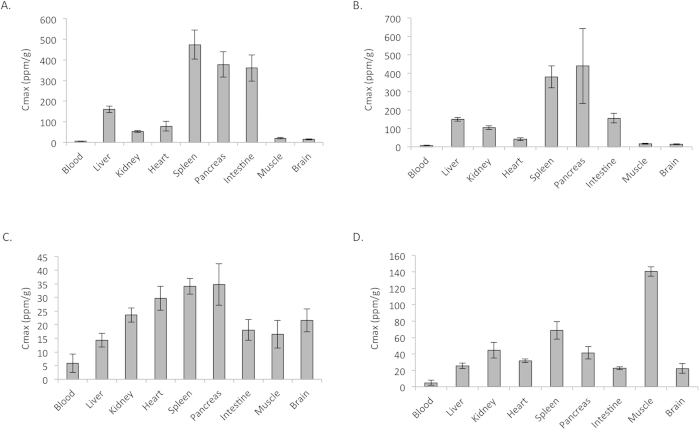
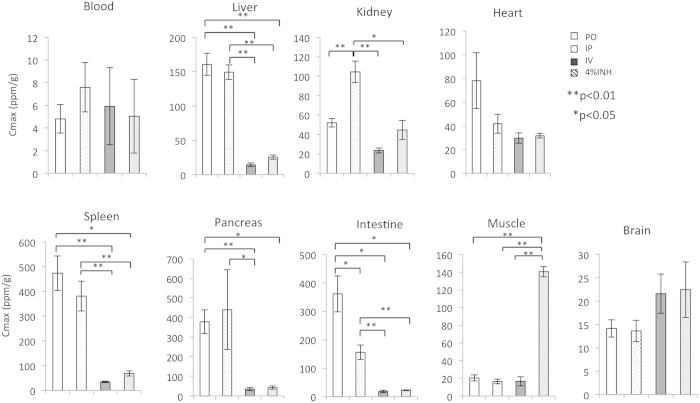
This Article contains an error in describing the unit of hydrogen concentration in Figures 2-5: ‘ppb/g’ should read ‘ppm/g’ in the Y-axes. The correct Figures 2-5 appear below as Figures 1, 2, 3, 4 respectively.
Figure 1.
Figure 2.
Figure 3.
Figure 4.
In the Results section:
“Furthermore, a Cmax analysis showed that the oral administration of HSRW resulted in a high hydrogen concentration (more than 300 ppb/g) in the tissues of the spleen, small intestine and pancreas (Fig. 4A). Meanwhile, the intraperitoneal administration of HSRS resulted in a high hydrogen concentration in the spleen and pancreas (more than 300 ppb/g) (Fig. 4B). However, the hydrogen concentrations were not high (more than 35 ppb/g) in any of the tissues after intravenous treatment (Fig. 4C). Interestingly, the inhalation of hydrogen gas resulted in the highest hydrogen concentration in the muscle (more than 140 ppb/g; Fig. 4D).”
should read:
“Furthermore, a Cmax analysis showed that the oral administration of HSRW resulted in a high hydrogen concentration (more than 300 ppm/g) in the tissues of the spleen, small intestine and pancreas (Fig. 4A). Meanwhile, the intraperitoneal administration of HSRS resulted in a high hydrogen concentration in the spleen and pancreas (more than 300 ppm/g) (Fig. 4B). However, the hydrogen concentrations were not high (more than 35 ppm/g) in any of the tissues after intravenous treatment (Fig. 4C). Interestingly, the inhalation of hydrogen gas resulted in the highest hydrogen concentration in the muscle (more than 140 ppm/g; Fig. 4D).”
In the Methods section under ‘Tissue dissociation and the determination of the hydrogen concentrations in the arterial blood and tissues’:
“The hydrogen concentration in each blood or tissue sample was defined as follows: Hydrogen concentration (ppb/g; V/V) = A/B × C; where A is the measurement value obtained using the Sensor Gas Chromatograph, B is the blood or tissue weight (g) and C is the volume of the gentleMACS tube (24 ml).”
should read:
“The hydrogen concentration in each blood or tissue sample was defined as follows: Hydrogen concentration (ppm/g; V/V) = A/B × C; where A is the measurement value obtained using the Sensor Gas Chromatograph, B is the blood or tissue weight (g) and C is the volume of the gentleMACS tube (24 ml).”


