Abstract
Background and Aims Chrysolaena obovata, an Asteraceae of the Brazilian Cerrado, presents seasonal growth, marked by senescence of aerial organs in winter and subsequent regrowth at the end of this season. The underground reserve organs, the rhizophores, accumulate inulin-type fructans, which are known to confer tolerance to drought and low temperature. Fructans and fructan-metabolizing enzymes show a characteristic spatial and temporal distribution in the rhizophores during the developmental cycle. Previous studies have shown correlations between abscisic acid (ABA) or indole acetic acid (IAA), fructans, dormancy and tolerance to drought and cold, but the signalling mechanism for the beginning of dormancy and sprouting in this species is still unknown.
Methods Adult plants were sampled from the field across phenological phases including dormancy, sprouting and vegetative growth. Endogenous concentrations of ABA and IAA were determined by GC-MS-SIM (gas chromatography–mass spectrometry–selected ion monitoring), and measurements were made of fructan content and composition, and enzyme activities. The relative expression of corresponding genes during dormancy and sprouting were also determined.
Key Results Plants showed a high fructan 1-exohydrolase (EC 3.2.1.153) activity and expression during sprouting in proximal segments of the rhizophores, indicating mobilization of fructan reserves, when ABA concentrations were relatively low and precipitation and temperature were at their minimum values. Concomitantly, higher IAA concentrations were consistent with the role of this regulator in promoting cell elongation and plant growth. With high rates of precipitation and high temperatures in summer, the fructan-synthesizing enzyme sucrose:sucrose 1-fructosyltransferase (EC 2.4.1.99) showed higher activity and expression in distal segments of the rhizophores, which decreased over the course of the vegetative stage when ABA concentrations were higher, possibly signalling the entry into dormancy.
Conclusions The results show that fructan metabolism correlates well with endogenous hormone concentrations and environmental changes, suggesting that the co-ordinated action of carbohydrate metabolism and hormone synthesis enables C. obovata to survive unfavourable field conditions. Endogenous hormone concentrations seem to be related to regulation of fructan metabolism and to the transition between phenophases, signalling for energy storage, reserve mobilization and accumulation of oligosaccharides as osmolytes.
Keywords: ABA, IAA, fructan metabolism, Chrysolaena obovata, Vernonia herbacea, Asteraceae, inulin, hormone signalling, carbohydrate reserves, rhizophore, Cerrado, seasonal dormancy
INTRODUCTION
The Cerrado is a tropical savanna that covers about 23 % of the central region of Brazil, being surpassed in area only by the Amazon Rain Forest (Ratter et al., 1997). This biome hosts a high biodiversity and is considered one of the world hotspots (Simon et al., 2009). The Cerrado soil is deep, porous, permeable, and contains a mixture of sand and clay with overall low water retention, poor in nutrients and acid, due partly to high levels of Al3+ (Eiten, 1972). The climate is characterized by a marked dry winter (3–6 months) and a wet summer, presenting an average precipitation of 800–2000 mm and average annual temperatures ranging between 18 and 28 °C (Dias, 1992).
Water restriction and the wide temperature range are some of the selective pressures acting on Cerrado species. In this biome, plants developed adaptive strategies to cope with seasonal water deficit and temperature stress, including enlarged underground organs, thick corky bark, hard sclerophyllous leaves, and leaf senescence in the dry season (Ratter et al., 1997). Seasonal growth and reproductive patterns are also typical and related to the climatic seasonality of the Cerrado, as well as of other tropical savannas (Williams et al., 1997; Batalha and Mantovani, 2000). Metabolic adjustments, including production of compatible solutes and activation of the antioxidant system, complete the multiple plant stress response mechanisms in Cerrado species.
Fructans are soluble, osmotically active carbohydrates thought to act on membrane stabilization by binding to choline and phosphate groups, increasing tolerance to drought and low temperature (Pilon-Smits et al., 1995; Carvalho et al., 2007; Hincha et al., 2007; Kawakami et al., 2008; Valluru and Van den Ende, 2008; Garcia et al., 2011). Fructans are widely distributed in herbaceous species of the Cerrado, showing changes in contents and composition associated with the phenological cycle, exposure to low temperature, water availability and other environmental factors prevailing in this biome (Carvalho and Dietrich, 1993; Isejima and Figueiredo-Ribeiro, 1993; Vieira et al., 1995; Portes et al., 2008; Garcia et al., 2011; Oliveira et al., 2013).
Fructans have been regarded as second to starch in importance as storage carbohydrates, being present in approx. 15 % of the contemporary angiosperms (Hendry and Wallace, 1993). Species containing fructans are distributed within a diverse range of families including Poaceae and Asteraceae. The diversity of distribution and the occurrence of fructans among highly evolved families indicate that genes for fructan metabolism in angiosperms may have arisen in response to one or a few selective pressures in the relatively recent past (Hendry, 1987).
Chrysolaena obovata (Less.) Dematt., previously named Vernonia herbacea (Vell.) Rusby, belongs to the Asteraceae family, is herbaceous, perennial and is native to the Cerrado. It accumulates inulin-type fructans in its underground reserve organs, the rhizophores. Inulin synthesis in C. obovata occurs predominantly in younger tissues of rhizophores (distal regions) by the action of the enzymes sucrose:sucrose 1-fructosyltransferase (1-SST; EC 2.4.1.99), that catalyses the formation of the trisaccharide 1-kestose, and fructan:fructan 1-fructosyltransferase (1-FFT; EC 2.4.1.100) that is involved in both the increase and decrease of fructan chain size. Fructan depolymerization occurs mainly in segments of the rhizophores near buds that originate new shoots (proximal regions), by the action of fructan 1-exohydrolase (1-FEH; EC 3.2.1.153) (Portes and Carvalho, 2006; Portes et al., 2008; Asega et al., 2011). The gene coding for 1-FEH in C. obovata was isolated and its activity in inulin hydrolysis was confirmed by heterologous expression in the Pichia pastoris system (Asega et al., 2008).
Fructan metabolism seems to be tightly correlated with the phenological cycle of C. obovata in association with climatic seasonality. Sprouting of these plants in spring is followed by vegetative growth and flower development. Vegetative growth lasts until early autumn, when the aerial organs senesce and go through abscission. From this stage on, plants remain dormant until the end of winter, when buds sprout to develop new aerial organs. A decrease in fructan contents during sprouting indicates reserve mobilization to provide substrate for growth, followed by an increase in fructan contents during the vegetative growth phase (Carvalho and Dietrich, 1993).
Sugar metabolism is under hormonal control, and abscisic acid (ABA) is known to regulate key enzymes and transcript accumulation in different carbohydrate synthesis pathways (Trouverie et al., 2003; Yang et al., 2004). Different phytohormones are known to regulate fructan metabolism (Van den Ende et al., 2002). In the promoter region of the gene 1-FEH IIa isolated from Cichorium intybus, Michiels et al. (2004) identified motifs for response to auxin, ABA, ethylene, gibberellins (GAs) and salicylic acid, revealing the complexity of the regulation of fructan metabolism genes.
In Allium cepa, Chope et al. (2006) detected the concomitant decrease in fructan and ABA contents in bulbs stored at low temperature, and reported the onset of sprouting at a critical minimum concentration of endogenous ABA, associated with carbohydrate mobilization. In Hordeum vulgare, another fructan-accumulating species, plant acclimation to cold occurred due to a concomitant increase in soluble sugars and ABA concentrations (Bravo et al., 1998).
Yang et al. (2004) reported that the ABA concentration increased in wheat stems under drought, correlated with increases in sucrose-phosphate synthase (EC 2.4.1.14) and 1-FEH, and a reduction in 1-SST. Plants treated with an inhibitor of ABA synthesis showed a reduction of sucrose synthesis and in the activities of 1-FEH and acid invertase (EC 3.2.1.26). An opposite response was detected when plants were treated with exogenous ABA. Further clear evidence of the regulation of fructan metabolism by ABA was presented by Ruuska et al. (2008). Using individual wheat culms fed with ABA, the authors showed increased 1-FEH and 6-FEH transcript accumulation and inhibition of 1-SST, 6-SFT and 1-FFT gene expression. Transcriptome analysis of Arabidopsis thaliana and rice treated with exogenous ABA showed induction of 3·5 and 2·5 % of the genes, respectively (Seki et al., 2002; Rabbani et al., 2003). In fact, Seki et al. (2002) reported that carbohydrate metabolism is among the most affected by ABA treatment in A. thaliana.
Despite the importance of auxin in the regulation of plant development, there are only a few studies looking at the association of fructan metabolism and endogenous auxin concentrations. Barreto et al. (2010) reported an increase in fructan concentrations in plants of Agave tequilana in the presence of 1-naphthaleneacetic acid. However, Trevisan et al. (2014) suggested that auxin could act as a negative regulator of fructan-synthesizing enzymes in in vitro plants of C. obovata. More recently, Zhang et al. (2014) found a single nucleotide mutation in the promoter region of the wheat 1-FEH w3 gene, located at an auxin response element (ARE). The authors suggest that this mutation in ARE could affect 1-FEH gene expression and enzyme activity, affecting wheat stem fructan remobilization to grain in different genotypes.
Major changes in phytohormone concentrations occur during the phenological cycle of several species. Zhao et al. (2013) pointed out that environmental factors can regulate plant hormone concentrations and determine the physiological state of plant development. McAdam and Brodribb (2014), studying water use strategies of five phylogenetically distant species co-habiting in the monsoonal tropics of northern Australia, a region characterized by marked seasonal variation in precipitation, found different patterns of ABA sensing, synthesis and metabolism in leaves over the course of the year. According to the authors, the contrasting strategies found among the studied species represent an evolutionary pathway for adaptation in plant water use.
Although a correlation between phytohormones, fructan metabolism and tolerance to drought and cold has been shown in some studies, the implications of endogenous hormonal changes in response to water and cold stress in nature and at different phenological phases are poorly understood. Considering that C. obovata is an excellent model for studying the regulation of fructan metabolism by environmental factors, this study aimed to evaluate endogenous concentrations of ABA and auxin during the transition to the dormant phase (dry season) and to the sprouting phase (wet season), in order to correlate hormone concentrations and fructan metabolism in the rhizophore, as the sink and source organ, in plants growing in the Cerrado.
MATERIALS AND METHODS
Plant material
Four adult plants of Chrysolaena obovata (Less.) Dematt. were collected in a preserved Cerrado area at the Reserva Biológica e Estação Experimental de Mogi Guaçu, SP, Brazil (22°18'S, 47°11'W) at each of the following phenological phases: one harvest at early dormancy (ED) (low water availability), three harvests during sprouting, from early (S1) through two more advanced stages (S2, S3), two harvests during the vegetative growth phase (V1, V2) (high water availability) and one harvest at dormancy (D) (low water availability), totalling seven sampling dates (Table 1). At each harvest, samples of the aerial organs (stems and leaves) at the same developmental stage were used for dry mass determination and hormone analyses. Rhizophores were washed immediately after harvest and sample fragments were cut from the distal and proximal regions, as described (see fig. 1 in Portes and Carvalho, 2006; Supplementary Data Fig. S1). Samples from the two regions were weighed and frozen in liquid nitrogen for biochemical and molecular analyses.
Table 1.
Harvesting dates and corresponding phenological phases of plants of Chrysolaena obovata at Reserva Biológica e Estação Experimental de Mogi Guaçu, SP, Brazil
| Date | Phenological phase | Abbreviation |
|---|---|---|
| 26 June 2012 | Early dormancy | ED |
| 14 August 2012 | Sprouting | S1 |
| 11 September 2012 | Sprouting | S2 |
| 5 October 2012 | Sprouting | S3 |
| 16 January 2013 | Vegetative | V1 |
| 17 April 2013 | Vegetative | V2 |
| 1 July 2013 | Dormancy | D |
Environmental conditions
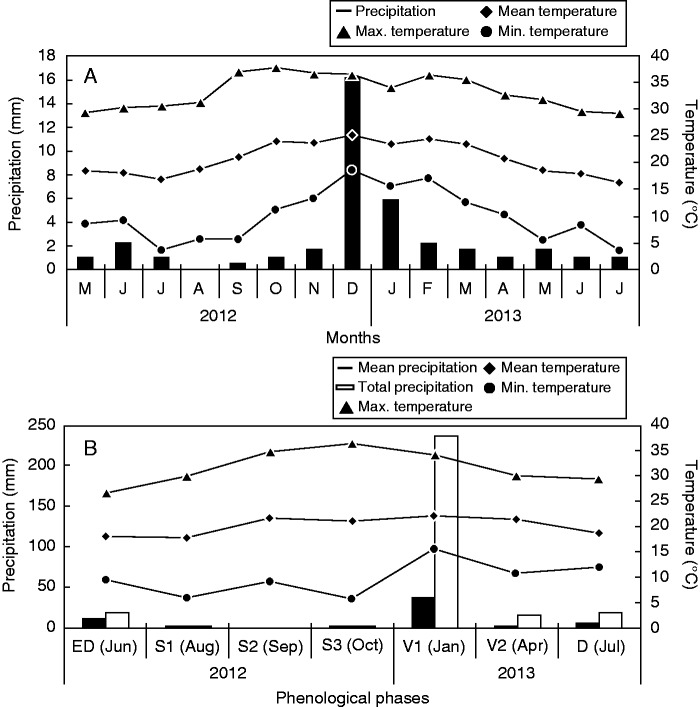
Meteorological data were provided by two companies located near the Biological Reserve where the study was carried out. Maximum and minimum temperatures were obtained from International Paper do Brasil LTDA. (22°22'S, 46°58'W) and rainfall data from two weather stations in the nearby area, belonging to AES Tietê S/A (22°22'S, 46°58'W) (Fig. 1A). The highest precipitation period occurred in summer, between December 2012 and January 2013, and the lowest occurred between the end of autumn and winter, from May to September 2012 and from April to July 2013, when the temperature range increased (Fig. 1A). The average temperature and the accumulated precipitation during the 7 d preceding each sampling date were calculated (Fig. 1B). Precipitation was close to zero between August and October (sprouting stage). The highest precipitation values were observed in January (vegetative stage). The highest temperature range was registered in October, and the lowest in January.
Fig. 1.
(A) Monthly average precipitation, and monthly mean, maximum and minimum temperatures between May 2012 and July 2013 in the study area. (B) Average and accumulated precipitation, and mean, maximum and minimum temperatures 7 d before the harvest dates.
Soil samples were collected at the harvest area in triplicate at depths of 0–10, 20–30 and 40–50 cm, for estimation of soil water retention curves (Cruz et al., 2005) at Instituto Agronômico de Campinas (IAC), SP, Brazil. For soil water retention curves, see Supplementary Data Fig. S2.
Water status of soil and plants
Soil moisture was measured gravimetrically in soil samples obtained from the plant rhizosphere (Blake, 1965). Water content (WC) of aerial organs and rhizophore segments were determined in four samples at each phenological phase, using the equation WC = (f. wt – d. wt)/f. wt × 100, where f. wt is the fresh weight and d. wt the dry weight of the sample. The d. wt of aerial organs was obtained after drying tissues at 60 °C to constant weight, and the d. wt of rhizophores was obtained after sample lyophilization.
The water potential of rhizophore segments was determined in four samples, in squeezed cell sap, using a vapour pressure osmometer (Model VAPRO 5520, Wescor, Logan, UT, USA), according to Oliveira et al. (2013). Osmolarity was measured in mmol kg–1 and transformed into MPa, using the Van’t Hoff equation, MPa = mmol kg–1 × 2·58 × 10–3 (Santa-Cruz et al., 2002).
Determination of endogenous concentrations of ABA and IAA by gas chromatography–mass spectrometry–selected ion monitoring (GC-MS-SIM)
The extraction was done as described in Ludwig-Muller et al. (2008) using frozen samples of aerial organs and rhizophores ground in a mortar, in liquid N2. An isopropanol:acetic acid (95:5) solution was added to the tissue powder (4:1 v/w) together with 0·5 μg of each labelled ABA standard ([2H6]ABA) and indole acetic acid (IAA) standard ([13C6]IAA). The mixture was kept under shaking at 4 °C for 2 h and centrifuged at 13 000 g. The supernatant was collected and concentrated to 50 μL under an N2 gas flow, followed by the addition of 0·2 mL of ultrapure water. Samples were then fractionated with 0·5 mL of ethyl acetate and the organic phase was transferred to another tube and dried under N2 gas flow. The material was methylated with diazomethane, dried under N2 gas flow and re-suspended in ethyl acetate. The analysis was performed on a Hewlett-Packard (Wilmington, DE, USA) gas chromatograph model 6890 coupled to a mass spectrometer model 5973 in selective ion monitoring mode (GC-MS-SIM). The chromatograph was equipped with an HP-1701 column (30 m, ID 0·25 mm, 0·50 μm thick internal film) using helium as the carrier gas at a flow rate of 4 mL min–1 in the following program: 3 min at 150 °C, followed a ramp by 5 °C min–1 to 210 °C and 15 °C min–1 to 260 °C. Ions with a mass ratio/charge (m/z) of 130 and 189 (corresponding to endogenous IAA) and 136 and 195 (corresponding to [13C6]IAA), and also ions with (m/z) 134, 162 and 190 (corresponding to endogenous ABA) and 138, 166 and 194 (corresponding to [2H6]ABA) were monitored. Concentrations were calculated based on extracted chromatograms at m/z 130 and 136 for IAA and 162 and 266 for ABA. The extractions were performed in triplicate.
Enzyme extraction and assays
Frozen rhizophore samples were pulverized in liquid N2 and homogenized in 0·05 m McIlvaine buffer (pH 5·5); (1:3, w/v) containing 2 mm EDTA, 2 mm β-mercaptoethanol, 5 mm ascorbic acid and 10 % polyvinylpolypyrrolidone (PVPP; w/w) as in Asega and Carvalho, (2004). Proteins were precipitated with (NH4)2SO4 at 80 % saturation, and re-suspended in the ratio of approx. 10 g fresh mass equivalent per mL in extraction buffer. The final extract was used for enzyme assays and protein determination (Bradford, 1976), using bovine serum albumin as standard. Enzymes were assayed by incubation of the protein extract with different substrates mixed 1:1 (v/v). Substrates were prepared in 0·05 m McIlvaine buffer (pH 4·5 for 1-FEH, and pH 5·5 for 1-SST and 1-FFT). The extracts were incubated at 30 °C at a final concentration of 0·2 m sucrose (Sigma-Aldrich) for 1-SST, 0·2 m 1-kestose for 1-FFT and 5 % inulin from C. obovata for 1-FEH activity. Incubation time was 1 h for 1-SST and 1-FEH, and 2 h for 1-FFT. For determination of 1-SST, 1-FFT and 1-FEH activities, samples of the reaction mixtures were diluted and analysed using high-performance anion exchange chromatography with pulsed amperometric detection (HPAEC/PAD) with a 2 × 250 mm CarboPac PA-1 column on a Dionex system (model ICS 3000, Dionex, Sunnyvale, CA, USA), as described in Oliveira et al. (2013). The activities of 1-FEH, 1-SST and 1-FFT were calculated by direct measurement of fructose, 1-kestose and nystose, respectively, using the external standard method. All procedures were done at 5 °C and extractions were performed in triplicate.
Soluble carbohydrate analyses
Soluble carbohydrates were extracted from freeze-dried rhizophores (Portes and Carvalho, 2006). The crude extract was submitted to ethanol precipitation and the fructo-oligosaccharide [hexoses, sucrose and fructans with degree of polymerization (DP) 3–27] and fructo-polysaccharide (mainly fructans with DP 10–60) fractions were separated by centrifugation. Free and combined fructose was measured in crude extracts and in the two fractions separately, using a ketose-specific modification of the anthrone reaction and fructose (Sigma-Aldrich) as standard (Jermyn, 1956), and the fructo-oligo:fructo-polysaccharide ratio was calculated. Soluble carbohydrates in crude extracts were de-ionized through ion exchange columns (Carvalho and Dietrich, 1993), and analysed using HPAEC/PAD with the same conditions as described above for 1-FEH activity analysis. Extractions were performed in quadruplicate.
Total RNA extraction and gene expression analysis
Total RNA was isolated from the proximal and distal regions of rhizophores from plants in sprouting (S1 and S3), vegetative (V1) and dormant (D) phases, using an RNeasy Plant Mini Kit (Qiagen). For cDNA synthesis, duplicates of 1 μg of total RNA from each sample were treated with DNase I, RNase-free (Thermo Scientific) and then reverse transcribed using random hexamers and RevertAid H Minus Strand cDNA Synthesis (Thermo Scientific).
The quantitative real-time PCRs (qRT-PCRs) were performed in technical triplicates using the reagent EXPRESS SYBR GreenER qPCR SuperMix (Invitrogen) in a thermocycler Mastercycler® ep realplex 2S (Eppendorf AG, Hamburg, Germany) with the following program: 2 min at 50 °C, 2 min at 95 °C followed by 40 cycles of 15 s at 94 °C, 1 min at 60 °C. For the melting curve, the temperature was increased gradually over 20 min, from 60 to 95 °C. The mRNA expression values were determined according to Pfaffl (2001), relative to the vegetative phase (control). Relative gene expression analysis was performed for 1-FEH and 1-SST genes, and expression levels were normalized to the reference genes elongation factor (EF) and 18S rRNA (18S), which were ranked as the most stable reference genes for gene expression analysis in C. intybus (Maroufi et al., 2010). For primer details, see Supplementary Data Table S1. The primer specificity was validated by melting curves showing amplification of a single product. PCR efficiencies varied from 93 to 99 %. Results were obtained from two biological replicates and a duplicate of the reverse transcription step, as suggested by Bustin et al. (2009).
Statistical analyses
The correlation coefficients were calculated between edaphoclimatic, biochemical and physiological parameters – temperature, precipitation, soil moisture, water content of plants, water potential of rhizophores, phytohormone and soluble carbohydrate contents, and enzyme activities – using Pearson’s correlation. Statistical significance of results was tested using independent Student’s t-tests. One-way analyses of variance (ANOVAs) were performed using the software SISVAR 4·2 for comparison of the means over the sampling period. When significant differences were found, a post-hoc Tukey’s honestly significantly different (HSD) test was also performed at P ≤ 0·05. Data of distal and proximal rhizophore segments were also compared at each sampling date with one-way ANOVA. Principal component analysis (PCA) was carried out using the following parameters: average precipitation and temperature, water content in aerial organs, water content and water potential of rhizophores, and biochemical and physiological parameters. PCA was performed from the correlation matrix with data transformed by logarithm [(log (x + 1)]. The randomization test (999 permutations) was used to choose the PCA interpretation dimension (P < 0·05) using the program PC-ORD 6.0.
RESULTS
Water status of soil and plants
In accordance with the highest accumulated precipitation shown in Fig. 1B, soil moisture was highest in the vegetative phase (V1) (Fig. 2A). At early dormancy (ED), the highest water potential was observed (–0·52 MPa in proximal and −0·6 MPa in distal segments), while in sprouting (S1 and S3) and vegetative (V2) phases, the lowest values were detected (between −0·73 and −0·92 MPa in both segments), without marked differences between distal and proximal segments (Fig. 2B). Water content in the aerial organs remained constant during sprouting and vegetative phases, differing significantly only at ED. In S1 and dormancy (D), the plants presented no aerial organs (Fig. 2C). In rhizophores, the water content presented small variations throughout the analysed period and remained higher in the proximal segment, in comparison with the distal ones, with significant differences at ED, S1 and D (Fig. 2D).
Fig. 2.
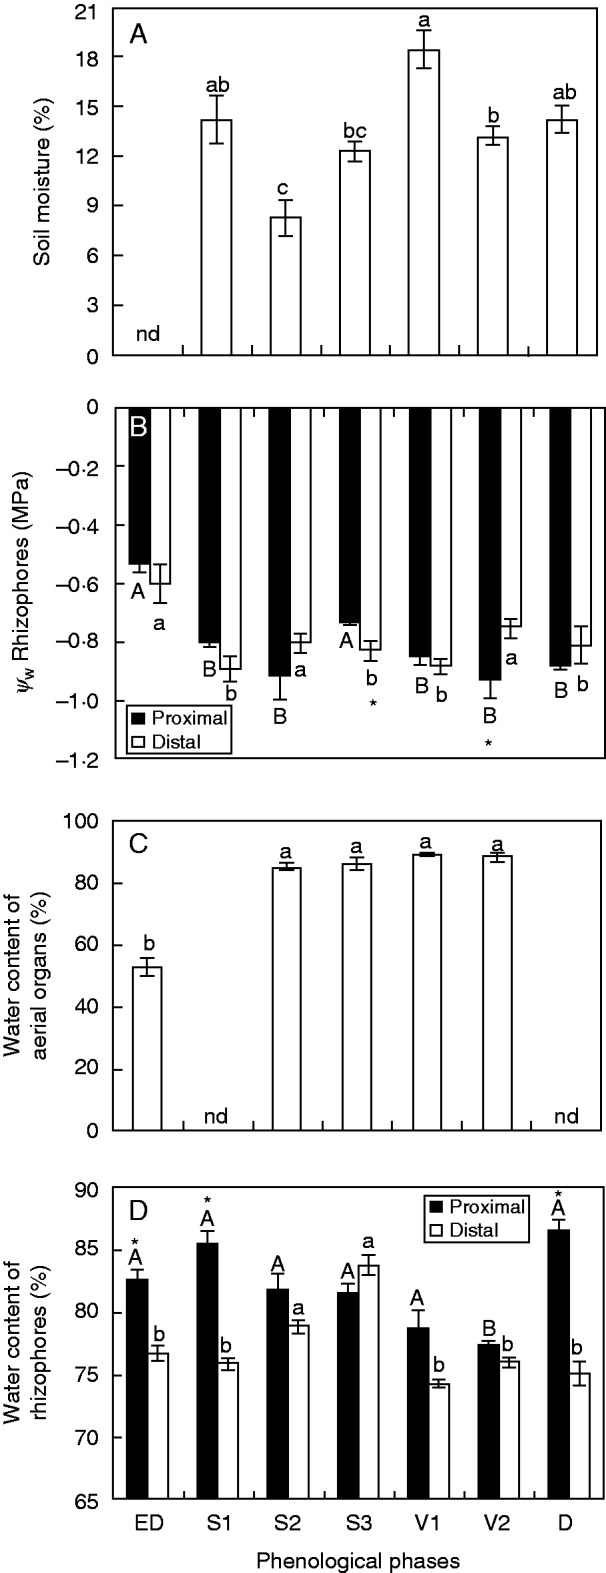
(A) Soil moisture content, (B) water potential (Ψw) in proximal and distal rhizophore segments (as indicated in the key), (C) water content of aerial organs and (D) water content of proximal and distal rhizophore segments of plants of Chrysolaena obovata at different phenological phases. Values are the means ± s.e. (n = 4). Upper case letters indicate a comparison of proximal segments and lower case letters indicate a comparison of distal segments during the experimental period (P < 0·05). An asterisk (*) denotes a comparison of the segments (proximal and distal) within each harvest date (P < 0·05). nd, no data.
Endogenous concentrations of ABA and IAA
The ABA content in the aerial organs tended to increase, from 508 ng g–1 d. wt in S2 to 3868 ng g–1 d. wt in V2, with the lowest content (22 ng g–1 d. wt) at ED (Fig. 3A). Stages S1 and D were not sampled due to lack of aerial organs. In rhizophores, no variation in ABA contents between proximal and distal segments occurred, except at D, when the distal segment presented a value significantly higher than the proximal one. The highest ABA concentrations were found in the proximal segment at V2 (3031 ng g–1 d. wt), and the lowest, during sprouting (S1 and S2), with values near zero (Fig. 3B).
Fig. 3.
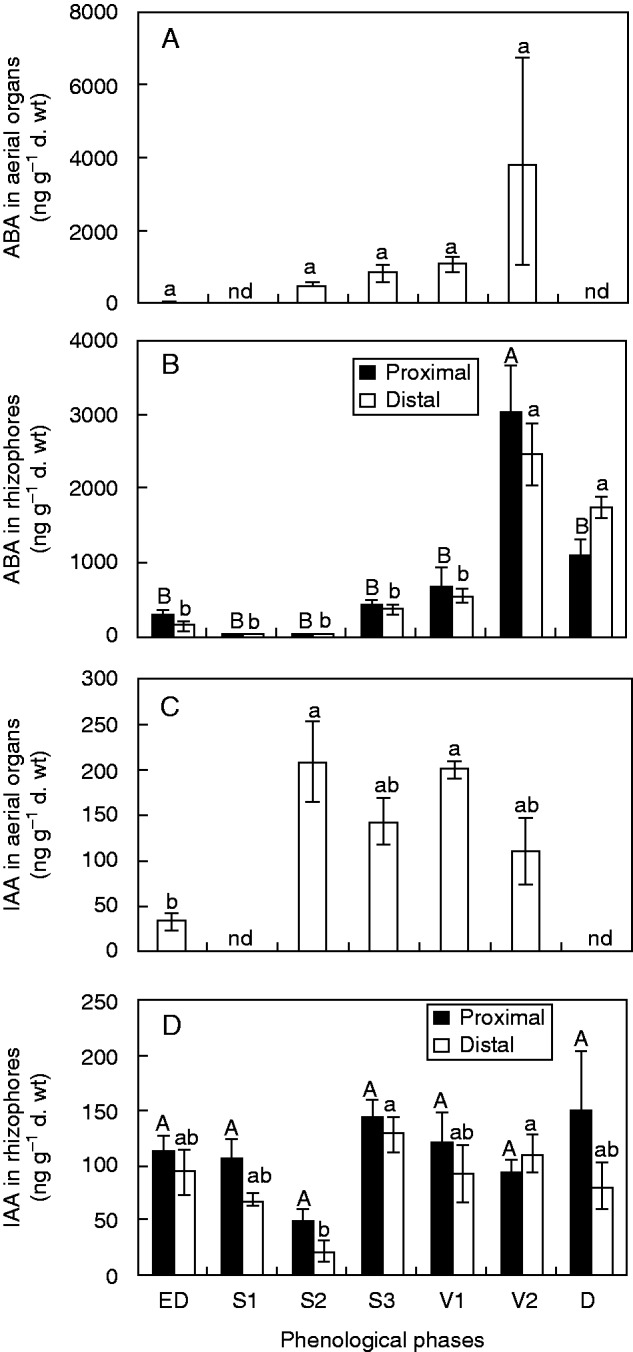
(A) ABA content in the aerial organs and (B) in the proximal and distal rhizophore segments (as indicated in the key), and (C) IAA content in the aerial organs and (D) in the proximal and distal rhizophore segments of plants of Chrysolaena obovata at different phenological phases. Values are the means ± s.e. (n = 3). Upper case letters indicate a comparison of proximal segments and lower case letters indicate a comparison of distal segments during the experimental period (P < 0·05). An asterisk (*) denotes a comparison of the segments (proximal and distal) within each harvest date (P < 0·05). nd, no data.
An opposite profile was observed for IAA contents in aerial organs; the value detected at V2 (110 ng g–1 d. wt), was twice as low as in S2 (208 ng g–1 d. wt) (Fig. 3C), although no statistical differences were detected. IAA in rhizophores showed no significant differences between the two segments, and the lowest value was detected in S2 (20 ng g–1 d. wt in the distal segment; Fig. 3D).
Soluble carbohydrates
Fructo-polysaccharide contents did not vary significantly among the proximal segments during the analysed period. Among the distal segments, a difference was observed only between S3 and D. In the latter, the content in the distal segements was significantly higher than in the proximal segment (Fig. 4A). Conversely, fructo-oligosaccharide contents did not differ between the rhizophores segments; however, values differed among phenological phases, with the lowest values sampled during sprouting (Fig. 4B).
Fig. 4.
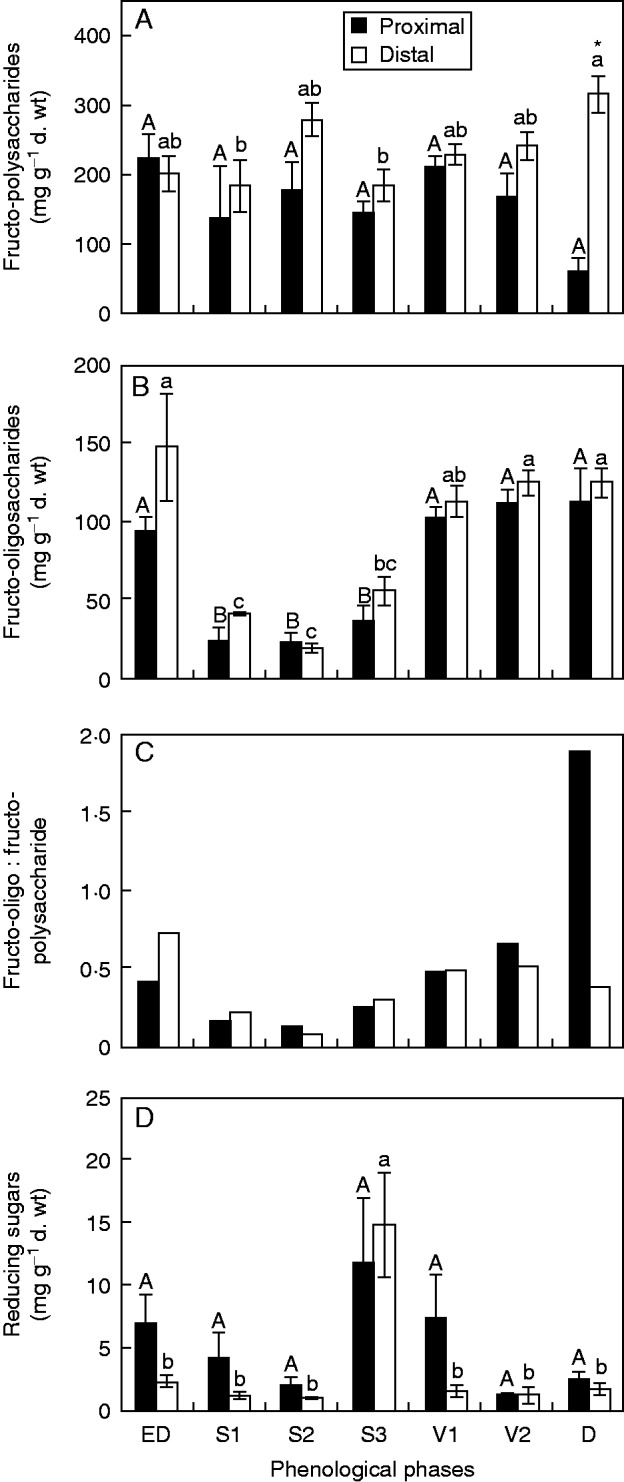
(A) Fructo-polysaccharides, (B) fructo-oligosaccharides, (C) fructo-oligo:fructo-polysaccharides ratio and reducing sugars (D) in the proximal and distal rhizophore segments (see key) of plants of Chrysolaena obovata at different phenological phases. Upper case letters indicate a comparison of proximal segments and lower case letters indicate a comparison of distal segments during the experimental period (P < 0·05). An asterisk (*) denotes a comparison of the segments (proximal and distal) within each harvest date (P < 0·05).
The sharp reduction of fructo-oligosaccharides during sprouting is evidenced by the fructo-oligo:fructo-polysaccharides ratio, and the increase in this ratio in proximal segments at D was due to a reduction of fructo-polysaccharides (Fig. 4C).
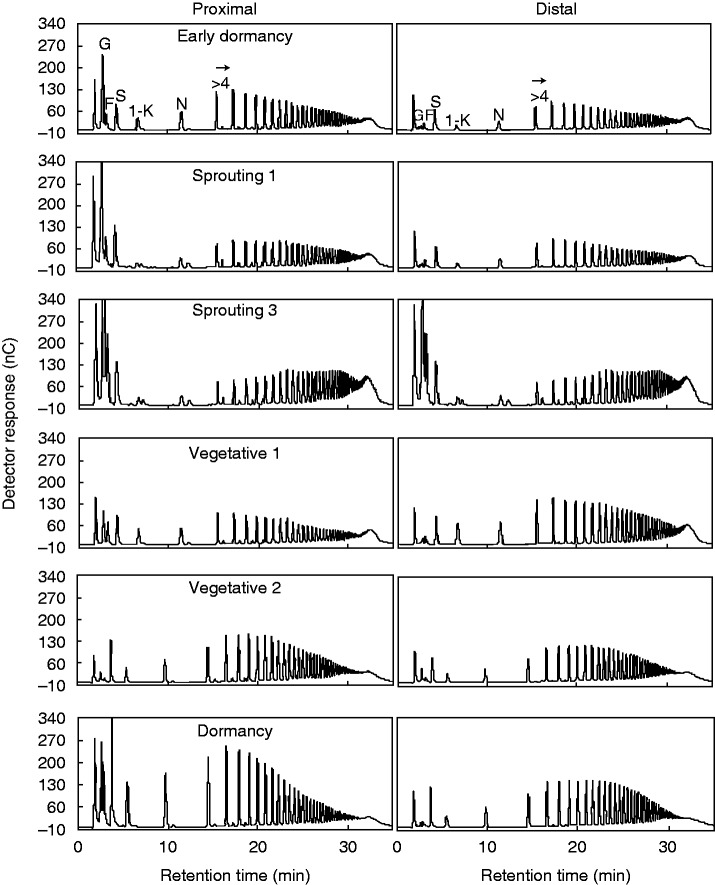
Reducing sugars showed a decreasing tendency from ED to S2, followed by an increase at S3, and a further decrease until D (Fig. 4D). These results were also observed in the chromatographic profiles, with an increase of the hexoses glucose and fructose during sprouting, especially at S3 (Fig. 5). In the proximal segment, following V1 and until D, a gradual increase in fructans with medium DP (5–15) was observed. In the distal segment, an increase in the 1-kestose peak was detected only at V1.
Fig. 5.
HPAEC/PAD profiles of total fructans of proximal (left) and distal (right) rhizophore segments of plants of Chrysolaena obovata at different phenological phases. G, glucose; F, fructose; S, sucrose; 1-K, 1-kestose; N, nystose; >4, fructans with DP higher than 4.
Enzyme activities and gene expression of fructan metabolism
The activity of 1-FEH was highest in the proximal segments of rhizophores throughout the experimental period, with significant differences between the two segments in S1, V1 and V2. Moreover, the overall activities were higher during sprouting (Fig. 6A). The 1-FEH gene showed higher expression during sprouting, being five times more greatly expressed in the proximal segment at S3 (Fig. 7A). The 1-FEH transcript abundance showed a moderate increase in distal segments, twice as high as at the vegetative stage (V1), used as the reference (Fig. 7A).
Fig. 6.
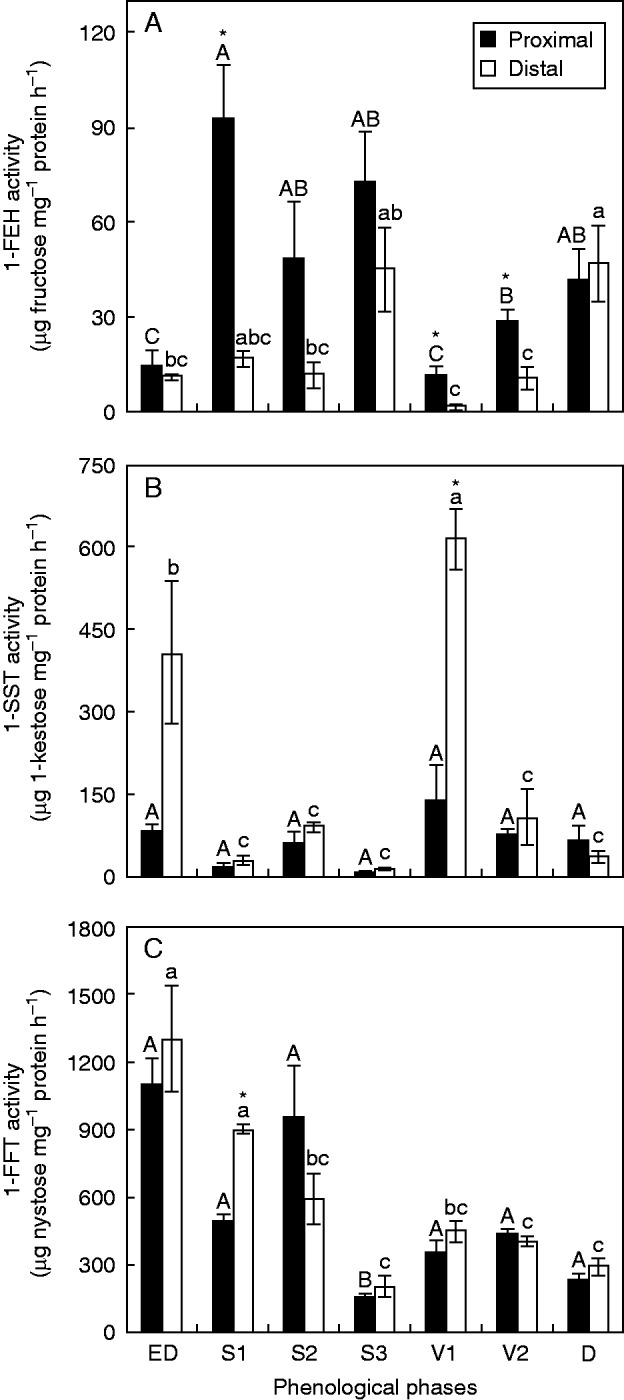
1-FEH (A), 1-SST (B) and 1-FFT (C) activities in the proximal and distal rhizophore segments (see key) of plants of Chrysolaena obovata at different phenological phases. Values are the means ± s.e. (n = 3). Upper case letters indicate a comparison of proximal segments and lower case letters indicate a comparison of distal segments during the experimental period (P < 0·05). An asterisk (*) denotes a comparison of the segments (proximal and distal) within each harvest date (P < 0·05).
Fig. 7.
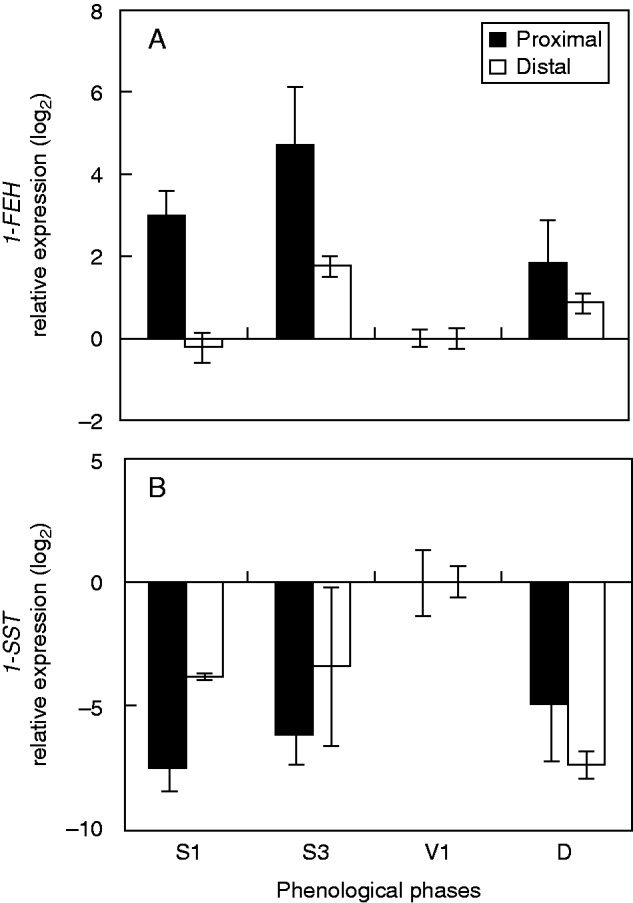
Relative expression levels (log2) of 1-FEH (A) and 1-SST (B) as assessed by qRT-PCR analysis in the proximal and distal rhizophore segments (see key) of plants of Chrysolaena obovata at different phenological phases (compared with the vegetative phase). Values are means (±s.e.) of two biological replicates with three technical replicates.
In contrast, 1-SST showed the lowest activities during sprouting and was most active in the distal segments at ED and V1 (Fig. 6B). The 1-SST gene showed the highest expression in V1, with a marked inhibition at S1, S3 and D (Fig. 7B).
The enzyme 1-FFT remained active through all the phenological phases analysed, with a marked decrease at S3 and higher activity at ED, S1 and S2 (Fig. 6C). The activity was significantly higher in the distal segment only at S1.
Principal component analysis
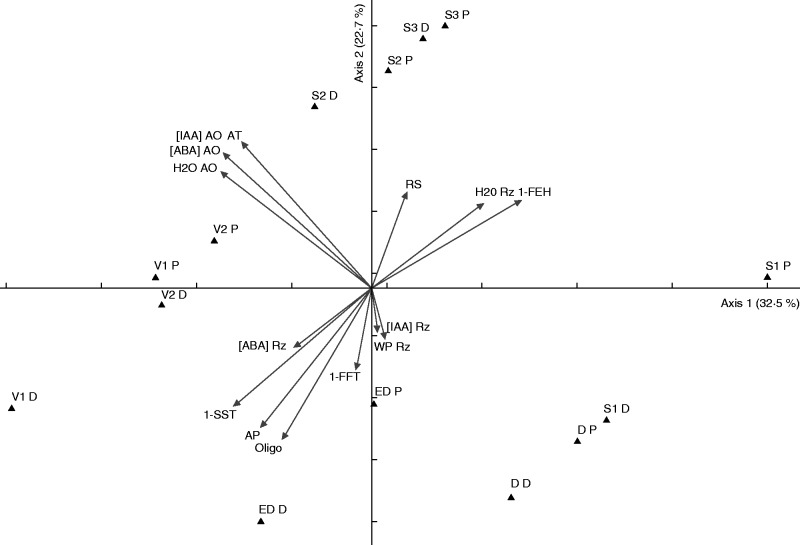
Principal component analysis summarized 55·2 % of the total data variability on the two first axes (Fig. 8), which were considered significant at the randomization test (P < 0·005). All the samplings at sprouting, except for the distal segments at S2, and at D were positioned on the positive side of axis 1, which indicated a correlation with rhizophore water content (r > 0·5) and 1-FEH activity (1-FEH) (r > 0·7). Conversely, on the negative side of axis 1, distal segments at S2, distal segments at ED and all the samplings of the vegetative phase were correlated with average temperature (AT) (r > –0·6), average precipitation (AP) (r > –0·58), water content (H2O AO), ABA ([ABA] AO) and IAA ([IAA] AO) concentrations in aerial organs and 1-SST activity (1-SST) (r > –0·7). Concerning axis 2, the proximal segments at the vegetative phases, and all samplings of S2 and S3 were correlated with ABA and IAA concentrations in aerial organs (r > 0·58) and average temperature (r > 0·6), and also water content in aerial organs (r > 0·5), while ED and D were correlated with fructo-oligosaccharide contents (r > –0·6), and average precipitation (r > –0·6). Consequently, the PCA axes showed the relationship of environmental and endogenous variations and the phenological phases of C. obovata.
Fig. 8.
PCA bi-plot of Chrysolaena obovata at different phenological phases and environmental and endogenous parameters. Water content in aerial organs (H2O AO) and rhizophore (H2O Rz), water potential in rhizophore (WP Rz), temperature (AT) and precipitation (AP) average, ABA contents in aerial organs ([ABA] AO) and rhizophore ([ABA] Rz), IAA contents in aerial organs ([IAA] AO) and rhizophore ([IAA] Rz), fructo-oligosaccharide (Oligo) and reducing sugar (RS) contents, and 1-FEH, 1-SST and 1-FFT activities. Abbreviations for phenological phases are followed by P for proximal, and D for distal rhizophore segments.
DISCUSSION
This work describes for the first time changes in fructan metabolism and in endogenous concentrations of ABA and IAA associated with climatic conditions and water status during the developmental cycle of a Cerrado species growing naturally in the field. We hypothesized that endogenous concentrations of hormones have a regulatory role in determining the transition between different phenological phases and in the induction of changes in fructan metabolism under field conditions.
Changes observed at ED suggest an increase in sink strength of the rhizophore at this stage, evidenced by the increase in 1-SST and 1-FFT activities and in fructo-oligosaccharides, mainly in distal segments. Since the reserve tissues accumulate high fructan contents, the increase in IAA in these tissues might be an important factor for cell expansion, necessary for the accumulation of reserve compounds. At this stage, photoassimilates from the senescing aerial organs are translocated to the underground reserve organ and used as substrate for fructan synthesis in a similar way to that reported for plants of the same species with fully established aerial organs (Portes and Carvalho, 2006) or under high atmospheric CO2 concentration (Oliveira et al., 2010) whose assimilated carbon, in excess for the aerial organs, is translocated downwards.
Following senescence and abscission of aerial organs at the dormant stage, sprouting of new shoots occurred at the end of winter, coinciding with the increase in temperature and a slight and gradual increase in precipitation (S1). At this stage, ABA concentrations were low, allowing sprouting of new shoots, similar to the report of Chope et al. (2006) for sprouting bulbs of A. cepa. The higher 1-FFT activity may have promoted a reduction of fructan chain sizes, thus facilitating hydrolysis by 1-FEH to supply the energy required for sprouting at S1 by the mobilization of fructo-oligosaccharides (r = – 0·79, P < 0·05). The increase in the proportion of hexoses and sucrose, associated with the increase in 1-FEH activity and expression, confirm the proximal region as the main site of fructan hydrolysis during sprouting as previously reported for this species (Asega and Carvalho, 2004; Portes and Carvalho, 2006; Asega et al., 2011).
As sprouting and shoot growth progressed (S2), the expansion of photosynthetically active tissues was accompanied by a high IAA content. The low reducing sugar content observed in the rhizophores in the initial phases of sprouting (S1, S2) indicates a fast translocation towards the growing aerial organs. When the aerial organs are fully established (S3), the need for carbon supply decreases and accumulation of reducing sugars is detected, suggesting the transition of rhizophores from source to sink organs. This sink function is in accordance with the high IAA content in the rhizophores, probably acting in cell expansion necessary for reserve accumulation, as shown for tubers of Helianthus tuberosus (Schubert and Feuerle, 1997). The increase in fructan synthesis was also detected in callus of Viguiera discolor (Itaya et al., 2005) and in plants of A. tequilana (Barreto et al., 2010) supplied with auxin in vitro, giving support to the hypothesis of a relationship between this growth regulator and fructan metabolism.
Specific primers for relative gene expression analyses were designed on the sequence of 1-FEH from C. obovata for which the activity of inulin hydrolysis was confirmed (Asega et al., 2008). In the present study, higher transcript accumulation detected in rhizophores during natural sprouting in the field is consistent with the increase in 1-FEH activity, suggesting a transcriptional regulation of 1-FEH, as previously observed for induced sprouting conditions (Asega et al., 2011).
The increase in sucrose and reducing sugars at the end of sprouting induced the reduction of 1-FEH activity at the beginning of the vegetative phase (V1), by feedback regulation. This may have triggered fructan biosynthesis (Pollock and Cairns, 1991), through the downward translocation of photoassimilates from the established aerial organs with the subsequent increase of sink capacity of the rhizophores and 1-SST activity and expression, correlated with precipitation (AP × 1-SST = 0·87, P < 0·05). Accordingly, when supplied to plants of C. obovata cultivated in vitro, sucrose, glucose and fructose inhibited 1-FEH and promoted 1-SST gene expression (F. Trevisan et al., Instituto de Botânica, São Paulo, Brazil, pers. comm.)
Opposing activities and expression profiles of 1-SST and 1-FEH (r = – 0·9, P < 0·05) were detected, providing evidence that plants growing naturally in the Cerrado present a similar behaviour in this respect to that observed in cultivated plants (Asega and Carvalho, 2004; Portes and Carvalho, 2006; Oliveira et al., 2010), supporting the hypothesis of a temporal control of fructan-metabolizing enzymes in the vacuole, under the regulation of sucrose, which activates 1-SST (Wagner and Wienkem, 1986) and inhibits 1-FEH (Marx et al., 1997).
The marked decrease in 1-SST activity towards V2, also detected by Portes and Carvalho (2006) throughout the vegetative stage, is accompanied by an increase in sucrose content and higher concentrations of ABA. Gusta et al. (2005) suggested a relationship between increasing concentrations of ABA and sugar concentration to confer cold tolerance, and refer to studies in which high concentrations of glucose and/or sucrose are associated with high concentrations of ABA. In the present study, V2 was accompanied by low temperature and precipitation, with a decrease in water potential (Ψw) of the rhizophore, and the signal to maintain the water status of the plants under low water availability may have been provided by ABA.
Environmental and physiological changes observed at this stage signalled the beginning of dormancy (D), marked by an increase in 1-FEH activity, and a higher fructo-oligo:fructo-polysaccharide ratio and water content in rhizophores, all of these converging to osmoregulation, drought and cold tolerance, and energy supply.
Temperature and precipitation values measured throughout the year matched the expected indexes for the Cerrado biome, especially for the studied area, with low precipitation during winter, reflected in low soil moisture and a high temperature range (Vuono et al., 1986; Coutinho, 2002). However, the variation of water availability during the year was not sufficient to promote changes in plant water status, in contrast to what was observed in field experiments with Dactylis glomerata L. and Lolium perenne L. (Volaire et al., 1998) and in potted plants of C. obovata (Garcia et al., 2011) and V. discolor (Oliveira et al., 2013) under water withholding. It is important to point out that rhizophores of potted plants dry out faster than in natural field conditions, due to the limited volume of soil surrounding it. Our results suggest that in the Cerrado, plants of C. obovata present strategies to maintain the water status during the dry season, similar to what was detected in plants of Gomphrena marginata Seub. in field conditions (Silva et al., 2013).
Recent works suggest that auxin is also involved in tolerance to drought and cold stress; however, the precise role of this phytohormone in abiotic stress responses remains largely unknown. As recently shown by Shi et al. (2014), transgenic lines of A. thaliana with higher endogenous auxin concentrations show enhanced resistance to drought, by positively modulating some ABA-responsive genes and the accumulation of different metabolites with an osmotic function such as amino acids, organic acids, sucrose and other carbohydrates. The results reinforce the cross-talk between these two phytohormones in response to abiotic stresses, previously reported by Du et al. (2012). These authors showed that overexpressing a gene involved in the maintenance of IAA homeostasis in rice resulted in reduced ABA concentrations and increased resistance to cold stress. The maintenance of IAA homeostasis in aerial organs and rhizophores throughout the phenological cycle and the decline of ABA concentrations in the transition from vegetative to dormant phases, the coldest and driest season in the Cerrado, suggest that both hormones may be essential for C. obovata to cope with the climatic conditions during winter.
The PCA confirms what was pointed out previously, indicating the influence of 1-FEH in sprouting, especially in S1, and 1-SST in vegetative periods, as well as their opposing activities. The relationship found between temperatures, ABA, IAA and water contents in aerial organs with phases in which plants presented developing or well-established aerial organs (including ED) was opposite to that in which plants did not have aerial organs and temperatures were lower, such as dormancy and the beginning of sprouting. The association between ABA in the rhizophore and early dormancy, in spite of the high 1-SST activity, indicated the entry of plants in dormancy.
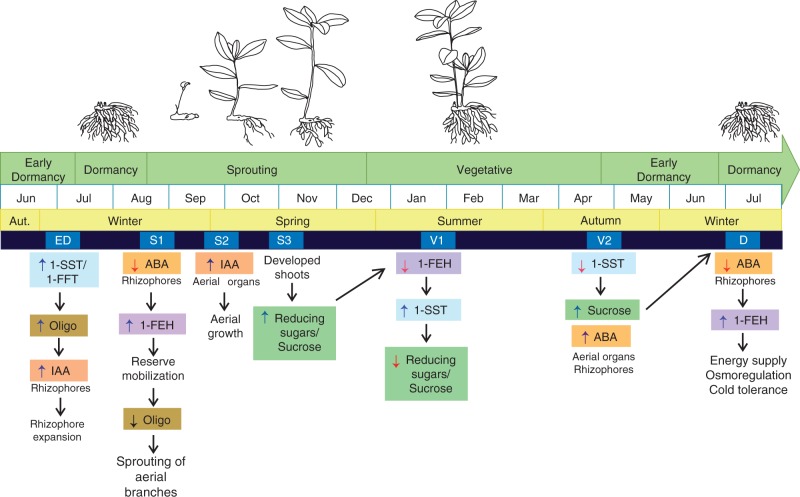
The diagram presented in Fig. 9 summarizes the phenological phases of C. obovata, its mechanisms of adaptation and the strategies to endure abiotic stresses prevailing in the Cerrado. Chrysolaena obovata is able to up- and downregulate fructan metabolism in response to environmental changes, enabling plants to undergo unfavourable periods. Endogenous hormone concentrations seem to be related to regulation of fructan metabolism and to the transition between phenophases, signalling for energy storage, reserve mobilization and accumulation of oligosaccharides as osmolytes. In addition, variation in hormonal contents could directly contribute to tolerance to abiotic stresses, modulating pathways other than just those related to carbohydrates, not accessed in this study. Temperature and photoperiod could be other signals for the transition between phenophases; however, other environmental factors, such as radiation levels and relative air humidity, must also be considered in future studies.
Fig. 9.
Diagram representing the main phenological phases of Chrysolaena obovata and the concurrent physiological and biochemical changes observed.
SUPPLEMENTARY DATA
Supplementary data are available online at www.aob.oxfordjournals.org and consist of the following. Figure S1: image of C. obovata, highlighting the proximal and distal regions of rhizophores. Figure S2: soil water retention curves. Table S1: list of primers used for qRT-PCR.
ACKNOWLEDGEMENTS
We thank the Instituto Agronômico de Campinas (Núcleo de Irrigação e Drenagem) for performing the water soil retention analysis, E. A. Silva and C. Ferragut for helping with analyses of water status and PCA, respectively, J. del Giudice for support during field work at the Biological Reserve, F. Trevisan for technical support in qRT-PCR expression analysis, and R. C. L. Figueiredo-Ribeiro for scientific advice. This work was supported by Conselho Nacional de Desenvolvimento Científico e Tecnológico-CNPq (grant no. 478005/2011-3) and Plano Nacional de Apoio ao Desenvolvimento da Botânica/Coordenação de Aperfeiçoamento de Pessoal de Nível Superior–PNADB/CAPES (grant no. 454/2010). A.P.R. was financially supported by PNADB/CAPES, and M.A.M.C. is a CNPq Research Fellow.
LITERATURE CITED
- Asega AF, Carvalho MAM. 2004. Fructan metabolising enzymes in rhizophores of Vernonia herbacea upon excision of aerial organs. Plant Physiology and Biochemistry 42: 313–319. [DOI] [PubMed] [Google Scholar]
- Asega AF, Nascimento JRO, Schroeven L, Van den Ende W, Carvalho MAM. 2008. Cloning, characterization and functional analysis of 1-FEH cDNA from Vernonia herbacea (Vell.) Rusby. Plant and Cell Physiology 49: 1185–1195. [DOI] [PubMed] [Google Scholar]
- Asega AF, Nascimento JR, Carvalho MAM. 2011. Increased expression of fructan 1-exohydrolase in rhizophores of Vernonia herbacea during sprouting and exposure to low temperature. Journal of Plant Physiology 168: 558–565. [DOI] [PubMed] [Google Scholar]
- Barreto R, Nieto-Sotelo J, Cassab GI. 2010. Influence of plant growth regulators and water stress on ramet induction, rosette engrossment, and fructan accumulation in Agave tequilana Weber var. Azul. Plant Cell, Tissue and Organ Culture 103: 93–101. [Google Scholar]
- Batalha MA, Mantovani W. 2000. Reproductive phonological patterns of Cerrado plant species at the pé-de-gigante reserve (Santa Rita do Passa Quatro, SP, Brazil): a comparison between the herbaceous and woody floras. Revista Brasileira de Biologia 60: 129–145. [DOI] [PubMed] [Google Scholar]
- Blake GR. 1965. Bulk density. In: Black CA, Evans DD, White JL, Ensminger LE, Clark FE, eds. Methods of soil analysis. Madison, WI: American Society of Agronomy, 374–390. [Google Scholar]
- Bradford MM. 1976. A rapid and sensitive method for quantification of microgram quantities of proteins utilizing the principle of protein–dye binding. Analytical Biochemistry 72: 248–254. [DOI] [PubMed] [Google Scholar]
- Bravo LA, Zúñiga GE, Alberdi M, Corcuera LJ. 1998. The role of ABA in freezing tolerance and cold acclimation in barley. Physiologia Plantarum 103: 17–23. [Google Scholar]
- Bustin SA, Benes V, Garson JA, et al. 2009. The MIQE guidelines: minimum information for publication of quantitative real-time PCR experiments. Clinical Chemistry 55: 611–622. [DOI] [PubMed] [Google Scholar]
- Carvalho MAM, Dietrich SMC. 1993. Variation in fructan content from underground organs of Vernonia herbacea (Vell.) Rusby in different phenological phases. New Phytologist 123: 735–740. [Google Scholar]
- Carvalho MAM, Asega FA, Figueiredo-Ribeiro RCL. 2007. Fructans in Asteraceae from Brazilian Cerrado. In: Norio S, Noureddine B, Shuichi O, eds. Recent advances in fructooligosaccharides research. Kerala, India: Research Signpost, 69–91. [Google Scholar]
- Chope GA, Terry LA, White PJ. 2006. Effect of controlled atmosphere storage on abscisic acid concentration and other biochemical attributes of onion bulbs. Postharvest Biology and Technology 39: 233–242. [Google Scholar]
- Coutinho LM. 2002. Eugen Warming e o Cerrado Brasileiro: um século depois. A.L. Klein, org. São Paulo: UNESP/Imprensa oficial do Estado de São Paulo. [Google Scholar]
- Cruz ACR, Libardi PL, Carvalho LA, Rocha GC. 2005. Balanço de água no volume de solo explorado pelo sistema radicular de uma planta de citrus. Revista Brasileira de Ciência do Solo 29: 1–10. [Google Scholar]
- Dias BFS. 1992. Cerrados: uma caracterização. In: Dias BFS, ed. Alternativas de desenvolvimento dos Cerrados: Manejo e Conservação dos Recursos Naturais Renováveis. Brasília, DF, Brazil. [Google Scholar]
- Du H, Wu N, Fu J, et al. 2012. A GH3 family member, OsGH3-2, modulates auxin and abscisic acid levels and differentially affects drought and cold tolerance in rice. Journal of Experimental Botany 63: 6467–6480. [DOI] [PMC free article] [PubMed] [Google Scholar]
- Eiten G. 1972. The Cerrado vegetation of Brazil. Botanical Review 38: 201–341. [Google Scholar]
- Garcia PMA, Asega AF, Silva EA, Carvalho MAM. 2011. Effect of drought and re-watering on fructan metabolism in Vernonia herbacea (Vell.) Rusby. Plant Physiology and Biochemistry 49: 664–670. [DOI] [PubMed] [Google Scholar]
- Gusta LV, Thischuk R, Weiser CJ. 2005. Plant cold acclimation: the role of abscisic acid. Journal of Plant Growth Regulation 24: 308–318. [Google Scholar]
- Hendry GAF. 1987. The ecological significance of fructan in a contemporary flora. New Phytologist 106: 201–216. [Google Scholar]
- Hendry GAF, Wallace RK. 1993. The origin, distribution and evolutionary significance of fructans. In: Suzuki M, Chatterton JN, eds. Science and technology of fructans. Boca Raton, FL: CRC Press, 119–139. [Google Scholar]
- Hincha DK, Livingston IDP, Premakumar R, et al. 2007. Fructans from oat and rye: composition and effects on membrane stability during drying. Biochimica et Biophysica Acta 1768: 1611–1619. [DOI] [PubMed] [Google Scholar]
- Isejima EM, Figueiredo-Ribeiro RCL. 1993. Dynamics of fructans in tuberous roots of Viguiera discolor Baker (Asteraceae) as influenced by phenology. Plant and Cell Physiology 34: 723–727. [Google Scholar]
- Itaya NM, Vaz APA, Kerbauy GB, Figueiredo-Ribeiro RCL. 2005. Produção de frutanos em calos e plântulas clonadas in vitro de Viguiera discolor Baker (Asteraceae). Acta Botanica Brasilica 19: 579–586. [Google Scholar]
- Jermyn MA. 1956. A new method for the determination of ketohexoses in presence of aldohexoses. Nature 177: 38–39. [Google Scholar]
- Kawakami A, Sato Y, Yoshida M. 2008. Genetic engineering of rice capable of synthesizing fructans and enhancing chilling tolerance. Journal of Experimental Botany 59: 793–802. [DOI] [PubMed] [Google Scholar]
- Ludwig-Müller J, Georgiev M, Bley T. 2008. Metabolite and hormonal status of hairy root cultures of Devil’s claw (Harpagophytum procumbens) in flasks and in bubble column bioreactor . Process Biochemistry 43: 15–23. [Google Scholar]
- Maroufi A, Bockstaele EV, De Loose M. 2010. Validation of reference genes for gene expression analysis in chicory (Cichorium intybus) using quantitative real-time PCR. BMC Molecular Biology 11: 15. [DOI] [PMC free article] [PubMed] [Google Scholar]
- Marx SP, Nösberger J, Frehner M. 1997. Seasonal variation of fructan-β-fructosidase (FEH) activity and characterization of a β-(2,1)-linkage specific FEH from tubers of Jerusalem artichoke (Helianthus tuberosus). New Phytologist 135: 267–277. [Google Scholar]
- McAdam SAM, Brodribb TJ. 2014. Hormonal dynamics contributes to divergence in seasonal stomatal behavior in a monsoonal plant community. Plant, Cell and Environment 38: 423–432. [DOI] [PubMed] [Google Scholar]
- Michiels A, Van Laere A, Van den Ende W, Tucker M. 2004. Expression analysis of a chicory fructan 1-exohydrolase gene reveals complex regulation by cold. Journal of Experimental Botany 55: 1325–1333. [DOI] [PubMed] [Google Scholar]
- Oliveira VF, Zaidan LBP, Braga MR, Aidar MPM, Carvalho MAM. 2010. Elevated CO2 atmosphere promotes plant growth and inulin production in the cerrado species Vernonia herbacea . Functional Plant Biology 37: 223–231. [Google Scholar]
- Oliveira VF, Silva EA, Zaidan LBP, Carvalho MAM. 2013. Effects of elevated CO2 concentration and water deficit on fructan metabolism in Viguiera discolor Baker. Plant Biology 15: 471–482. [DOI] [PubMed] [Google Scholar]
- Pfaffl MW. 2001. A new mathematical model for relative quantification in real-time RT-PCR. Nucleic Acids Research 29: 2002–2007. [DOI] [PMC free article] [PubMed] [Google Scholar]
- Pilon-Smits EAH, Ebskamp MJM, Paul MJ, Jeuken MJW, Weisbeek PJ, Smeekens SCM. 1995. Improved performance of transgenic fructan accumulating tobacco under drought stress. Plant Physiology 107: 125–130. [DOI] [PMC free article] [PubMed] [Google Scholar]
- Pollock CJ, Cairns AJ. 1991. Fructan metabolism in grasses and cereals. Annual Review of Plant Biology 42: 77–101. [Google Scholar]
- Portes MT, Carvalho MAM. 2006. Spacial distribution of fructans metabolizing enzymes in rhizophores of Vernonia herbacea (Vell) Rusby (Asteraceae) in different developmental phases. Plant Science 170: 624–633. [Google Scholar]
- Portes MT, Figueiredo-Ribeiro RCL, Carvalho MAM. 2008. Low temperature and defoliation affects fructan metabolizing enzymes in different regions of the rhizophores of Vernonia herbacea. Journal of Plant Physiology 165: 1572–1581. [DOI] [PubMed] [Google Scholar]
- Rabbani MA, Maruyama K, Abe H, et al. 2003. Monitoring expression profiles of rice genes under cold, drought, and high-salinity stresses and abscisic acid application using cDNA microarray and RNA gel-blot analyses. Plant Physiology 133: 1755–1767. [DOI] [PMC free article] [PubMed] [Google Scholar]
- Ratter JA, Ribeiro JF, Bridgewater S. 1997. The Brazilian Cerrado vegetation and threats to its biodiversity. Annals of Botany 80: 223–230. [Google Scholar]
- Ruuska SA, Lewis DC, Kennedy G, Furbank RT, Jenkins CLD, Tabe LM. 2008. Large scale transcriptome analysis of the effects of nitrogen nutrition on accumulation of stem carbohydrate reserves in reproductive stage wheat. Plant Molecular Biology 66: 15–32. [DOI] [PubMed] [Google Scholar]
- Santa-Cruz A, Martinez-Rodriguez MM, Perez-Alfocea F, Romero-Aranda R, Bolarin MC. 2002. The rootstock effect on the tomato salinity response depends on the shoot genotype. Plant Science 162: 825–831. [Google Scholar]
- Seki M, Ishida J, Narusaka M, et al. 2002. Monitoring the expression pattern of around 7,000 Arabisopsis genes under ABA treatments using a ful-length cDNA microarray. Functional and Integrative Genomics 2: 282–291. [DOI] [PubMed] [Google Scholar]
- Shi H, Chen L, Ye T, Liu X, Ding K, Chan Z. 2014. Modulation of auxin content in Arabidopsis confers improved drought stress resistance. Plant Physiology and Biochemistry 82: 209–217. [DOI] [PubMed] [Google Scholar]
- Shubert S, Feuerle R. 1997. Fructan storage in tubers of Jerusalem artichoke: characterization of sink strength. New Phytologist 136: 115–122. [Google Scholar]
- Silva FG, Cangussu LMB, Paula SLA, Melo GA, Silva EA. 2013. Seasonal changes in fructan accumulation in the underground organs of Gomphrena marginata Seub. (Amaranthaceae) under rock-field conditions. Theoretical and Experimental Plant Physiology 25: 46–55. [Google Scholar]
- Simon MF, Grether R, Queiroz LP, Skema C, Pennington RB, Hughes CE. 2009. Recent assembly of the Cerrado, a Neotropical plant diversity hotspot, by in situ evolution of adaptations to fire. Proceedings of the National Academy of Sciences, USA 106: 20359–20364. [DOI] [PMC free article] [PubMed] [Google Scholar]
- Trevisan F, Chu EP, Gaspar M, Carvalho MAM. 2014. In vitro culture and fructan production by Vernonia herbacea (Asteraceae). Acta Physiologiae Plantarum 36: 2299–2307. [Google Scholar]
- Trouverie J, Thévenot C, Rocher J-P, Sotta B, Prioul J-L. 2003. The role of abscisic acid in the response of a specific vacuolar invertase to water stress in the adult maize leaf. Journal of Experimental Botany 54: 2177–2186. [DOI] [PubMed] [Google Scholar]
- Valluru R, Van den Ende W. 2008. Plant fructans in stress environments: emerging concepts and future prospects. Journal of Experimental Botany 59: 2905–2916. [DOI] [PubMed] [Google Scholar]
- Van Den Ende W, Michiels A, De Roover J, Van Laere A. 2002. Fructan biosynthetic and breakdown enzynes in dicots evolved from different invertases. Expression of fructan genes throughout chicory development. Scientific World Journal 2: 1281–1295. [DOI] [PMC free article] [PubMed] [Google Scholar]
- Vieira CJ, Braga MR, Figueiredo-Ribeiro RCL. 1995. Fructans in callus of Gomphrena macrocephala St.-Hill. Plant Cell, Tissue and Organ Culture 42: 233–238. [Google Scholar]
- Volaire F, Thomas H, Bertagne N, Burgeois E, Gautier MF, Lelièvre F. 1998. Survival and recovery of perennial forage grasses under prolonged Mediterranean drought. II. Water status, solute accumulation, abscisic acid concentration and accumulation of dehydrin transcripts in bases of immature leaves. New Phytologist 140: 451–460. [DOI] [PubMed] [Google Scholar]
- Vuono YS, Batista EA, Funari FL. 1986. Balanço hídrico na área da Reserva Biológica de Mogi-Guaçu, São Paulo–Brasil. Hoehnea 13: 73–85. [Google Scholar]
- Wagner W, Wiemken A. 1986. Properties and subcellular localization of fructan hydrolase in the leaves of barley (Hordeum vulgare L. cv Gerbil). Journal of Plant Physiology 123: 419–428. [Google Scholar]
- Williams RJ, Myers BA, Muller WJ, Duff GA, Eamus D. 1997. Leaf phenology of woody species in a north Australian tropical savanna. Ecology 78: 2542–2558. [Google Scholar]
- Yang J, Zhang J, Wang Z, Zhu Q, Liu L. 2004. Activities of fructan- and sucrose-metabolizing enzymes in wheat stems subjected to water stress during grain filling. Planta 220: 331–343. [DOI] [PubMed] [Google Scholar]
- Zhang J, Xu Y, Zen W, et al. 2014. A wheat 1-FEH w3 variant underlies enzyme activity for stem WSC remobilization to grain under drought. New Phytologist 205: 293–305. [DOI] [PubMed] [Google Scholar]
- Zhao M, Peng C, Xiang W, et al. 2013. Plant phonological modeling and its application in global climate change research: overview and future challenges. Environmental Reviews 21: 1–14. [Google Scholar]
Associated Data
This section collects any data citations, data availability statements, or supplementary materials included in this article.


