Abstract
Despite major advances in understanding the molecular and genetic basis of cancer, metastasis remains the cause of >90% of cancer-related mortality1. Understanding metastasis initiation and progression is critical to developing new therapeutic strategies to treat and prevent metastatic disease. Prevailing theories hypothesize that metastases are seeded by rare tumour cells with unique properties, which may function like stem cells in their ability to initiate and propagate metastatic tumours2–5. However, the identity of metastasis-initiating cells in human breast cancer remains elusive, and whether metastases are hierarchically organized is unknown2. Here we show at the single-cell level that early stage metastatic cells possess a distinct stem-like gene expression signature. To identify and isolate metastatic cells from patient-derived xenograft models of human breast cancer, we developed a highly sensitive fluorescence-activated cell sorting (FACS)-based assay, which allowed us to enumerate metastatic cells in mouse peripheral tissues. We compared gene signatures in metastatic cells from tissues with low versus high metastatic burden. Metastatic cells from low-burden tissues were distinct owing to their increased expression of stem cell, epithelial-to-mesenchymal transition, pro-survival, and dormancy-associated genes. By contrast, metastatic cells from high-burden tissues were similar to primary tumour cells, which were more heterogeneous and expressed higher levels of luminal differentiation genes. Transplantation of stem-like metastatic cells from low-burden tissues showed that they have considerable tumour-initiating capacity, and can differentiate to produce luminal-like cancer cells. Progression to high metastatic burden was associated with increased proliferation and MYC expression, which could be attenuated by treatment with cyclin-dependent kinase (CDK) inhibitors. These findings support a hierarchical model for metastasis, in which metastases are initiated by stem-like cells that proliferate and differentiate to produce advanced metastatic disease.
To investigate differentiation in metastatic cells, we used a micro-fluidics-based platform (Fluidigm) for multiplex gene expression analysis in individual cells. This facilitated a systems-level approach to study the simultaneous expression of groups of genes and resolve cellular diversity during breast cancer metastasis only achievable at the single-cell level. We designed single-cell experiments to investigate 116 genes involved in stemness, pluripotency, epithelial-to-mesenchymal transition (EMT), mammary lineage specification, dormancy, cell cycle and proliferation (Supplementary Table 1)6–10.
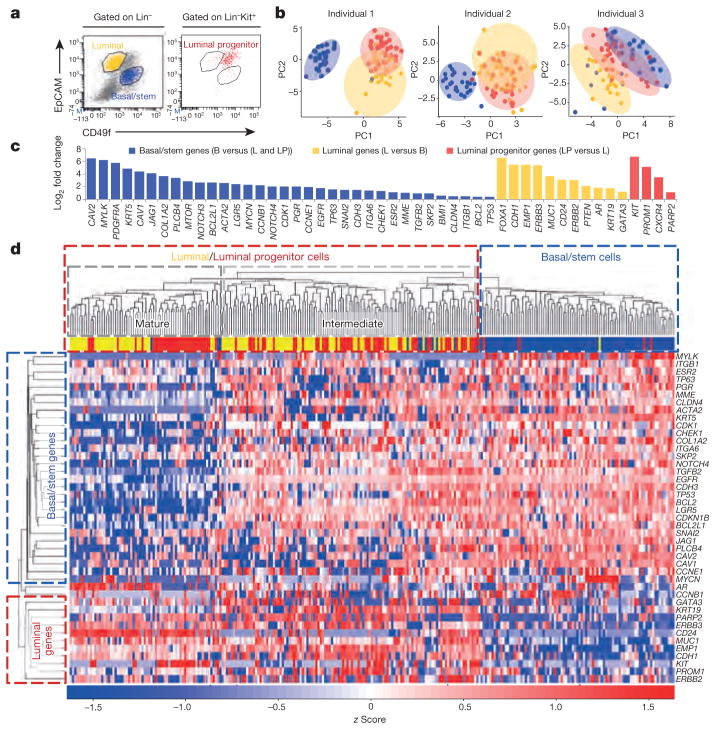
We first developed a single-cell gene expression signature from normal human breast epithelium to generate a reference for analysing differentiation in metastatic cells. The breast contains two epithelial lineages: the basal/myoepithelial lineage that contains stem cells, and a luminal lineage that contains progenitor and mature cell populations. We sorted single basal/stem, luminal, and luminal progenitor cells from reduction mammoplasty samples from three individuals, and processed them according to established protocols (Fig. 1a)10–13. Principal component analysis (PCA) and unsupervised hierarchical clustering showed that basal and luminal cells represent distinct populations in each individual, as expected (Fig. 1b, d). Forty-nine of the one-hundred and sixteen genes tested showed differential expression between basal/stem and luminal cells, and were used to generate a 49-gene differentiation signature. This signature included established lineage-specific genes such as KRT5, TP63, MUC1, CD24 and GATA3 (Fig. 1c, d, Supplementary Table 2 and Supplementary Data 1), validating our multiplex quantitative polymerase chain reaction (qPCR) approach.
Figure 1. Single-cell analysis of normal human mammary epithelial cells.
a, FACS plots show basal/stem (Lin−CD49f hiEpCAMlocKit−, blue), luminal (Lin−CD49f loEpCAMhicKit−, yellow), and luminal progenitor (Lin−CD49f med EpCAMmedcKit+, red) cells from a representative mammoplasty patient. Lin =CD45/CD31. b, PCA plots show distinct cell populations identified in three patients. PC, principal component. c, Bar graph shows the 49 of 116 genes that were significantly (P <0.05) differentially expressed between the populations. P values and fold change are listed in Supplementary Table 2. B, basal/stem; LP, luminal progenitor; L, luminal. d, Heatmap and dendrogram show unsupervised hierarchical clustering of individual cells and genes from the 49-gene signature that were run on all arrays.
Mice from three genetically distinct triple-negative (ER−PR−HER2−), basal-like patient-derived xenograft (PDX) models (HCI-001, HCI-002 and HCI-010) were analysed (Extended Data Table 1)14. We focused on this subtype since it is the most aggressive, metastasis is frequent, and there are no targeted therapeutics to treat it15. These PDX models maintain the essential properties of the original patient tumours, including metastatic tropism, making them authentic experimental systems for studying human cancer metastasis14.
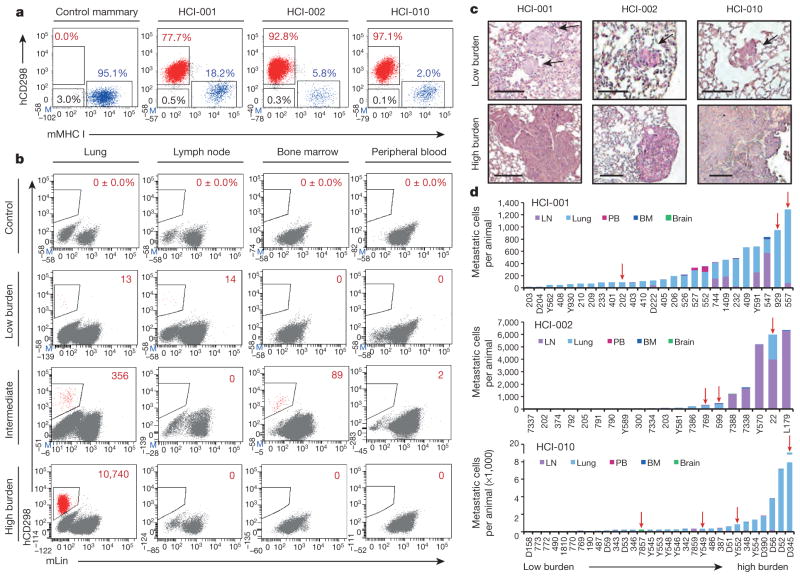
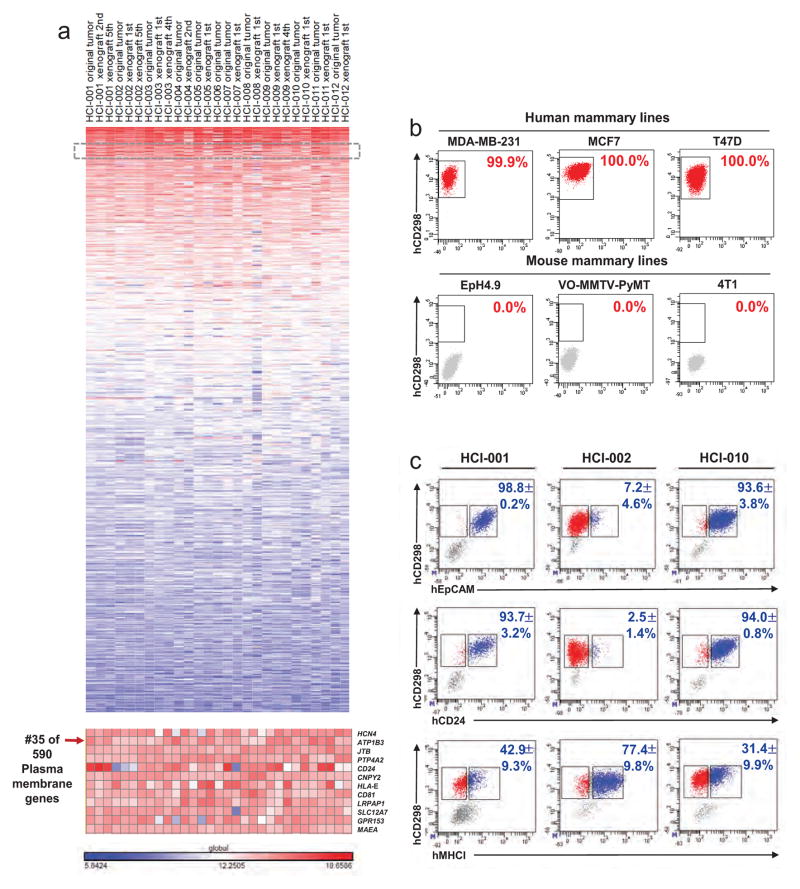
To isolate metastatic cells from PDX mice, we first developed a highly sensitive, species-specific FACS-based assay. We annotated published microarray data to identify cell surface genes highly expressed in PDX breast cancer cells14. This revealed as a top candidate CD298 (also known as ATP1B3), which is a β-subunit of the Na+/K+ ATPases that are essential for basic cellular function16. Using a human species-specific antibody, we found that CD298 is expressed by >99.9% of cells in three different human mammary cell lines, with no background in mouse lines or control mouse peripheral tissues (Fig. 2b and Extended Data Fig. 1a, b). In dissociated PDX primary tumours, all cells either expressed human CD298 or mouse major histocompatibility complex class I (MHC I), indicating that CD298 could detect nearly all cells (>99.5%) that were not of mouse origin (Fig. 2a). We therefore expected that this assay would capture the majority of metastatic cells in PDX mice, with negligible false-positive rates. CD298 was also superior to commonly used markers, such as human EpCAM, CD24 and MHC I (Extended Data Fig. 1c).
Figure 2. Identification of human metastatic cells in PDX mice.
a, FACS plots show human (h)CD298+ (red), mouse (m)MHC I+ (blue), and double-negative (black) cells in representative tissues (n =3). b, FACS plots show percentage or number of hCD298+mLin− (mTer119/mCD45/mCD31) cells in representative low- and high-burden mice. c, Haematoxylin and eosin stains show micro- and macrometastatic lesions in lung tissues of low- and high-burden mice. Low-burden scale bar, 100 μm; high-burden scale bar, 200 μm. Arrows indicate micrometastatic lesions. d, Histograms show the distribution of metastatic burden in each model. Only animals with metastases are s hown. Red arrows indicate animals subjected to single-cell analysis. BM, bone marrow; LN, lymph node; PB, peripheral blood.
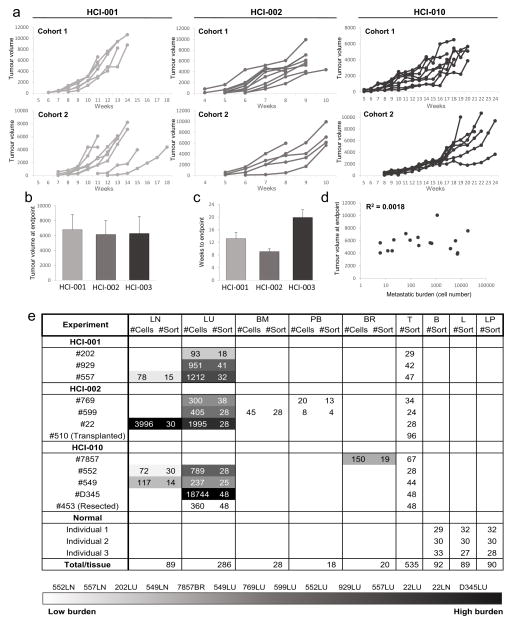
We detected metastatic cells in peripheral tissues of 70/100 (70%) PDX mice using this assay, including the lung, lymph node, bone marrow, liver, brain and peripheral blood (Extended Data Table 1). All animals were analysed when their primary tumour reached 20–25 mm in diameter, and primary tumour growth kinetics were consistent within each model (Extended Data Fig. 2a–d). Although animals were analysed at the same endpoint, we observed variation in metastatic burden by FACS and histology (Fig. 2b, c). We exploited this to investigate gene expression in advanced-stage metastatic disease (high burden) versus earlier-stage metastatic disease (low burden). In total we analysed over 20 mice, and show comprehensive analysis of 441 metastatic and 523 primary tumour cells from 12 animals. The tissues were rank ordered by burden, from lowest (light grey) to highest (black) (Extended Data Fig. 2e). Circulating tumour cells (CTCs) in the blood, and disseminated tumour cells (DTCs) in the bone marrow were not included in the ranking since overt metastasis was never observed in these tissues.
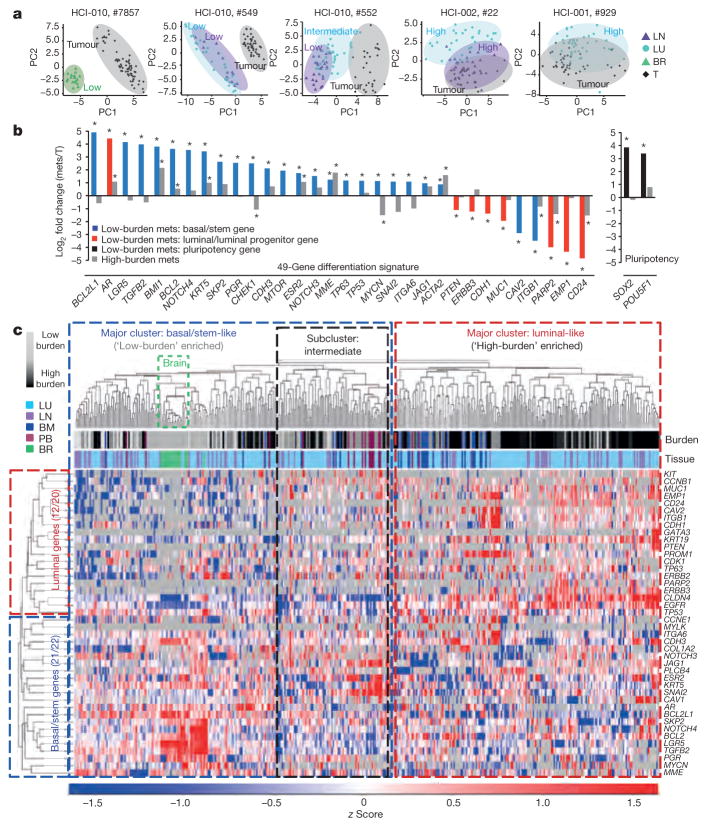
Remarkably, PCA plots for individual animals showed that in tissues with low burden, metastatic cells were very distinct from the primary tumour cells they were derived from (Fig. 3a). By contrast, metastatic cells from higher burden animals were more similar to primary tumour cells. This was also observed by unsupervised hierarchical clustering of pooled cells from all animals, which showed that low-burden metastatic cells form a unique cluster, while higher-burden metastatic cells cluster with primary tumour cells (Extended Data Fig. 3a). Most strikingly, we found that this was due to a conserved basal/stem-cell signature in low-burden metastatic cells across all animals and models. Analysis of genes comprising the 49-gene differentiation signature showed that low-burden metastatic cells expressed higher levels of 22 basal/stem-cell genes, including LGR5, BMI1, BCL2, NOTCH4 and JAG1, and lower levels of seven luminal genes, such as MUC1, EMP1 and CD24 (Fig. 3b). Focusing on clustering of only the metastatic cells (Fig. 3c), we discovered considerable heterogeneity in differentiation, which directly correlated with metastatic burden. Akin to the normal mammary gland, metastatic cells organized into two distinct clusters, where low-burden metastatic cells were most basal/stem-like, and higher-burden metastatic cells possessed a spectrum of progressively more luminal-like expression patterns. This was also observed when lung metastatic cells from each PDX model were analysed separately (Extended Data Fig. 4a and Supplementary Data 2), indicating that it is a conserved phenomenon in each model. Some differences in gene expression were observed between lung metastatic cells from different patient models, but they were not sufficient to cluster cells separately by PDX model (Extended Data Fig. 4c, d and Supplementary Data 3).
Figure 3. Early stage metastatic cells possess a distinct basal/stem-cell program.
a, PCA plots show metastatic and primary tumour cells in representative mice. Low, high and intermediate indicate burden levels. b, Bar graph shows genes from the 49-gene differentiation signature, and pluripotency genes, that were differentially expressed in low-burden metastatic cells.
*P <0.05, significant relative to primary tumour; primary tumour expression =0. P values and fold change are listed in Extended Data Table 2. Mets, metastases. c, Heatmap and dendrogram show unsupervised hierarchical clustering of metastatic cells and genes from the 49-gene signature that were run on all arrays. BM, bone marrow; BR, brain; LN, lymph node; LU, lung; PB, peripheral blood; T, tumour.
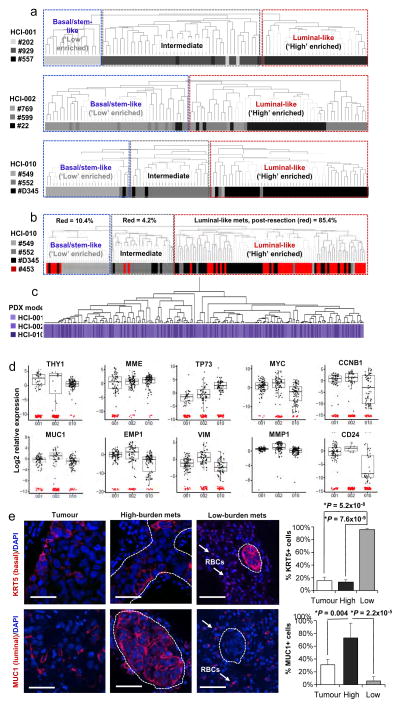
To investigate heterogeneity at the protein level, we performed immunostaining for KRT5 (basal) and MUC1 (luminal) (Extended Data Fig. 4e). Tumour cells found in micrometastases from low-burden tissues were largely KRT5+ (95.8%) and MUC1− (94.3%), while cells from high-burden tissues were heterogeneous for KRT5 and largely MUC1+ (72.9%). This suggests that differentiation status also correlates with metastatic burden at the protein level.
By single-cell analysis, low-burden metastatic cells expressed very high levels of the pluripotency genes POU5F1 (also known as OCT4) and SOX2, suggesting that they may exploit embryonic programs for self-renewal and maintenance (Fig. 3b). Low-burden metastatic cells also expressed higher levels of typical EMT markers such as SNAI2, SKP2 and TWIST1, and lower levels of CDH1, which was observed in normal basal/stem cells (with the exception of TWIST1) (Fig. 3b and Extended Data Table 2). This is consistent with previous reports showing that EMT promotes stemness in the mammary gland, and suggests that low-burden metastatic cells may utilize an EMT program to facilitate dissemination17,18. Gene ontology enrichment revealed that genes involved in the DNA damage response, chromatin modification, differentiation, apoptosis and the cell cycle were differentially expressed in low-burden metastatic cells (Supplementary Data 4). Extended Data Table 2 and Supplementary Data 5 list all 55 genes (of 116 analysed) that were differentially expressed in low-burden metastatic cells.
The heterogeneity observed in metastatic cells raised the question of whether stem-like metastatic cells directly give rise to luminal-like cells, or whether they originate from distinct founder cells. To test first whether cells that disseminate at early phases of primary tumour growth can produce luminal-like metastatic cells, we resected primary tumours when they were only 10–12 mm in diameter and allowed metastases to grow for 8 weeks. Single-cell analysis of the resulting lung metastatic cells showed that 85.4% were luminal-like, and clustered with high-burden metastatic cells from previous experiments (Extended Data Fig. 4b). This suggests that luminal-like metastases can derive from cells that disseminate at earlier stages of primary tumour growth.
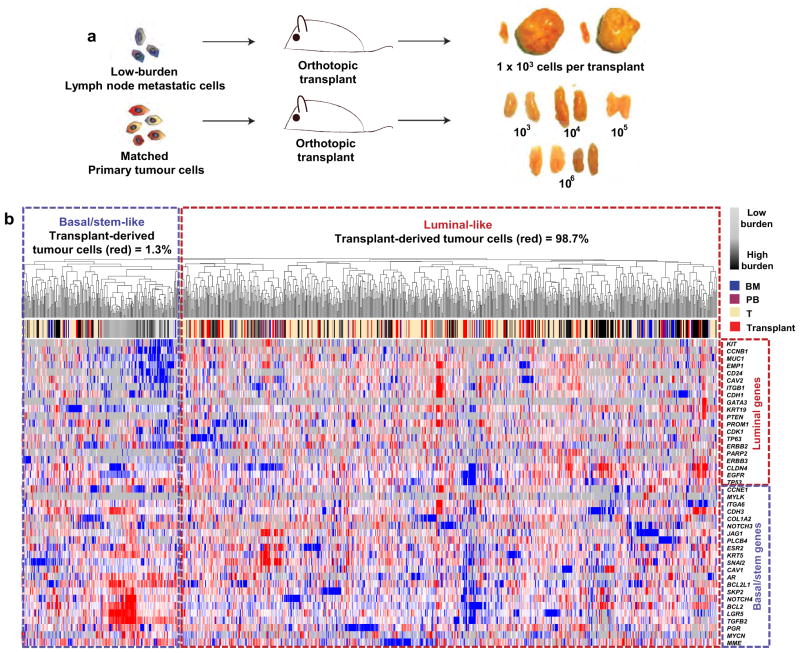
To test the growth and differentiation capacity of stem-like meta-static cells directly, we transplanted low-burden metastatic cells into mammary glands. Remarkably, two of four transplants produced large tumours (Extended Data Fig. 5a), by contrast with primary tumour cells, which did not produce tumours even at 100-fold higher numbers. This is consistent with previous reports indicating that PDX tumours are more efficiently propagated as fragments than dissociated cells19. Single-cell analysis of the resulting tumour cells showed that 98.7% of them were luminal-like, and clustered with primary tumour cells and high-burden metastatic cells from previous experiments (Extended Data Fig. 5b). This suggests that low-burden metastatic cells have considerable tumour-initiating capacity, and can give rise to luminal-like tumour cells, supporting the hypothesis that stem-like meta-static cells give rise to luminal-like ones.
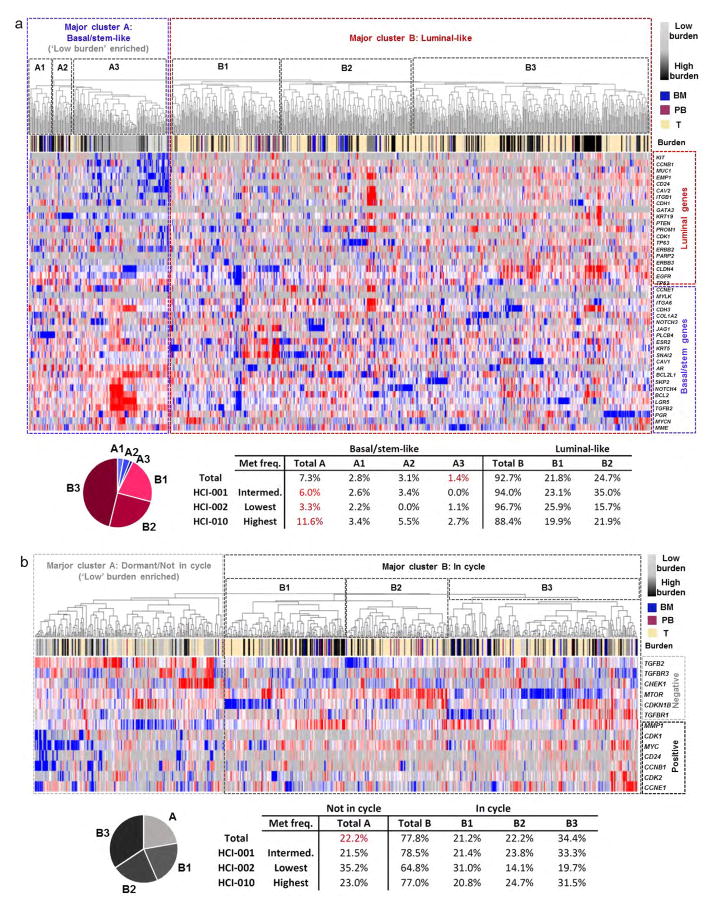
A compelling question raised in this study is whether stem-like cells are present in primary tumours, or whether they evolve later through interaction with their new microenvironment. Unsupervised hierarchical clustering shows that 1.4% of primary tumour cells cluster with low-burden metastatic cells and possess a basal/stem-like phenotype (Extended Data Fig. 3a). This is consistent with previous findings that rare invasive ‘leader’ cells on the periphery of primary tumours express basal cell markers20. Interestingly, the most metastatic PDX model (HCI-010) had the highest percentage of basal/stem-like primary tumour cells, while the least metastatic model (HCI-002) had the lowest. This suggests that primary tumours contain a rare subpopulation of stem-like cells, and that the percentage correlates with metastatic potential. This led us to investigate whether enrichment of this stem-like signature in primary tumours may be predictive of distant metastasis in human patient data sets. By Kaplan–Meier analysis, we found that 16 of 55 genes associated with stem-like metastatic cells were significantly prognostic (Supplementary Data 6). Future studies to determine whether the frequency of stem-like cells in primary tumours can be used as a predictive biomarker for metastasis may be clinically valuable.
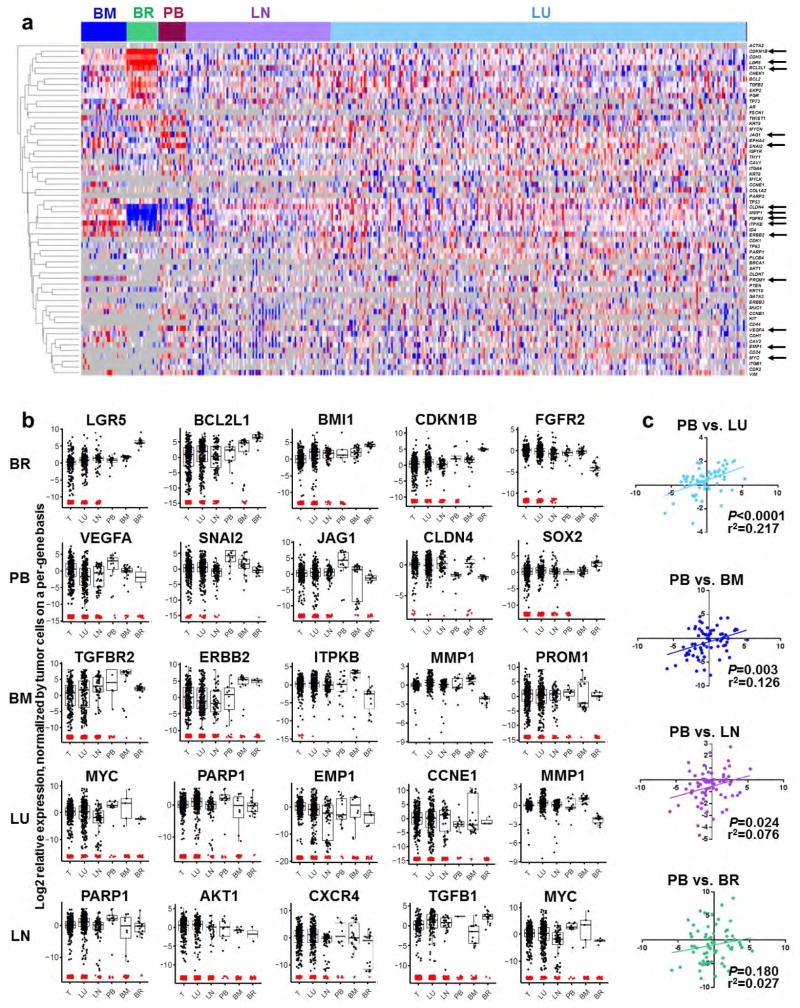
Previous work has shown that metastatic cells in different organs display distinct gene expression signatures2. Consistent with this, by supervised clustering of cells by target organ, we found that metastatic cells in the brain, bone marrow and peripheral blood displayed distinct gene expression patterns (Extended Data Fig. 6a). Brain metastatic cells were the most distinct, and expressed the highest levels of stem cell, quiescence and anti-apoptosis genes. In total, 80 genes were significantly differentially expressed between the populations (Extended Data Fig. 6b, Supplementary Table 3 and Supplementary Data 7).
CTCs are of particular clinical interest for use as a ‘liquid biopsy’ for diagnosis and prognosis. Although only rare CTCs could be recovered, they most closely resembled lung metastatic cells, and were least similar to brain metastatic cells (Extended Data Fig. 6c). Interestingly, most CTCs and bone marrow DTCs clustered with ‘intermediate’ metastatic cells, which may be because the cells were harvested from animals with intermediate burden (Extended Data Fig. 2e). However, 16.7% and 10.7%, respectively, showed a more basal/stem-like signature (Fig. 3c, basal/stem-like cluster), suggesting that these stem-like cells may represent the true metastatic seeder cells.
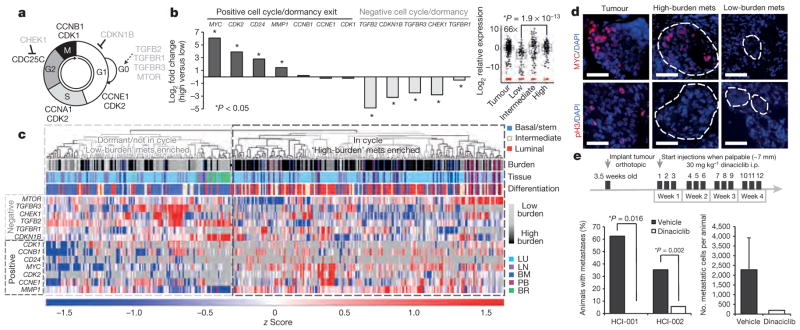
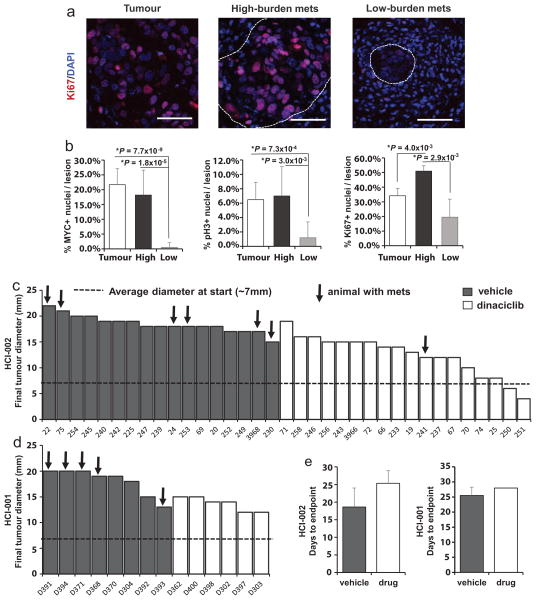
We also observed a shift towards a more proliferative signature associated with increased metastatic burden. Low-burden metastatic cells expressed higher levels of quiescence and dormancy-associated genes, including CDKN1B, CHEK1, TGFBR3 and TGFB2 (Fig. 4a, b)21,22. Higher-burden metastatic cells appeared to enter the cell cycle, expressing lower levels of quiescence and dormancy-associated genes and higher levels of cell-cycle-promoting genes such as MYC and CDK2, as well as MMP1 and CD24, which have been associated with reactivation after dormancy. This distinction was further corroborated by unsupervised hierarchical clustering, showing that low- and high-burden meta-static cells form distinct clusters based on differential expression of these genes (Fig. 4c). Of note, the majority of metastatic cells in the dormant cluster were also in the basal/stem-cell cluster depicted in Fig. 3c, demonstrating a correlation between dormancy and stem-cell-related gene expression in metastatic cells. We also detected primary tumour cells (22.2%) with this less-proliferative signature (Extended Data Fig. 3b). Immunostaining for MYC, phospho-histone H3 and Ki67 confirmed that micrometastases show lower MYC expression and proliferative index (Fig. 4d and Extended Data Fig. 7a, b).
Figure 4. Metastatic progression is blocked by cell cycle inhibition.
a, Schematic of the cell cycle. b, Graph and box plot (MYC) show expression for dormancy and cell-cycle-associated genes. P values: MYC: 1.9 ×10⁻¹³; CDK2: 1.25 ×10⁻⁷; CD24: 0.005; MMP1: 1.08 ×10⁻¹²; TGFB2: 1.28 ×10⁻¹⁶; CDKN1B: 2.63 ×10⁻¹⁴; CHEK1: 2.18 ×10⁻⁶. c, Unsupervised hierarchical clustering of metastatic cells and cell-cycle-associated genes. mets, metastases. d, Immunofluorescence stains for MYC and phospho-histone H3 (pH3) in micro- and macrometastatic lesions. Scale bar, 50 μm. e, Dinaciclib treatment course in PDX mice (top). Graphs show percentage of mice with metastasis, and burden per animal. Error bars, s.d. Only one drug-treated animal developed metastasis, so no P value was generated (right graph).
These findings prompted us to test whether blocking this switch from dormancy into the cell cycle could inhibit metastatic progression. Since we observed high levels of both MYC and CDK2 in more advanced stage metastatic cells (Fig. 4b), we chose to test dinaciclib, a CDK inhibitor that has been shown to induce apoptosis in high MYC-expressing cancer cells via synthetic lethality23,24. We hypothesized that apoptosis would be induced in metastatic cells transitioning into proliferation, since they appear to upregulate MYC. We administered dinaciclib to a total of 49 mice from two PDX models, HCI-001 and HCI-002, which were from drug-naive patients. After a 4-week treatment course, we found that only 1 of 24 drug-treated animals displayed metastatic cells, in comparison to 44% (11/25) of vehicle-treated mice (Fig. 4e). Although tumour growth was delayed in drug-treated animals, many developed sizeable tumours by the endpoint, suggesting that the effect was not simply due to inhibition of the primary tumour (Extended Data Fig. 7c–e). By looking in high resolution at gene expression in single metastatic cells, we have uncovered previously unrealized diversity in differentiation and gene expression relating to the metastatic stage (Extended Data Fig. 8), and demonstrate that this approach can facilitate the identification of new potential drug targets with efficacy against metastatic disease.
METHODS
Cell line and animal experiments
All cell lines used in the study were pre-validated and grown using standard protocols that can be found on the American Type Culture Collection. The University of California, San Francisco Institutional Animal Care and Use Committee (IACUC) reviewed and approved all animal experiments. PDX tumour tissues were acquired from the laboratory of A. Welm and serially passaged as ~8 mm3 tumour fragments into the cleared inguinal fat pads of pre-pubescent NOD/SCID mice following established protocols14. When tumours became palpable, they were calipered weekly to monitor growth kinetics. Tumour fragments were stored by freezing in 90% FBS and 10% dimethylsulfoxide (DMSO) in liquid nitrogen. Clinical details of patients used for generation of each PDX model are detailed elsewhere14. All PDX animals were euthanized at the endpoint unless otherwise noted, when tumours reached 20–25 mm. In resection experiments, tumours were surgically removed at 10–12 mm. Resected animals were replaced in the colony and allowed to grow metastases for 8 weeks, at which time lung tissues were harvested, digested, and analysed by FACS for human cells.
For orthotopic transplant experiments for functional activity of metastatic cells, lymph node metastatic cells from animals with <500 CD298+ metastatic cells in the lymph nodes were isolated by FACS and pooled from several animals. CD298+ primary tumour cells from matched animals were also isolated by FACS. Sorted cells were pelleted and resuspended in 1:1 Matrigel plus DMEM/F12 media. Sample dilutions were injected into cleared mammary fat pads of 3.5-week-old NOD/SCID mice. Grafts were harvested 4.5 months later when primary tumours reached 20 mm.
Dinaciclib treatment experiments
Dinaciclib was prepared and administered according to previously established protocols in mice23,25. Dinaciclib was reconstituted in 20% hydroxypropyl β cyclodextrin (HPBCD). Animals were randomly assigned into treatment or control groups when tumour cells were transplanted, and mice were analysed using a single-blind design. The drug treatment course was initiated when tumours became palpable. A total of 49 animals (HCI-001 and HCI-010) were treated by i.p. injection three times per week at 30 mg kg−1 of drug, or vehicle (HPBCD), a previously established dose in mice25. Animal group size was chosen by power analysis, using a two-tailed α of 0.05 with 80% power, and the frequencies of metastasis that we observed in each model (Extended Data Table 1). Animals were measured by caliper twice weekly to record primary tumour growth. Mice were euthanized at the conclusion of a 4-week treatment course, or earlier if their tumours reached the IACUC-established ethical endpoint (20 mm in diameter). Animals that developed adverse effects (for example, >20% weight loss) were excluded from the study. Statistical significance between drug- and vehicle-treated groups was examined by two-tailed, unpaired t-tests.
Bioinformatics and computational analysis of microarray data sets
Published microarray data sets (Gene Expression Omnibus (GEO) accession number GSE32531) on the PDX models were downloaded from the GEO database14. Microarray gene expression values were calculated by global median normalization and annotated with GeneSpring GX 12.0 software (Agilent Technologies). Plasma membrane genes highly expressed across all 15 PDX tumour samples and 12 original patient tumour samples included in the study were rank ordered from highest to lowest expression across all the samples using the GENE-E package26.
The prognostic value of each of the 55 genes characteristic of low-burden metastatic cells (Extended Data Table 2) was determined by Kaplan–Meier analysis using KM-plotter online software (http://kmplot.com/analysis/)27. The relationship of gene expression and distant metastasis-free survival (DMFS) (n =1,610) was evaluated in an integrated multi-study breast cancer microarray data set containing 13 breast cancer expression profiling data sets from GEO. Kaplan–Meier estimates of DMFS were calculated by setting the software to look for the optimal cut-off for separation of patients into high- and low-expressing groups. The hazard ratio, log-rank P value, and number of patients in each group are shown on the KM plot for each gene.
Tissue dissociation
All solid tissues, including primary tumour, liver, lungs, lymph nodes (axillary, brachial, cervical, sciatic and lumbar) and brain were dissociated for FACS using the same protocol. Briefly, tissues were mechanically chopped with scalpels, placed in culture medium (DMEM/F12 with 5% FBS, 5 μg ml−1 insulin (UCSF Cell Culture Facility), 50 ng ml−1 gentamycin (UCSF Cell Culture Facility) containing 2 mg ml−1 collagenase-1 (Sigma). They were then digested for 45 min at 37 °C. The resulting suspensions were resuspended in 2 U μl−1 DNase for 3 min at room temperature, washed and dissociated with 2 ml of 0.05% trypsin/EDTA (UCSF Cell Culture Facility) for 10 min at 37 °C. Peripheral blood was collected by effusion with 10 mM EDTA in D-PBS, followed by mixture with 2% dextran in D-PBS for sedimentation of red blood cells using standard methods. After 1 h, supernatant was collected and cells were pelleted at 1,500 r.p.m. for 5 min. Bone marrow was collected by removing all tissue from femur and tibia and flushing marrow with 1 × PBS using a 27G needle. Residual erythrocytes in peripheral blood, lung and tumour samples were lysed with Red Blood Cell Lysis Buffer for 5 min at room temperature. All samples not used immediately were filtered through a 70 μm filter, and frozen in DMEM/F12 with 50% serum and 10% DMSO, and stored in liquid N2.
Reduction mammoplasty samples were acquired from the Cooperative Human Tissue Network (CHTN), a program funded by the National Cancer Institute. Tissues were washed three to five times with PBSA (1× Dulbecco’s PBS supplemented with 200 U ml−1 penicillin, 200 μg ml−1 streptomycin (Invitrogen) and 5 μg ml−1 Fungizone (Invitrogen)). Tissues were minced into small fragments and digested overnight in collagenase-I-containing solution as previously described28. Digested organoids were pelleted in a centrifuge at 100g for 3 min and frozen and stored in liquid N2 as described earlier.
Flow cytometry
Antibodies for the human antigens CD45 (Alexa-450, eBioscience), CD31 (Alexa-450, eBioscience), CD298 (PE, Biolegend), EpCAM (PE or APC, eBioscience), CD49f (APC, eBioscience), CD117/cKit (FITC, eBioscience), CD24 (APC, eBioscience) and MHC I (APC, eBioscience) were purchased commercially. For mouse antigens, CD45 (FITC, eBioscience), Ter119 (FITC, eBioscience), CD31 (FITC, eBioscience) and MHC I (APC, eBioscience) were used. All antibodies were validated in previous publications10–13, or in this study directly (CD298). Antibody staining was performed in DMEM/5% FBS supplemented with penicillin and streptomycin. After 15 min on ice, stained cells were washed of excess unbound antibodies and resuspended in medium. Flow sorting was done using a BD FACSAriaII cell sorter (Becton Dickinson), and analysis was done on an LSRII (Becton Dickinson). Forward-scatter height versus forward-scatter width (FSC-H versus FSC-W) and side-scatter area versus side-scatter width (SSC-A versus SSC-W) were used to eliminate cell aggregates and ensure single cell sorting. Dead cells were eliminated by excluding Sytox positive (SYTOX Blue dead cell stain, Molecular Probes) cells, which increased the efficiency of sorting robust, live cells for single-cell experiments. Contaminating human or mouse haematopoietic and endothelial cells were excluded by gating out Lin+ (CD45, Ter119, CD31) cells. In Fig. 2a, Sytox+mLin+ cells were pre-gated out, and the percentages shown reflect the remaining population. Control mammary: 0.0±0.0% hCD298+; 95.1±2.0% mMHC I+; 3.0±2.1 hCD298−mMHC I−; HCI-001: 77.7±11.3% hCD298+; 18.2±8.7% mMHC I+; 0.5±0.3 hCD298−mMHC I−; HCI-002: 92.8±3.2% hCD298+; 5.8 ±4.0% mMHC I+; 0.3 ±0.2 hCD298−mMHC I−; HCI-010: 97.1±1.0% hCD298+; 2.0 ±0.6% mMHCI+; 0.1 ±0.1 hCD298− mMHC I−. In single-cell multiplex qPCR experiments where the number of meta-static cells identified was listed (Extended Data Fig. 2e, #Cells), the entire tissue sample was run through the flow cytometer. A consistent number of live cells was found in tissues from each animal. In any case where live cell yields deviated from the average by more than one standard deviation, mice were excluded from the study (Supplementary Data 8 shows histograms for cell yields from lung and lymph nodes). In Extended Data Table 1 and Fig. 4e, animals or tissues were designated as positive for metastatic cells if>10 hCD298+mLin− cells were detected in the entire sample.
Fluidigm dynamic array experiments
Single-cell gene-expression experiments were performed using Fluidigm’s 96.96 qPCR DynamicArray microfluidic chips. Single cells were sorted by FACS into individual wells of 96-well PCR plates, using the FACSAriaII single-cell sorting protocol with specific adjustments (device: 96-well PCR plate; precision: single-cell; nozzle: 100 μm). Experiments were performed according to Fluidigm’s Advanced Development Protocol 41. Each well of 96-well PCR plates was preloaded with 9 μl volume of RT-STA solution: 5 μl of CellsDirect PCR mix (Invitrogen), 0.2 μl of SuperScript-III RT/Platinum Taq mix (Invitrogen), 1.0 μl of a mixture of all pooled primer assays (500 nM), and 2.8 μl of DNA suspension buffer (TEKnova). After sorting, PCR plates were frozen (−20 °C) or placed into a thermocycler for combined reverse transcription (50 °C for 15 min, 95 °C for 2 min) and target-specific amplification (20 cycles; each cycle: 95 °C for 15 s, 58 °C for 4 min). Technical replicates were not performed, as the manufacturer recommends a greater number of biological replicates in lieu of technical replicates yields more power and better sampling of the target population. 3.6 μl of exonuclease reaction solution (2.52 μl H20, 0.36 Exo reaction buffer, and 0.72 μl ExoI, New England BioLabs) was then added to remove unincorporated primers (37 °C for 30 min, 80 °C for 15 min). Subsequently, each well was diluted 1:3 with TE buffer (TEKnova). In a separate plate, a 2.7 μl aliquot from each sample well was then mixed with 2.5 μl of SsoFast EvaGreen Supermix with Low Rox (Bio-Rad) and 0.25 μl of Fluidigm’s DNA Binding Dye Sample Loading Reagent. Plates were centrifuged to mix solutions. In another separate plate, individual primer assay mixes were generated by loading 2.5 μl of Assay Loading Reagent (Fluidigm), 2.25 μl DNA Suspension Buffer, and 0.25 μl of 100 μM primer pair mix. Before loading primer assays and sample mixes into each chip, chips were primed by injecting control line fluid (Fluidigm) and running the ‘Prime’ program in the IFX Controller HX. After priming, 5 μl of each sample and primer mix were loaded into each well of the chips. Samples and assays were then mixed in the chip by running the ‘Load Mix’ program in the IFC Controller HX. Chips were transferred into the BioMark real-time PCR reader (Fluidigm) and run according to the manufacturer’s instructions. A list of primer assays used in this study is provided in Supplementary Table 1. All primer sequences were acquired through the Harvard Primer bank, and synthesized by Integrated DNA Technologies. Primer assays were run on Fluidigm’s dynamic arrays using an iterative approach, where genes that were not informative were replaced in subsequent experiments. Thorough technical evaluations of the micro-fluidics array technology, limits of detection, and efficiency of multiplex PCR in this platform have been reported by Fluidigm and several independent reports29–31.
Computational analysis, display, and statistical assessment of single-cell PCR data sets
All single-cell PCR data were analysed using Fluidigm’s Real-time PCR analysis software, using the Linear (Derivative) and User (Detectors) settings to generate Ct values for each gene. Ct values were further processed in the R statistical language32, using algorithms we generated. All code is provided in Supplementary Information, and published in GitHub (https://github.com/) for upload into R. Single-cell multiplex qPCR data are available at the NCBI GEO database (accession GSE70555). Over 20 mice were analysed, but data from 12 PDX mice are included (in which a similar gene set was analysed). Mammary epithelial cells from three reduction mammoplasty patients were also analysed. In total, 268 mammary cells from reduction mammoplasties, and 441 metastatic and 523 primary tumour cells from PDX mice were analysed.
In normal mammary cell experiments, Ct values were normalized by subtracting the average value of the basal/stem-cell population on a per-gene, per-array basis to correct for batch-to-batch differences in reverse transcription, pre-amplification, and real-time PCR. In PDX experiments, Ct values were normalized by subtracting the average primary tumour expression from the same individual animal on a per-gene basis, to identify conserved differences in gene expression in metastatic cells relative to the primary tumour cells they derive from, in addition to correction of batch-to-batch differences. Normalization using housekeeping genes was not performed, as it is not recommended for single-cell qPCR33. Normalized Ct values were converted to relative log2 expression values simply through multiplication by −1. Low-quality samples were identified and removed from further analysis in most experiments if less than 80% of the assayed genes amplified. Gene expression data were displayed by PCA, unsupervised hierarchical clustering, supervised clustering, and box plots. Unsupervised hierarchical clustering was performed on both metastatic cells and genes based on Pearson’s correlation distance metric and average linkage, after z-score standardization of the log2 expression values for each gene across all samples (Fig. 3c). In all other PDX heatmaps, genes were not clustered, but instead the gene order was maintained for consistency. For all heatmaps, the limits of the blue/red colour scale are set to span 90% of the data based on a normal distribution, to prevent outliers from compressing the colours of the majority of the data. For PCA, in which missing data are not easily accommodated, a lower limit of detection approach was taken, in which failed reactions were set to a log2 expression value one lower than the minimum observed value across all samples for each gene separately.
To identify gene expression differences between predefined populations, several statistical tests were performed. For normal mammary cell experiments, we first performed three-group comparisons between basal/stem, luminal, and luminal progenitor cells (both parametric: analysis of variance (ANOVA); and non-parametric: Kruskal–Wallis). This yielded a list of 49 differentially expressed genes (Fig. 1c and Supplementary Table 2). To determine which genes were characteristic of each population, we subsequently performed pair-wise tests (parametric: moderated t-test; and non-parametric: Mann–Whitney U test). In metastatic cell versus primary tumour cell experiments, only pair-wise comparisons were performed. Three-group comparisons were performed to compare lung metastatic cells from the three PDX models, and five-group comparisons were performed to compare metastatic cells from each tissue. In these analyses, ANOVA and Kruskal–Wallis group tests were performed followed by post-hoc pairwise analyses using Tukey and Chi-squared tests. In low- versus high-burden metastatic cell comparisons, low burden was defined as <250 human cells detected in the entire tissue, and high burden was defined as >1,000 cells. Intermediate burden was defined as in between 250 and 1,000 human cells detected. As we were only analysing assays for which at least one cell yielded amplification, undetectable amplification represented non-expression rather than technical error in the PCR reaction. To capture non-expression in the statistical tests, failed reactions were set to a value 0.01 lower than the lowest observed value across all samples for each gene separately. For the non-parametric tests described earlier, the specific value chosen is not important, while for the parametric tests, this method is comparable to using a lower limit of detection. Our algorithm selected the most appropriate test from which to report a P value based on the type of data observed for that gene (non-parametric if>50% of samples failed for either group, parametric otherwise). This criterion was chosen in an attempt to prevent a high proportion of failed values masking group differences. All P values were also adjusted for the fact that many genes were being simultaneously analysed by controlling the false discovery rate (FDR) with the Benjamini–Hochberg method. To identify basal/stem-cell-characteristic genes, we compared basal/stem (B) to both luminal (L) and luminal progenitor cells (LP) (that is, B versus (L and LP)). Luminal genes were identified by performing L versus B, and luminal progenitor genes by performing LP versus L (since they are a subset of the L lineage). Log-fold changes were computed as a difference between the mean of the log2-normalized expression values for one group versus the mean of the values for the other group; failed reactions were first replaced using the lower limit of detection approach described above.
Enrichment analysis of Biological Process gene ontology terms was performed using the GOstats R package, using the conditional parameter. This was done to identify pathways that were more represented in the set of significantly differentially expressed genes than would be expected by chance alone.
Histological and immunofluorescent analysis
Tissues were fixed overnight in 4% paraformaldehyde and processed for paraffin embedding. For histological analysis, sections were stained with haematoxylin and eosin using standard methods. Immunofluorescent staining was performed on lung tissues with low and high metastatic burden. We defined low burden as fewer than 10 small detectable lesions, containing fewer than 20 cells each. High burden was defined as greater than 25 lesions, with large numbers of cells (at least 1,000 in total). Metastatic lesions were identified by the size of the nuclei, as tumour cell nuclei were 2–3 times larger than surrounding nuclei in the lung. Metastatic lesions were also often encircled by basement membrane and stroma, making them easily identifiable. Immunostaining on paraffin-embedded tissue sections was performed using standard protocols, using citrate buffer (pH 6.0) and heating in a pressure cooker for 8 min. MUC1 (Sigma, HPA008855, 1:100) and KRT5 (Biolegend, PRB-160P, 1:1,000) were stained using a three-step technique, where primary antibodies were incubated overnight, followed by 1 h incubations with a biotinylated anti-rabbit secondary (DAKO, 1:500) and subsequently a Streptavidin Alexa-568 (Invitrogen, 1:1,000). MYC (abcam, ab32072,1:100) and phospho-histone H3 (Cell Signaling Technology, 1:100) were identified using a two-step technique, where overnight primary antibody stains were followed by a 1 h incubation with a goat anti-rabbit Alexa-568 secondary (Molecular Probes, 1:1,000). The number of positive nuclei was counted in several fields for each group (tumour, high burden, and low burden), and significance was calculated by single-factor ANOVA and pair-wise t-tests assuming equal variance.
Extended Data
Extended Data Figure 1. Identification and validation of CD298 for detection of human cells.
a, Analysis of published microarray data identified CD298 as highly expressed on many PDX breast cancer models and corresponding original patient tumours. The heatmap shows genes rank ordered from highest to lowest for raw expression values across all samples. The inset (bottom) highlights expression for CD298 (also known as ATP1B3). CD298 ranked number 35 out of over 590 plasma membrane genes. b, FACS for CD298 on human (top) and mouse (bottom) mammary cell lines to establish species specificity. c, FACS on primary PDX tumour cells comparing CD298 expression with other markers used in related applications (EpCAM, CD24, MHC I; percentages indicate dual-positive cells) (n =3). EpCAM is used to identify CTCs in the clinic; CD24 is a pan-epithelial marker; and MHC I is used as a ubiquitous marker on all nucleated cells. These markers were not used in this study because they were not robustly expressed on all PDX models.
Extended Data Figure 2. Analysis of primary tumour growth kinetics and metastasis in PDX mice.
a, Weekly caliper measurements of primary tumours in two independent cohorts of animals show that growth kinetics were consistent within each PDX model. b, Bar graph shows that the average tumour volume at the endpoint was similar across PDX models. c, Bar graph shows the average number of weeks for tumours to reach endpoint (20–25 mm diameter) in each PDX model. d, Correlation plot shows that metastatic burden did not correlate with tumour volume in PDX animals. e, Table summarizing the number of metastatic cells detected (#Cells) and analysed (#Sort) from each tissue from each PDX animal. Tissues were rank ordered according to metastatic burden, from lowest (lightest grey) to highest (black). The table also shows the number of primary tumour cells analysed (#Sort) from PDX animals, and the number of normal mammary epithelial cells analysed (#Sort) from mammoplasty patients (Individuals 1, 2, and 3). ‘Transplanted’ indicates primary tumour cells derived from transplant of lymph node metastatic cells into marry fat pads; ‘resected’ indicates lung metastatic cells analysed 8 weeks after resection of the primary tumour. B, basal/stem; BM, bone marrow; BR, brain; L, luminal; LN, lymph node; LP, luminal progenitor; LU, lung; PB, peripheral blood; T, primary tumour.
Extended Data Figure 3. Primary tumours contain rare stem-like cells.
a, Unsupervised hierarchical clustering of metastatic and primary tumour cells from 10 animals (Extended Data Fig. 2e lists cells analysed from each animal) based on their expression of the 49-gene differentiation signature. The dendrogram shows two major clusters, where major cluster A contains basal/ stem-like cells and major cluster B contains more luminal-like cells. The majority of low-burden metastatic cells reside in subcluster A3. 1.4% of the primary tumour cells analysed in this study reside in subcluster A3, and are therefore similar to low-burden metastatic cells in their stem-like differentiation status. The pie graph and table list the percentage of primary tumour cells that reside in each cluster. The table also shows the data by PDX model. b, Unsupervised hierarchical clustering of metastatic and primary tumour cells, based on their expression of genes associated with cell cycle and dormancy. Two major clusters are evident. Major cluster A contains cells with a less-proliferative signature, which express higher levels of ‘negative’ cell-cycle-associated genes and lower levels of ‘positive’ cell-cycle-associated genes. Major cluster B contains cells with a more proliferative signature. The majority of low-burden metastatic cells reside in major cluster A, and possess a less-proliferative signature. The pie chart and table show the number of primary tumour cells in each cluster.
Extended Data Figure 4. The correlation between differentiation and metastatic burden is conserved in each PDX model.
a, Unsupervised hierarchical clustering of lung metastatic cells from each PDX model is shown separately. Lung metastatic cells were specifically chosen for this analysis because they were the only tissue for which there were sufficient numbers of low- and high-burden cells. In each dendrogram, low-burden metastatic cells form a distinct cluster due to their basal/stem-like expression signature. High-burden metastatic cells also form distinct clusters and express higher levels of luminal genes. Supplementary Data 2 shows the entire heatmap for each PDX model. b, Unsupervised hierarchical clustering of lung metastatic cells that developed after primary tumour resection (#453, red) at 10–12 mm in diameter. Post-resection metastatic cells were clustered with lung metastatic cells from non-resected animals to investigate their differentiation status. All animals bore the HCI-010 model. 85.4% of post-resection metastatic cells displayed a luminal-like expression pattern, showing that luminal-like metastatic cells can arise from cells that disseminate at early stages of primary tumour growth. Supplementary Data 2 shows the entire heatmap. c, Unsupervised hierarchical clustering of lung metastatic cells from all three PDX models by their expression of the top genes differentially expressed between them. Although there were statistically significant differences between the models, the dendrogram shows that they were not powerful enough to cluster the cells separately by model. Supplementary Data 2 shows the entire heatmap. d, Box plots show top selected genes differentially expressed between the three PDX models. By ANOVA, 53 genes were significantly differentially expressed (P <0.05, Supplementary Data 3). e, Immunofluorescence stains for basal and luminal lineage-specific proteins (red) in micro- and macrometastatic lesions. Autofluorescent red blood cells (RBCs) are also present in the lung (arrows), but do not represent positive immunostaining. Scale bars, 50 μm. Bar graphs quantify the percentage of low- and high-burden metastatic cells, and primary tumour cells that were positive for antibody staining. Data from at least three fields, in three different mice was collected from each group, and P values were calculated as described in the Methods. Error bars represent standard deviation.
Extended Data Figure 5. Low-burden metastatic cells have tumour-initiating and differentiation capacity.
a, Schematic overview of orthotopic transplant experiments to investigate the tumour-initiating and differentiation capacity of low-burden metastatic cells. Images of resulting grafts show that 2/4 transplants of low-burden cells grew large tumours, while 0/10 transplants from primary tumour cells developed tumours. b, Unsupervised hierarchical clustering of tumour cells derived from transplants of low-burden metastatic cells. Transplant-derived tumour cells were clustered with metastatic and primary tumour cells from previous experiments (Extended Data Fig. 3a) to investigate their differentiation status. Transplant-derived tumour cells were heterogeneous, where 1.3% of them were basal/stem-like, and 98.7% of them clustered with more luminal-like cells. This shows that low-burden basal/ stem-like metastatic cells have the capacity to give rise to luminal-like cancer cells.
Extended Data Figure 6. Metastatic cells found in different organs show distinct gene expression signatures.
a, Supervised clustering of metastatic cells by target organ emphasizes tissue-specific gene signatures. Arrows indicate genes significantly differentially expressed between at least two tissues, as shown in b. b, Box plots show genes most characteristic of each tissue type, as determined by ANOVA and pair-wise analyses. P values and fold change for each gene and tissue pair are listed in Supplementary Table 3. Box plots for all 80 genes differentially expressed between the tissue pairs are shown in Supplementary Data 7. BM, bone marrow; BR, brain; LN, lymph node; LU, lung; PB, peripheral blood (CTC); T, tumour. c, Pearson correlations indicate similarity of CTCs to other metastatic tissue types across all genes analysed. Each dot represents an individual gene. BM, bone marrow; BR, brain; LN, lymph node; LU, lung; PB, peripheral blood (CTC).
Extended Data Figure 7. Analysis of dinaciclib-treated animals.
a, Immunofluorescence stains for Ki67 in micro- and macrometastatic lesions from low- and high-burden animals, as well as in primary tumours. Scale bars, 50 μm. b, Bar graphs quantify the percentage of MYC, phospho-histone H3 (pH3), and Ki67 positive cells per lesion in micro- and macrometastatic lesions. Error bars represent standard deviation. c, d, Waterfall plots shows the longest final tumour diameter for each PDX animal treated with vehicle (black bars) or drug (white bars). e, Bar graphs show the average number of days to endpoint (4 weeks, or 20 mm primary tumour size) for animals treated with vehicle or drug.
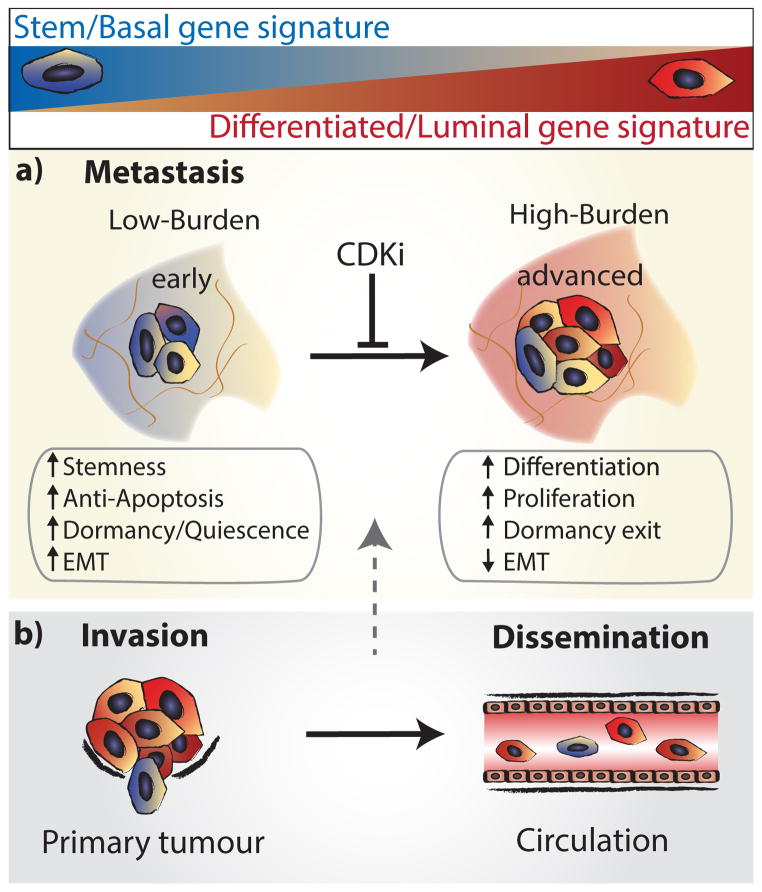
Extended Data Figure 8. Model for tumour cell heterogeneity during metastasic progression.
a, Metastatic cells from animals with low metastatic burden (blue) are distinct from animals with higher burden, due to their increased expression of stemness, anti-apoptosis, EMT, and dormancy/ quiescence-related genes. In contrast, higher burden metastatic cells are more heterogeneous, and comprise larger numbers of proliferative, differentiated cells (red). Transplant experiments of stem-like metastatic cells showed that they have tumour-initiating potential, and can produce luminal-like cancer cells. This strongly suggests that metastases derive from stem-like cells, which differentiate and undergo a switch from dormancy into proliferation as they colonize and produce more advanced metastatic tumours. Metastatic progression was also associated with increased MYC expression, and could be attenuated with CDK inhibition. We believe this is due to apoptosis of cells as they upregulate MYC, since our previous work has shown that CDK inhibition induces apoptosis in high MYC-expressing cancer cells through synthetic lethality23. b, Comparison of gene signatures in primary tumour and metastatic cells showed that 1.4% of primary tumour cells, and 16.7% of CTCs possessed a stem-like signature. This suggests that these cells may be the origin of metastatic tumours.
Extended Data Table 1. Metastatic frequency and tissue tropism identified by FACS in each PDX model.
| HCI-001 | HCI-002 | HCI-010 | |
|---|---|---|---|
| PATIENT | |||
| Marker status | ER−/PR−/Her2− | ER−/PR−/Her2− | ER−/PR−/Her2− |
| Tumor subtype (PAM50) | Basal | Basal | Basal |
| Sample source | Breast | Breast | Pleural effusion |
| Diagnosed metastases | Lymph node | Lymph node | Lung |
| PDX MICE | |||
| Total mice with mets | 26/32 (81%) | 13/35 (37%) | 31/33 (94%) |
| Peripheral blood | 7/31 | 1/19 | 3/22 |
| Lymph node | 8/31 | 7/34 | 17/33 |
| Lung | 26/32 | 7/35 | 31/33 |
| Bone marrow | 3/21 | 4/25 | 6/23 |
| Brain | 0/15 | 1/8 | 1/13 |
Extended Data Table 2.
All genes differentially expressed in low-burden metastatic cells relative to primary tumour cells
| Increased expression
| |||
|---|---|---|---|
| Gene | Normal lineage | Fold change (low-burden/T) | *P value |
| TGFBR2 | N/A | 43.0 | 4.8×10⁻¹² |
| BCL2L1 | basal/stem | 30.1 | 2.2×10⁻¹¹ |
| EPHA4 | N/A | 27.0 | 4.5×10⁻¹⁴ |
| AR | luminal | 21.5 | 7.3×10⁻¹⁵ |
| LGR5 | basal/stem | 17.6 | 4.6×10⁻¹³ |
| IGFBP6 | N/A | 15.7 | 2.4×10⁻⁸ |
| TGFB2 | basal/stem | 15.7 | 2.4×10⁻¹⁵ |
| SOX2 | N/A | 14.5 | 2.8×10⁻¹¹ |
| BMI1 | basal/stem | 14.0 | 1.1×10⁻²⁸ |
| CXCL12 | N/A | 13.7 | 8.1×10⁻⁶ |
| TWIST1 | N/A | 13.4 | 2.5×10⁻⁷ |
| BCL2 | basal/stem | 12.3 | 1.3×10⁻¹⁰ |
| NOTCH4 | basal/stem | 11.6 | 1.0×10⁻¹⁶ |
| KRT5 | basal/stem | 10.8 | 6.1×10⁻⁸ |
| POU5F1 | N/A | 10.5 | 1.8×10⁻⁶ |
| TGFB1 | N/A | 8.1 | 7.1×10⁻⁵ |
| THY1 | N/A | 7.4 | 2.3×10⁻⁵ |
| CDKN1B | N/A | 7.3 | 5.1×10⁻¹¹ |
| WNT2 | N/A | 6.6 | 6.7×10⁻⁶ |
| SKP2 | basal/stem | 6.2 | 4.7×10⁻⁷ |
| DAND5 | N/A | 6.1 | 2.2×10⁻⁹ |
| PGR | basal/stem | 5.8 | 9.4×10⁻⁵ |
| CHEK1 | basal/stem | 5.6 | 2.3×10⁻⁵ |
| CDH3 | basal/stem | 4.3 | 1.5×10⁻⁹ |
| MTOR | basal/stem | 3.8 | 1.0×10⁻⁴ |
| TP73 | N/A | 3.5 | 5.1×10⁻⁷ |
| TGFBR3 | N/A | 3.4 | 0.004 |
| ESR2 | basal/stem | 3.3 | 0.002 |
| ESR1 | N/A | 3.3 | 0.004 |
| MAX | N/A | 3.2 | 0.010 |
| NTRK2 | N/A | 2.9 | 0.014 |
| NOTCH3 | basal/stem | 2.9 | 0.040 |
| FIGF | N/A | 2.9 | 0.004 |
| MME | basal/stem | 2.4 | 0.017 |
| TP63 | basal/stem | 2.3 | 0.017 |
| TP53 | basal/stem | 2.2 | 0.003 |
| MYCN | basal/stem | 2.2 | 0.033 |
| SNAI2 | basal/stem | 2.1 | 0.046 |
| ITGA6 | basal/stem | 2.1 | 0.003 |
| JAG1 | basal/stem | 1.9 | 0.057 |
| ACTA2 | basal/stem | 1.8 | 0.004 |
| Decreased expression
| |||
|---|---|---|---|
| Gene | Normal lineage | Fold change (low-burden/T) | *P value |
| PTEN | luminal | −2.1 | 0.001 |
| TGFBR1 | N/A | −2.3 | 0.028 |
| ERBB3 | luminal | −2.3 | 0.004 |
| CDH1 | luminal | −2.6 | 0.059 |
| CDK2 | N/A | −3.5 | 0.001 |
| MUC1 | luminal | −3.9 | 0.007 |
| VEGFA | N/A | −6.6 | 3.2× 10⁻⁵ |
| CAV2 | basal/stem | −7.5 | 2.3×10⁻⁵ |
| MYC | N/A | −9.8 | 2.3×10⁻⁵ |
| ITGB1 | basal/stem | −11.2 | 9.1 ×10⁻²⁶ |
| PARP2 | luminal prog. | −15.8 | 8.3×10⁻¹¹ |
| EMP1 | luminal | −20.2 | 3.3×10⁻⁷ |
| CD24 | luminal | −28.7 | 1.7×10⁻¹² |
| VIM | N/A | −29.8 | 4.4×10⁻¹⁴ |
N/A, not part of 49-gene signature; that is, not differentially expressed in normal mammary lineages. P values: moderated t-test or Mann–Whitney U test, FDR corrected.
Supplementary Material
Acknowledgments
We thank A. Welm for providing access to PDX tissues developed by her group, which served as the foundation for this study. We also thank K. Lee, R. Kumar, A. Le, R. Daneman, J. Stingl and M. Binneweis for comments and technical contributions. This study was supported by funds from the National Cancer Institute (CA180039 and CA136717), Stand Up To Cancer/AACR (DT0409), the Era of Hope Scholar Award (W81XWH-12-1-0272), the Breast Cancer Research Foundation and the Atwater Foundation, and D. and J. Vander Wall. D.A.L. was supported by a US Department of Defense Congressionally Directed Medical Research Program postdoctoral fellowship (11-1-0742), and C.W. is supported by a grant from the Ministry of Science and Technology, Taiwan (104-2917-I-006-002).
Footnotes
Online Content Methods, along with any additional Extended Data display items and Source Data, are available in the online version of the paper; references unique to these sections appear only in the online paper.
Supplementary Information is available in the online version of the paper.
Single-cell multiplex qPCR data have been deposited in the Gene Expression Omnibus under accession number GSE70555.
The authors declare no competing financial interests.
Readers are welcome to comment on the online version of the paper.
Author Contributions K.T. initiated the PDX models, and along with D.A.L., Y.Y., H.E. and A.Z. performed transplants and maintained serial passages of PDX models. D.A.L., K.D.P., and Y.Y. harvested and analysed PDX tissues. K.D.P. performed histological analysis of PDX mouse tissues. D.A.L., K.D.P., Y.Y., A.Z. and H.E. performed dinaciclib treatment experiments. K.K. performed dinaciclib experiments. P.Y. prepared reduction mammoplasty samples. D.A.L. isolated cells by FACS and performed single-cell dynamic array experiments. N.R.B. designed algorithms for single-cell qPCR analyses in R and contributed to multiplex PCR experimental design. D.A.L. and N.R.B. performed analyses in R. D.A.L. wrote the manuscript, and with K.K. designed figures and schematics. C.-Y.W. and S.B. performed bioinformatics analyses. All authors contributed to experimental design and conceived experiments. A.G. and Z.W. provided overall guidance, funding and assisted in manuscript completion.
References
- 1.Weigelt B, Peterse JL, van’t Veer LJ. Breast cancer metastasis: markers and models. Nature Rev Cancer. 2005;5:591–602. doi: 10.1038/nrc1670. [DOI] [PubMed] [Google Scholar]
- 2.Oskarsson T, Batlle E, Massagué J. Metastatic stem cells: sources, niches, and vital pathways. Cell Stem Cell. 2014;14:306–321. doi: 10.1016/j.stem.2014.02.002. [DOI] [PMC free article] [PubMed] [Google Scholar]
- 3.Hermann PC, et al. Distinct populations of cancer stem cells determine tumor growth and metastatic activity in human pancreatic cancer. Cell Stem Cell. 2007;1:313–323. doi: 10.1016/j.stem.2007.06.002. [DOI] [PubMed] [Google Scholar]
- 4.Pang R, et al. A subpopulation of CD26+ cancer stem cells with metastatic capacity in human colorectal cancer. Cell Stem Cell. 2010;6:603–615. doi: 10.1016/j.stem.2010.04.001. [DOI] [PubMed] [Google Scholar]
- 5.Dieter SM, et al. Distinct types of tumor-initiating cells form human colon cancer tumors and metastases. Cell Stem Cell. 2011;9:357–365. doi: 10.1016/j.stem.2011.08.010. [DOI] [PubMed] [Google Scholar]
- 6.Grigoriadis A, et al. Establishment of the epithelial-specific transcriptome of normal and malignant human breast cells based on MPSS and array expression data. Breast Cancer Res. 2006;8:R56. doi: 10.1186/bcr1604. [DOI] [PMC free article] [PubMed] [Google Scholar]
- 7.Jones C, et al. Expression profiling of purified normal human luminal and myoepithelial breast cells: identification of novel prognostic markers for breast cancer. Cancer Res. 2004;64:3037–3045. doi: 10.1158/0008-5472.can-03-2028. [DOI] [PubMed] [Google Scholar]
- 8.Kendrick H, et al. Transcriptome analysis of mammary epithelial subpopulations identifies novel determinants of lineage commitment and cell fate. BMC Genomics. 2008;9:591. doi: 10.1186/1471-2164-9-591. [DOI] [PMC free article] [PubMed] [Google Scholar]
- 9.Raouf A, et al. Transcriptome analysis of the normal human mammary cell commitment and differentiation process. Cell Stem Cell. 2008;3:109–118. doi: 10.1016/j.stem.2008.05.018. [DOI] [PubMed] [Google Scholar]
- 10.Shehata M, et al. Phenotypic and functional characterisation of the luminal cell hierarchy of the mammary gland. Breast Cancer Res. 2012;14:R134. doi: 10.1186/bcr3334. [DOI] [PMC free article] [PubMed] [Google Scholar]
- 11.Shackleton M, et al. Generation of a functional mammary gland from a single stem cell. Nature. 2006;439:84–88. doi: 10.1038/nature04372. [DOI] [PubMed] [Google Scholar]
- 12.Stingl J, et al. Purification and unique properties of mammary epithelial stem cells. Nature. 2006;439:993–997. doi: 10.1038/nature04496. [DOI] [PubMed] [Google Scholar]
- 13.Lim E, et al. Aberrant luminal progenitors as the candidate target population for basal tumor development in BRCA1 mutation carriers. Nature Med. 2009;15:907–913. doi: 10.1038/nm.2000. [DOI] [PubMed] [Google Scholar]
- 14.DeRose YS, et al. Tumor grafts derived from women with breast cancer authentically reflect tumor pathology, growth, metastasis and disease outcomes. Nature Med. 2011;17:1514–1520. doi: 10.1038/nm.2454. [DOI] [PMC free article] [PubMed] [Google Scholar]
- 15.Dent R, et al. Triple-negative breast cancer: clinical features and patterns of recurrence. Clin Cancer Res. 2007;13:4429–4434. doi: 10.1158/1078-0432.CCR-06-3045. [DOI] [PubMed] [Google Scholar]
- 16.Malik N, Canfield VA, Beckers MC, Gros P, Levenson R. Identification of the mammalian Na,K-ATPase 3 subunit. J Biol Chem. 1996;271:22754–22758. doi: 10.1074/jbc.271.37.22754. [DOI] [PubMed] [Google Scholar]
- 17.Mani SA, et al. The epithelial-mesenchymal transition generates cells with properties of stem cells. Cell. 2008;133:704–715. doi: 10.1016/j.cell.2008.03.027. [DOI] [PMC free article] [PubMed] [Google Scholar]
- 18.Guo W, et al. Slug and Sox9 cooperatively determine the mammary stem cell state. Cell. 2012;148:1015–1028. doi: 10.1016/j.cell.2012.02.008. [DOI] [PMC free article] [PubMed] [Google Scholar]
- 19.Landis MD, Lehmann BD, Pietenpol JA, Chang JC. Patient-derived breast tumor xenografts facilitating personalized cancer therapy. Breast Cancer Res. 2013;15:201. doi: 10.1186/bcr3355. [DOI] [PMC free article] [PubMed] [Google Scholar]
- 20.Cheung KJ, Gabrielson E, Werb Z, Ewald AJ. Collective invasion in breast cancer requires a conserved basal epithelial program. Cell. 2013;155:1639–1651. doi: 10.1016/j.cell.2013.11.029. [DOI] [PMC free article] [PubMed] [Google Scholar]
- 21.Bragado P, et al. TGF-β2 dictates disseminated tumour cell fate in target organs through TGF-β-RIII and p38a/β signalling. Nature Cell Biol. 2013;15:1351–1361. doi: 10.1038/ncb2861. [DOI] [PMC free article] [PubMed] [Google Scholar]
- 22.Kim RS, et al. Dormancy signatures and metastasis in estrogen receptor positive and negative breast cancer. PLoS ONE. 2012;7:e35569. doi: 10.1371/journal.pone.0035569. [DOI] [PMC free article] [PubMed] [Google Scholar]
- 23.Horiuchi D, et al. MYC pathway activation in triple-negative breast cancer is synthetic lethal with CDK inhibition. J Exp Med. 2012;209:679–696. doi: 10.1084/jem.20111512. [DOI] [PMC free article] [PubMed] [Google Scholar]
- 24.Huskey NE, et al. CDK1 inhibition targets the p53-NOXA-MCL1 axis, selectively kills embryonic stem cells, and prevents teratoma formation. Stem Cell Reports. 2015;4:374–389. doi: 10.1016/j.stemcr.2015.01.019. [DOI] [PMC free article] [PubMed] [Google Scholar]
- 25.Parry D, et al. Dinaciclib (SCH 727965), a novel and potent cyclin-dependent kinase inhibitor. Mol Cancer Ther. 2010;9:2344–2353. doi: 10.1158/1535-7163.MCT-10-0324. [DOI] [PubMed] [Google Scholar]
- 26.Luo B, et al. Highly parallel identification of essential genes in cancer cells. Proc Natl Acad Sci USA. 2008;105:20380–20385. doi: 10.1073/pnas.0810485105. [DOI] [PMC free article] [PubMed] [Google Scholar]
- 27.Györffy B, et al. An online survival analysis tool to rapidly assess the effect of 22,277 genes on breast cancer prognosis using microarray data of 1,809 patients. Breast Cancer Res Treat. 2010;123:725–731. doi: 10.1007/s10549-009-0674-9. [DOI] [PubMed] [Google Scholar]
- 28.Nguyen-Ngoc KV, et al. ECM microenvironment regulates collective migration and local dissemination in normal and malignant mammary epithelium. Proc Natl Acad Sci USA. 2012;109:E2595–E2604. doi: 10.1073/pnas.1212834109. [DOI] [PMC free article] [PubMed] [Google Scholar]
- 29.Dalerba P, et al. Single-cell dissection of transcriptional heterogeneity in human colon tumors. Nature Biotechnol. 2011;29:1120–1127. doi: 10.1038/nbt.2038. [DOI] [PMC free article] [PubMed] [Google Scholar]
- 30.Guo G, et al. Resolution of cell fate decisions revealed by single-from zygote to blastocyst. Dev Cell. 2010;18:675–685. doi: 10.1016/j.devcel.2010.02.012. [DOI] [PubMed] [Google Scholar]
- 31.Devonshire AS, Elaswarapu R, Foy CA. Applicability of RNA standards for evaluating RT-qPCR assays and platforms. BMC Genomics. 2011;12:118. doi: 10.1186/1471-2164-12-118. [DOI] [PMC free article] [PubMed] [Google Scholar]
- 32.R. Developoment Core Team. A Language and Environment for Statistical Computing. R Foundation for Statistical Computing; 2012. [Google Scholar]
- 33.McDavid A, et al. Data exploration, quality control and testing in single-cell qPCR-based gene expression experiments. Bioinformatics. 2013;29:461–467. doi: 10.1093/bioinformatics/bts714. [DOI] [PMC free article] [PubMed] [Google Scholar]
Associated Data
This section collects any data citations, data availability statements, or supplementary materials included in this article.


