Abstract
Objective
The aim of this study was to compare growth factor amount contained in platelet rich fibrin (PRF) and compare with that in platelet rich plasma (PRP), and in whole blood. And also to investigate distribution of growth factors and cellular components in PRF.
Materials and Methods
PRF and PRP were obtained from the same sample of peripheral blood. Extraction of proteins were done with lysis buffer, accompanied by freeze and thaw procedures. Concentration of two representative growth factors in platelets: platelet derived growth factor (PDGF) and transforming growth factor beta (TGF-β), were measured with enzyme-linked immunosorbent assay (ELISA). PRF was cut into three parts: (top, middle and bottom), and growth factor concentration was measured respectively. Paraffin embedded section of PRF was observed with Giemsa stain. Immuno-histochemical analysis with anti-PDGF and anti-TGF-β antibodies was also conducted.
Results
The growth factor levels in PRF was higher than in peripheral blood and comparable to those in PRP. Growth factor levels in bottom part of PRF was much higher than in top and middle part. Microscopically, platelets and mono-nucleated cells were concentrated just above the yellow–red interface. Poly-nucleated cells were concentrated below the interface.
Conclusion
The growth factors were surely concentrated in PRF. This result can support basis of good clinical outcomes. For effective application of PRF, the knowledge that growth factors and cells are not equally distributed in PRF should be utilized.
Keywords: Platelet rich fibrin, Growth factor, Mono-nucleated cells, ELISA, Immuno-histochemistry
Introduction
Platelets play great roles not only in hemostasis but also in regenerating damaged tissue. They contain number of growth factors such as platelet derived growth factor (PDGF) [1], transforming growth factor beta (TGF-β) [2]. Platelet rich plasma (PRP) is attracting attention as a safe and cost-effective source of growth factors [3, 4]. Successful experimental [5] and clinical [6, 7] reports have been done. Usually, peripheral blood is collected with anti-coagulant and centrifuged twice to obtain PRP. It can be directly applied or be used after gelation. Calcium ion, thrombin sometimes, is added to gelate PRP.
Platelet rich fibrin (PRF) was developed by Choukroun et al. [8] as a new generation of platelet concentrate. Preparing PRF can be done with a very simple technique. Blood without anti-coagulants is collected into glass surfaced tubes and immediately centrifuged at 400g for 10 min [9]. Two, yellow and red, layered gel can be obtained. Top yellow layer is cut out as PRF. Increasing positive clinical outcomes with PRF have been reported [10–15]. Dohan et al. [16] studied growth factor concentration in the exudate from PRF clot. PDGF and TGF-β levels were no more than supernatant plasma and serum. This result cannot explain forementioned good clinical results. Not very much has been studied to quantitate growth factors contained in the PRF itself.
In this report, growth factor levels in PRF were measured with enzyme-linked immunosorbent assay (ELISA) and compared with whole blood and PRP. The effect of time before centrifugation on growth factor yield was studied. Distribution of growth factors and blood cells in PRF was also studied with ELISA and histological evaluation.
Materials and Methods
This study was performed in accordance with the 1964 Declaration of Helsinki and its later amendments. It was reviewed and approved by an institutional review board. Peripheral blood was collected from five healthy male volunteers (authors: age ranged 32–49), with no history of anti-coagulant and anti-inflammatory drug for previous 4 weeks. For PRP, 5 ml blood was drawn into a polypropylene syringe containing 0.75 ml of anticoagulant; ACD-A solution (2.2 % sodium citrate, 0.8 % citrate, 2.2 % glucose) (Terumo, Tokyo, Japan). For PRF, 5 ml blood was collected without anti-coagulant.
Processing PRP
The blood with anti-coagulant was poured into 15 ml polypropylene centrifuge tube (Corning, Tewksbury, MA, USA) and spun with 400 g for 10 min (2410 Kubota, Tokyo, Japan) at room temperature. The supernatant, including the buffy coat and slightly red layer, was aspirated and transferred to the other tubes. Secondary centrifugation was done at 1200g for 10 min. Clear supernatant (PPP) was aspirated out. The precipitate was resuspended, transferred into an Eppendorf tube as PRP and weighed. Blood cells were counted with a hematology analyzer (LC-152, Horiba, Tokyo, Japan). Samples were stored at −80 °C until growth factor extraction.
Processing PRF
Five milliliter each of blood without anti-coagulant was transferred into a glass centrifuge tube (Hario, Tokyo, Japan). The tubes were let standing still for 0, 15, 30 and 60 min respectively, prior to centrifugation at 400g for 10 min. Two-toned gel was obtained. Interior wall of the centrifuge tube was scraped with a spatula. The gel could be picked out with forceps. Yellow part with red interface was cut out as PRF. Obtained PRF was minced, transferred into Eppendorf tube and weighed. The samples were stored at −80 °C until growth factor extraction.
Growth Factor Extraction and Measurement
One milliliter each of lysis buffer (50 mM Tris–HCl pH7.5, 150 mM NaCl, 1 mM EDTA, 1 mM EGTA, 1 % Triton-X) was added to the sample tubes. They were agitated in a supersonic bath. Freezing at −80 °C and thawing in the supersonic bath was repeated twice. Growth factors were measured with Human PDGF-BB and Human TGF-β1 Quantikine ELISA Kit (R&D Systems, Minneapolis, MN, USA), according to the vendor’s instruction.
Studying Distribution of Growth Factors in PRF
PRF, obtained by immediate centrifugation was cut into three pieces (top, middle and bottom part). Red part of gel and supernatant was also sampled. Growth factor extraction and measurement was done as described above.
Histological Analysis
PRF was fixed with 10 % buffered formaldehyde, paraffin embedded and sectioned. Giemsa stain was done and evaluated. For immuno-histochemical study, deparaffinized and rehydrated sections were microwaved in citrate buffer. 1:50 anti-human PDGFB rabbit antibody (GeneTex, Irvine, CA, USA), 1:100 anti-human TGF-β1 rabbit antibody (Bioworld, Nanjing, China) and phosphate buffered saline for negative control was applied respectively and incubated at 4 °C overnight. 1:100 Rhodamine conjugated anti-rabbit donkey secondary antibody (GeneTex) was applied and incubated for an hour. 1 μg/ml 4′,6-diamino-2-phenylindole(DAPI)(Sigma-Aldrich, St. Louis, MO, USA) was applied for 30 min for nuclear counterstain. The slides were observed under fluorescent microscope (AX80, Olympus, Tokyo, Japan) and images captured with a camera (DP72, Olympus).
Statistical Analysis
The amount of PDGF-BB (ng) in each sampled gel was calculated as the production, the concentration of PDGF-BB (ng/ml) multiplied with the sample volume. Specific gravity used for calculation was 1.050 for PRP and PRF and 1.095 for red part. Yield of the growth factors was calculated as percentage to the amount in respective 5 ml whole blood sample. For PRP study, paired t test was used when homoscedasticity was confirmed, and Wilcoxon matched-pairs signed ranks test was used when not. For multiple comparisons in growth factor study, Tukey’s honest significance test was applied.
Results
Platelet and white blood cell counts of whole blood and PRP are shown in Table 1. Platelets and white blood cell numbers were increased. Growth factor concentrations and total amount are also shown in Table 1. PDGF-BB and TGF-β1 concentration was higher in PRP and PRF than in whole blood.
Table 1.
Blood cell counts between peripheral blood, PRP, and growth factor studies including PRF (n = 5 each)
| Platelet (103/mm3) | White blood cell (103/mm3) | PDGF-BB | TGF-beta1 | |||||
|---|---|---|---|---|---|---|---|---|
| Concentration (ng/ml) | Amount (ng) | Yield (%) | Concentration (ng/ml) | Amount (ng) | Yield (%) | |||
| Whole blood (5 ml + 0.75 ml ACD solution) | 186 ± 55.1 | 4.44 ± 2.29 | 9.50 ± 6.10 | 47.5 ± 30.5 | 100 | 43.2 ± 9.74 | 216 ± 48.7 | 100 |
| PRP (671 ± 128 mg) | 1182 ± 335 | 21.6 ± 15.2 | 38.70 ± 3.27 | 24.9 ± 6.41 | 67.5 ± 32.0 | 144 ± 22.0 | 90.9 ± 12.9 | 44.3 ± 14.4 |
| PRF (706 ± 141 mg) | 25.3 ± 3.38 | 16.9 ± 3.19 | 47.9 ± 29.8 | 122 ± 28.7 | 83.2 ± 29.2 | 42.2 ± 22.2 | ||
| p value | ||||||||
| Wholeblood-PRP | 0.043*w | 0.043*w | 0.001**p | 0.080w | 0.001**p | 0.043*w | ||
| Wholeblood-PRF | 0.011*p | 0.043*w | 0.007*p | 0.043*w | ||||
| PRP-PRF | 0.001**p | 0.043*w | 0.297p | 0.500w | ||||
p paired t test, w Wilcoxon matched-pairs signed ranks test
* p < 0.05, ** p < 0.01
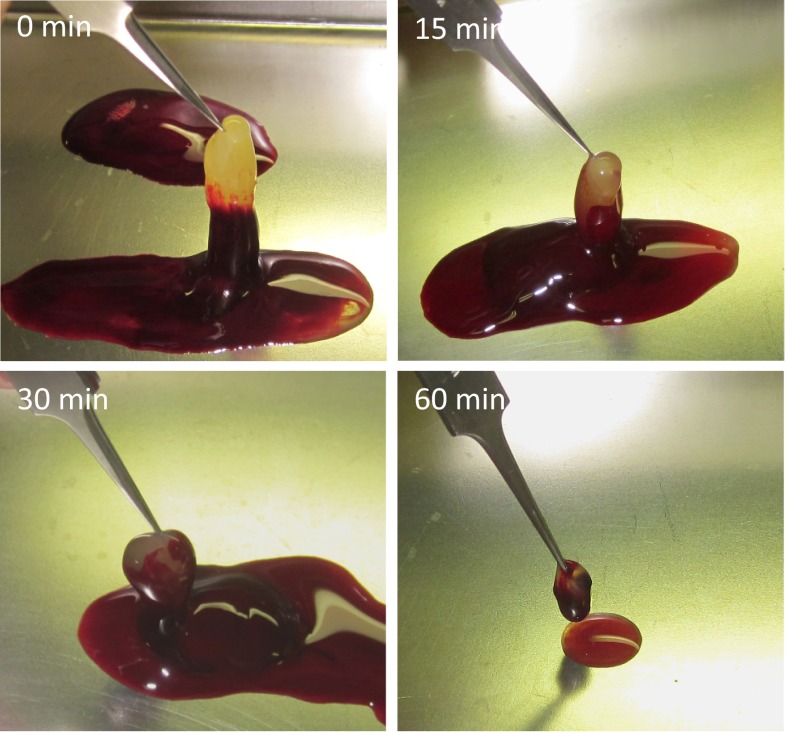
PRF obtained with centrifugation after certain times are shown in Fig. 1. The longer the sitting time before centrifugation, the less yellow gel could be obtained.
Fig. 1.
Obtained PRF, after certain period of sitting time. The longer the sitting time, the smaller the PRF obtained
Weight of PRF, concentration and total amount of PDGF-BB and TGF-β1 in PRF are shown in Table 2. Growth factors in PRF, centrifuged immediately, were proven to be high compared with peripheral blood. In PRF, centrifuged after 15, 30, 60 min, growth factor concentration was not significantly different from peripheral blood. Tukey’s analysis revealed significant difference of PDGF and TGF-β1 yield, between the samples centrifuged immediately and the others after 15, 30 and 60 min (Table 2).
Table 2.
Untreated peripheral blood was poured into glass tubes and let standing still for 0, 15, 30 and 60 min, prior to centrifugation (n = 5 each)
| Weight obtained (mg) | PDGF-BB | TGF-beta1 | |||||
|---|---|---|---|---|---|---|---|
| Concentration (ng/ml) | Amount (ng) | Yield (%) | Concentration (ng/ml) | Amount (ng) | Yield (%) | ||
| PRF | |||||||
| 0 min | 706 ± 141 | 25.3 ± 3.38* | 16.9 ± 3.19 | 47.9 ± 29.8 | 122 ± 28.7* | 83.2 ± 29.2 | 42.2 ± 22.2 |
| 15 min | 650 ± 71.1 | 11.6 ± 4.73ns | 7.11 ± 2.84 | 21.6 ± 15.0 | 65.0 ± 25.1ns | 39.1 ± 12.0 | 18.3 ± 4.70 |
| 30 min | 605 ± 56.1 | 11.6 ± 3.81ns | 6.62 ± 2.11 | 18.5 ± 10.1 | 59.2 ± 25.7ns | 33.6 ± 13.3 | 15.7 ± 5.10 |
| 60 min | 240 ± 77.1 | 9.44 ± 3.03ns | 2.12 ± 0. 99 | 5.73 ± 3.30 | 52.5 ± 13.4ns | 11.9 ± 4.50 | 6.00 ± 3.10 |
| PDGF-BB | 15 min | 30 min | 60 min |
|---|---|---|---|
| 0 min | 0.000** | 0.000** | 0.000** |
| 15 min | 0.988 | 0.023* | |
| 30 min | 0.044* |
| TGF-β1 | 15 min | 30 min | 60 min |
|---|---|---|---|
| 0 min | 0.005** | 0.002** | 0.000** |
| 15 min | 0.958 | 0.100 | |
| 30 min | 0.233 |
Obtained PRF weight, concentration and total amount of growth factors
* p < 0.05, ns not significant. Wilcoxon matched-pairs signed ranks test with peripheral whole blood
p values by Tukey’s honest significance test on calculated total amount of PDGF-BB. * p < 0.05, ** p < 0.01
Tukey’s p value on TGF-β1. ** p < 0.01
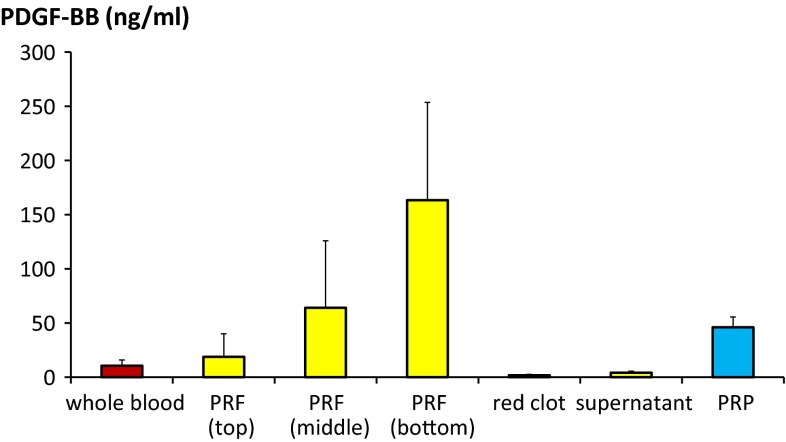
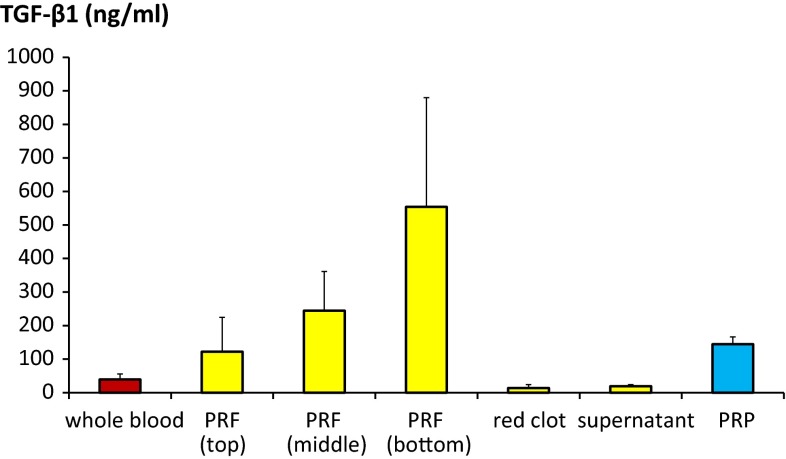
Growth factor concentration distribution study with ELISA is shown in Figs. 2 and 3. Distribution of growth factors was not equal in PRF. Concentration was the highest at bottom part of PRF (Tables 3, 4).
Fig. 2.
PDGF-BB concentration distribution in PRF was measured and compared with whole blood and PRP. Statistical analysis results are shown in Table 3
Fig. 3.
TGF-β1 concentration distribution in PRF was measured and compared with whole blood and PRP. Statistical analysis results are shown in Table 4
Table 3.
PRF was divided into three parts: top, middle and bottom. PDGF-BB concentration was measured (n = 5 each)
| PRF (top) | PRF (middle) | PRF (bottom) | Red clot | Supernatant | PRP | |
|---|---|---|---|---|---|---|
| Whole blood | 1.000 | 0.438 | 0.000** | 1.000 | 1.000 | 0.835 |
| PRF (top) | 0.625 | 0.000** | 0.995 | 0.998 | 0.945 | |
| PRF (middle) | 0.014* | 0.266 | 0.308 | 0.993 | ||
| PRF (bottom) | 0.000** | 0.000** | 0.003** | |||
| Red clot | 1.000 | 0.651 | ||||
| Supernatant | 0.704 |
Based on the same data shown in Fig. 2, multiple comparisons were done and Tukey’s p values are shown
In bottom part of PRF, PDGF-BB concentration was significantly higher than in PRP
* p < 0.05, ** p < 0.01
Table 4.
PRF was divided into three parts: top, middle and bottom. TGF-β1 concentration was measured (n = 5 each)
| PRF (top) | PRF (middle) | PRF (bottom) | Red clot | Supernatant | PRP | |
|---|---|---|---|---|---|---|
| Whole blood | 0.959 | 0.249 | 0.000** | 1.000 | 1.000 | 0.884 |
| PRF (top) | 0.792 | 0.001** | 0.868 | 0.891 | 1.000 | |
| PRF (middle) | 0.020* | 0.146 | 0.164 | 0.904 | ||
| PRF (bottom) | 0.000** | 0.000** | 0.001** | |||
| Red clot | 1.000 | 0.740 | ||||
| Supernatant | 0.773 |
Based on the same data shown in Fig. 3, multiple comparisons were done and Tukey’s p values on concentration in different parts are shown
* p < 0.05, ** p < 0.01
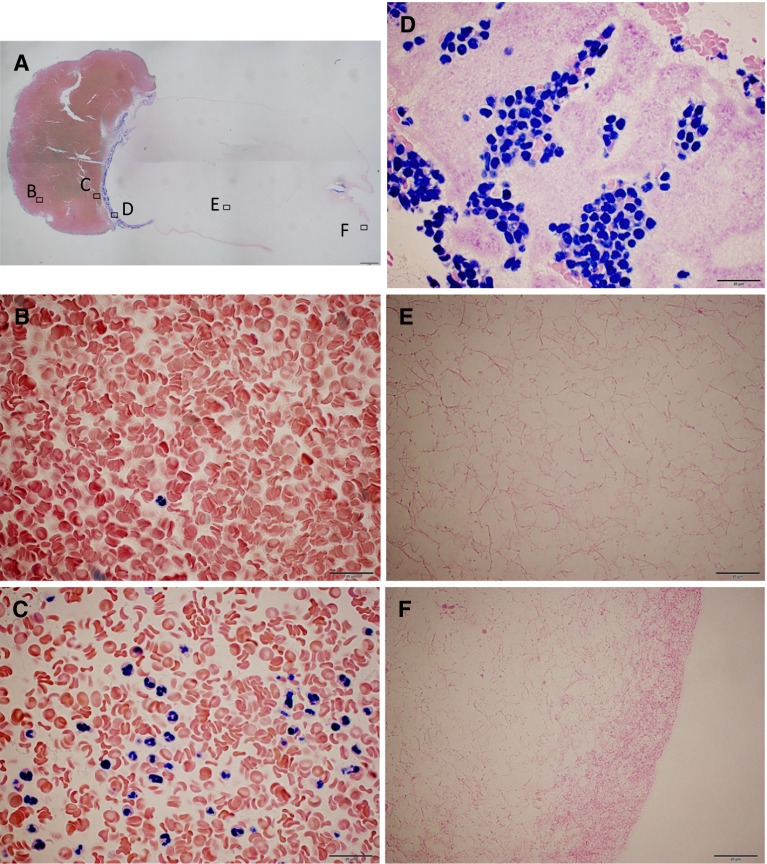
Histological observation revealed that platelets were dense at interface of yellow and red part of the gel (Fig. 4). Mono-nucleated cells were seen almost at the same area where platelets were. Poly-nucleated cells were seen on the red side of the interface.
Fig. 4.
Formaldehyde fixed PRF, obtained by immediate centrifugation. It was paraffin embedded, sectioned and Giemsa stained. A Combined pictures taken with ×2 objective lens. A bar indicates 1 mm. Alphabets indicate where high magnification images were taken. B Red clot area. Other cells than red blood cells were rare to be seen. C Just below the red–yellow interface. Most of the nucleated cells were multinucleated. D Bottom of yellow area. Mono-nucleated cells intermingled with packed platelets. E Middle area of the PRF. No cells could be seen in amorphous fibrin network. F Top surface of the PRF (B–F taken with ×100 objective lens. Bars indicate 20 μm)
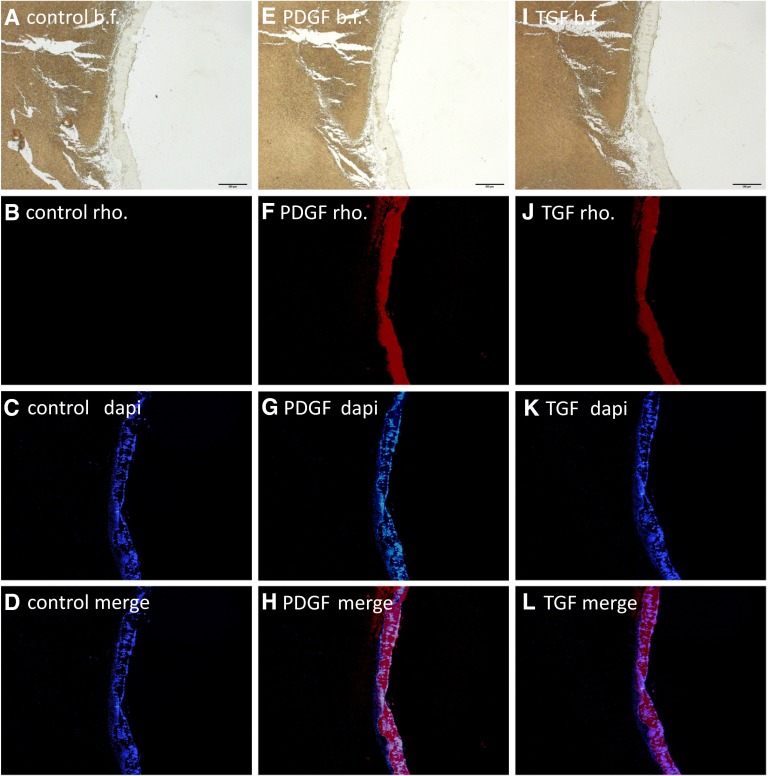
Immuno-histological study showed that PDGF and TGF-β concentration was high where the platelets were (Fig. 5). Dense signal was seen at the bottom of yellow clot. No signal could be identified at the center of PRF. Only scarce signal, which was hardly distinguished from noise, could be seen at the side wall of PRF (Data not shown).
Fig. 5.
Immuno-histochemical images, using rhodamine conjugated secondary antibody, taken with ×4 objective lens. First row (A, E, I): Bright field. Bars indicate 500 μm. Second row (B, F, J): Fluorescent for rhodamine. Third row (C, G, K): Fluorescent for DAPI. Fourth row (D, H, L): Merged images of second and third row. First column (A–D): no anti-body was applied. Secondary column (E–H): anti-PDGFB. Third column (I–L): anti-TGF-β1
Discussion
Growth factors concentrated in PRP have been reported previously. Among them, PDGF and TGF-β are two representative growth factors with the reasonable concentration of nanogram per milliliter order, to make effect clinically. Whereas, the others e.g.: vascular endothelial growth factor, epidermal growth factor and so on stays in pictogram per milliliter order [4]. Thus, PDGF and TGF-β were chosen to measure in this study.
Cytometry analysis and growth factors levels measured of PRP in this study were the same level as were in previous studies [4, 17]. This reproducibility can support the appropriateness of the experimental technique of our study.
Since Choukroun et al. developed [8], PRF has been gradually accepted as an variety of platelet concentrate, which can be obtained with simple and easy technique. Clinical reports with good results are accumulating [10–15]. Though, in Dohan’s report [16], PDGF and TGF-β levels in PRF exudate were not very much different from serum, which is discrepant from clinical reports. To date, only one report, describing growth factor (PDGF alone) level in PRF itself [18], can be found. Our study correlates with the previous one [18], showing that growth factors contained in platelets are surely concentrated in PRF. These results can account those good clinical experiences.
This study showed significant differences between PRP and PRF in PDGF concentration and total amount. Whereas, no significance were shown in TGF-β. It is difficult to explain this discrepancy. It may be due to the difference of secretion mechanism from platelets or to the small sampling size.
Advantage of PRF to PRP is in the simplicity and the quickness of preparation process. For PRF, no anti-coagulant is needed. Only one time centrifugation is required, where transferring from one tube to another between two centrifugations is required for PRP. When gel with concentrated growth factors is demanded, PRF is a good option.
Sitting time before centrifugation changed the yield of growth factors in PRF. The growth factors concentration in red part and supernatant increased, as the sitting time got longer. (Data not shown) They were assumed to be released spontaneously and diffused before centrifugation. Centrifugation machine should be prepared not far from the place of blood withdrawal, to assure the growth factor yield.
Both ELISA and immuno-histochemical study revealed that growth factors were not equally distributed in PRF. A previous report, divided PRF in two parts, showed that PDGF concentration was higher in lower half [18]. In our result, which can support their report, growth factors were concentrated at the red-yellow interface and not as much in the above area. As Figs. 2 and 3 and Tables 3 and 4 show, in bottom third of PRF, growth factors were significantly highly concentrated than in PRP. With Giemsa stain, it was amorphous with no cellular bodies in most of the area of PRF. Platelets were dense at the interface, where the growth factor was high. It was hard to distinguish whether the platelets were activated or not. Mono-nucleated cells intermingled with the platelets. Poly-nucleated cells were seen below the interface. The distribution was proportional to the specific gravity of the cells. This implies that gelation occurred after the cells were distributed by the centrifugation.
Dohan et al. explained that activation of most platelets of the blood sample occur in contact with the glass tube walls initially, and release the coagulation cascades [9]. Though, it is known that blood coagulation is prolonged in glass test tube without Hageman factor (factor XII) [19, 20], which is the starting point of intrinsic pathway. The factor is activated by the contact with negatively charged surfaces [21] e.g. collagen or glass. It seems reasonable to presume that gelation inside the glass centrifuge tube is initiated in the same way. Platelets are speculated to be activated by the products of intrinsic pathway cascade.
Conclusion
Although the sampling size was small, this pilot study can concludes that PDGF and TGF-β are surely concentrated in PRF. Centrifugation should be begun immediately after the blood collection to retrieve growth factors effectively, before intrinsic pathway activates. Mono-nucleated cells, platelets and growth factor were concentrated at the yellow–red interface area. Knowledge of the distribution serves benefits in clinical PRF application.
Acknowledgments
No funding was received for the preparation of this article. The authors have no financial interest in any of the products or devices mentioned in the article.
References
- 1.Ross R. Platelets: cell proliferation and atherosclerosis. Metabolism. 1979;28:410–414. doi: 10.1016/0026-0495(79)90047-7. [DOI] [PubMed] [Google Scholar]
- 2.Assoian RK, Komoriya A, Meyers CA, et al. Transforming growth factor-beta in human platelets. Identification of a major storage site, purification, and characterization. J Biol Chem. 1983;258:7155–7160. [PubMed] [Google Scholar]
- 3.Marx RE, Carlson ER, Eichstaedt RM, et al. Platelet-rich plasma: growth factor enhancement for bone grafts. Oral Surg Oral Med Oral Pathol Oral Radiol Endod. 1998;85:638–646. doi: 10.1016/S1079-2104(98)90029-4. [DOI] [PubMed] [Google Scholar]
- 4.Eppley BL, Woodell JE, Higgins J. Platelet quantification and growth factor analysis from platelet-rich plasma: implications for wound healing. Plast Reconstr Surg. 2004;114:1502–1508. doi: 10.1097/01.PRS.0000138251.07040.51. [DOI] [PubMed] [Google Scholar]
- 5.Wiltfang J, Kloss FR, Kessler P, et al. Effects of platelet-rich plasma on bone healing in combination with autogenous bone and bone substitutes in critical-size defects. An animal experiment. Clin Oral Implants Res. 2004;15:187–193. doi: 10.1111/j.1600-0501.2004.00980.x. [DOI] [PubMed] [Google Scholar]
- 6.Crovetti G, Martinelli G, Issi M, et al. Platelet gel for healing cutaneous chronic wounds. Transfus Apher Sci. 2004;30:145–151. doi: 10.1016/j.transci.2004.01.004. [DOI] [PubMed] [Google Scholar]
- 7.Oyama T, Nishimoto S, Tsugawa T, Shimizu F. Efficacy of platelet-rich plasma in alveolar bone grafting. J Oral Maxillofac Surg. 2004;62:555–558. doi: 10.1016/j.joms.2003.08.023. [DOI] [PubMed] [Google Scholar]
- 8.Choukroun J, Adda F, Schoeffler CVA. Une opportunité en paro-implantologie: le PRF. Implantodontie. 2001;42:55–62. [Google Scholar]
- 9.Dohan DM, Choukroun J, Diss A, et al. Platelet-rich fibrin (PRF): a second-generation platelet concentrate. Part I: technological concepts and evolution. Oral Surg Oral Med Oral Pathol Oral Radiol Endod. 2006;101:e37–e44. doi: 10.1016/j.tripleo.2005.07.008. [DOI] [PubMed] [Google Scholar]
- 10.Saluja H, Dehane V, Mahindra U. Platelet-Rich fibrin: a second generation platelet concentrate and a new friend of oral and maxillofacial surgeons. Ann Maxillofac Surg. 2011;1:53–57. doi: 10.4103/2231-0746.83158. [DOI] [PMC free article] [PubMed] [Google Scholar]
- 11.Sharma A, Pradeep AR. Treatment of 3-wall intrabony defects in patients with chronic periodontitis with autologous platelet-rich fibrin: a randomized controlled clinical trial. J Periodontol. 2011;82:1705–1712. doi: 10.1902/jop.2011.110075. [DOI] [PubMed] [Google Scholar]
- 12.Ruga E, Gallesio C, Boffano P. Platelet-rich fibrin and piezoelectric surgery: a safe technique for the prevention of periodontal complications in third molar surgery. J Craniofac Surg. 2011;22:1951–1955. doi: 10.1097/SCS.0b013e31822ea76b. [DOI] [PubMed] [Google Scholar]
- 13.Chignon-Sicard B, Georgiou CA, Fontas E, et al. Efficacy of leukocyte- and platelet-rich fibrin in wound healing: a randomized controlled clinical trial. Plast Reconstr Surg. 2012;130:819e–829e. doi: 10.1097/PRS.0b013e31826d1711. [DOI] [PubMed] [Google Scholar]
- 14.Singh A, Kohli M, Gupta N. Platelet rich fibrin: a novel approach for osseous regeneration. J Maxillofac Oral Surg. 2012;11:430–434. doi: 10.1007/s12663-012-0351-0. [DOI] [PMC free article] [PubMed] [Google Scholar]
- 15.Girish Rao S, Bhat P, Nagesh KS, et al. Bone regeneration in extraction sockets with autologous platelet rich fibrin gel. J Maxillofac Oral Surg. 2013;12:11–16. doi: 10.1007/s12663-012-0370-x. [DOI] [PMC free article] [PubMed] [Google Scholar]
- 16.Dohan DM, Choukroun J, Diss A, et al. Platelet-rich fibrin (PRF): a second-generation platelet concentrate. Part II: platelet-related biologic features. Oral Surg Oral Med Oral Pathol Oral Radiol Endod. 2006;101:e45–e50. doi: 10.1016/j.tripleo.2005.07.009. [DOI] [PubMed] [Google Scholar]
- 17.Nishimoto S, Oyama T, Matsuda K. Simultaneous concentration of platelets and marrow cells: a simple and useful technique to obtain source cells and growth factors for regenerative medicine. Wound Repair Regen. 2007;15:156–162. doi: 10.1111/j.1524-475X.2006.00196.x. [DOI] [PubMed] [Google Scholar]
- 18.Pluemsakunthai W, Kuroda S (2013) A basic analysis of platelet-rich fibrin: distribution and release of platelet-derived growth factor-BB. Inflammation and Regeneration. doi: 10.2492/inflammregen.33.164
- 19.Margolis J. Initiation of blood coagulation by glass and related surfaces. J Physiol. 1957;137:95–109. doi: 10.1113/jphysiol.1957.sp005799. [DOI] [PMC free article] [PubMed] [Google Scholar]
- 20.Ratnoff OD, Rosenblum JM. Role of Hageman factor in the initiation of clotting by glass; evidence that glass frees Hageman factor from inhibition. Am J Med. 1958;25:160–168. doi: 10.1016/0002-9343(58)90023-8. [DOI] [PubMed] [Google Scholar]
- 21.Wilner GD, Nossel HL, LeRoy EC. Activation of Hageman factor by collagen. J Clin Invest. 1968;47:2608–2615. doi: 10.1172/JCI105943. [DOI] [PMC free article] [PubMed] [Google Scholar]


