Abstract
The A2B adenosine receptor (AR) has emerged as a unique member of the AR family with contrasting roles during acute and chronic disease states. We utilized zinc-finger nuclease technology to create A2BAR gene (Adora2b)-disrupted rats on the Dahl salt-sensitive (SS) genetic background. This strategy yielded a rat strain (SS-Adora2b mutant rats) with a 162-base pair in-frame deletion of Adora2b that included the start codon. Disruption of A2BAR function in SS-Adora2b mutant rats was confirmed by loss of agonist (BAY 60-6583 or NECA)-induced cAMP accumulation and loss of interleukin-6 release from isolated fibroblasts. In addition, BAY 60-6583 produced a dose-dependent increase in glucose mobilization that was absent in SS-Adora2b mutants. Upon initial characterization, SS-Adora2b mutant rats were found to exhibit increased body weight, a transient delay in glucose clearance, and reduced proinflammatory cytokine production following challenge with lipopolysaccharide (LPS). In addition, blood pressure was elevated to a greater extent (∼15–20 mmHg) in SS-Adora2b mutants as they aged from 7 to 21 weeks. In contrast, hypertension augmented by Ang II infusion was attenuated in SS-Adora2b mutant rats. Despite differences in blood pressure, indices of renal and cardiac injury were similar in SS-Adora2b mutants during Ang II-augmented hypertension. We have successfully created and validated a new animal model that will be valuable for investigating the biology of the A2BAR. Our data indicate varying roles for A2BAR signaling in regulating blood pressure in SS rats, playing both anti- and prohypertensive roles depending on the pathogenic mechanisms that contribute to blood pressure elevation.
Keywords: Adenosine, Adenosine receptor, Gene targeting, Hypertension, Angiotensin, Metabolic disease
Introduction
The purine nucleoside adenosine is an important autocrine/paracrine factor. Among its four G-protein coupled receptors (A1, A2A, A2B, A3), the A2B adenosine receptor subtype (A2BAR; encoded by the Adora2b gene) has low affinity for adenosine [1]. However, it is rapidly induced during hypoxia due to the presence of hypoxia-inducible factor-1 (HIF-1) elements within its gene promoter [2]. Moreover, expression of the A2BAR is enhanced during inflammation [3–5]. A2BARs are uniquely coupled to both Gs and Gq proteins and activate divergent intracellular signaling pathways [1, 6, 7]. Expression of the A2BAR is widespread, although particularly prominent in blood vessels, epithelial cells, fibroblasts, and various leukocyte populations including macrophages [1, 4, 5, 8, 9]. Interestingly, recent studies by Moriyama and Sitkovsky [10] have demonstrated that a large portion of A2BARs expressed in cells is degraded in the proteasome due to the lack of a dominant forward transport signal from the endoplasmic reticulum to the plasma membrane and that surface expression is enhanced in the presence of the A2AA R potentially due to heterodimer formation. Thus, new evidence is emerging that knockdown or changes in expression of one AR subtype may influence the expression and signaling properties of the others [10].
Substantial progress has been made in deciphering the biological function of the A2BAR due to the availability of Adora2b−/− mice (B6 genetic background) [8]. A2BAR signaling has been implicated in controlling inflammatory responses and both glucose and lipid metabolism relevant to metabolic diseases [11, 12]. Specifically, current evidence from studies with Adora2b−/− mice suggests that A2BAR signaling suppresses tissue inflammation, which is protective against insulin resistance, diabetes, obesity, and atherosclerosis [11, 12]. In addition, numerous studies with Adora2b−/− mice also provide evidence that A2BAR signaling provides protection against acute ischemic and inflammatory insults [13–15]. Curiously, however, substantial evidence from studies with Adora2b−/− mice suggests that A2BAR signaling can also contribute to adverse tissue remodeling and fibrosis that occurs in chronic inflammatory disease states [3, 16, 17]. This has been explained by an effect of the A2BAR to stimulate the production of proangiogenic and tissue-healing factors such as IL-6, vascular endothelial growth factor (VEGF), chemokine (C-X-C motif) ligand 1 (CXCL1), and likely others that cause inflammation, angiogenesis, fibrosis, and organ dysfunction with continual or repeated exposure [3, 16, 17]. Notably, A2BAR stimulation has been linked with elevated blood pressure and renal injury during experimental hypertension in mice [18]. In these studies, chronic hypertension induced by angiotensin II (Ang II) infusion was reduced by 50 % in Adora2b−/− mice [18]. In addition, a destructive action of A2BAR signaling has been observed in experimental models of chronic diseases of the lungs (relevant to asthma and chronic obstructive pulmonary disease [19]), liver (alcohol-induced steatosis [20]), kidneys (chronic renal disease [21]), and penis (priapism [22]). Based on these findings, A2BAR antagonism has emerged as an attractive therapeutic target for treatment of a myriad of chronic diseases. However, essentially all previous work focused on investigating the biology of the A2BAR has been conducted in models utilizing mice. For this reason, there is a need to create additional animal models to examine the role of the A2BAR during normal and pathophysiological states.
In this study, we describe the development of a new mutant rat line with genetic disruption of Adora2b created using the zinc-finger nuclease (ZFN) strategy [23, 24]. The rat line was created on the Dahl salt-sensitive (SS) genetic background to facilitate the study of A2BAR signaling during hypertension. SS rats exhibit a low-renin, salt-sensitive form of hypertension and progressive glomerulosclerosis that leads to end-stage renal disease [25]. We report that genetic disruption of Adora2b in SS rats causes several phenotypic differences including increased body weight, decreased glucose disposal, and suppressed proinflammatory cytokine production. Surprisingly, blood pressure was elevated to a greater extent in SS-Adora2b mutant rats upon maturation, although the extent of hypertension in response to Ang II infusion was reduced. The SS-Adora2b mutant rat is a valuable new tool to study the biology of the A2BAR. Our results support the idea that A2BAR signaling participates in blood pressure regulation during experimental hypertension.
Methods
Animals
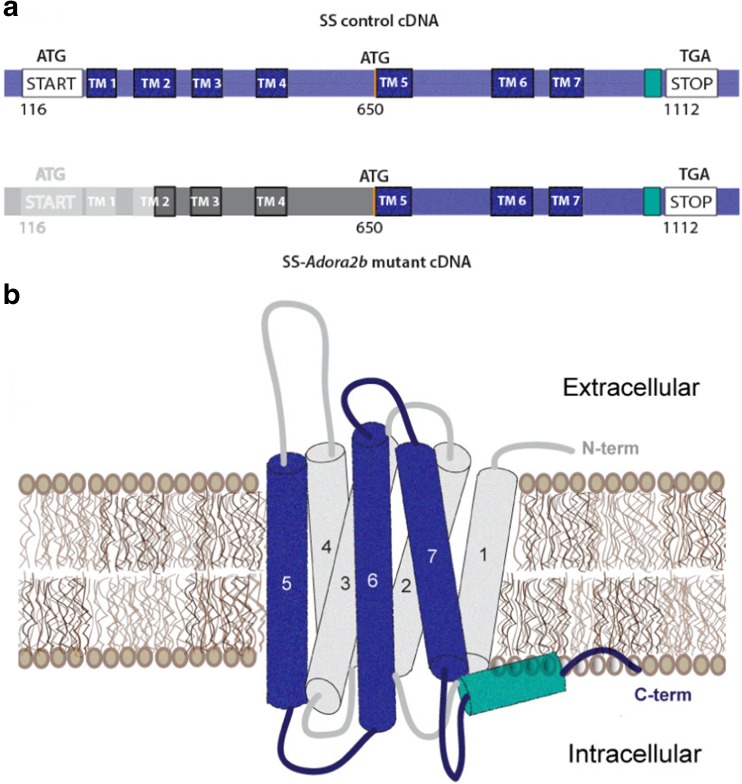
All animal procedures and breeding were performed at the Medical College of Wisconsin with approval of the Institutional Animal Care and Use Committee. The Adora2b mutant rat line was created using ZFN technology, as previously described [23, 24]. ZFN constructs were designed, assembled, and validated by Sigma-Aldrich (St. Louis, MO) to target bases in exon 1 (NCBI reference sequence: NM_017161.1) of the rat (Rattus norvegicus) Adora2b where each member of a heterodimeric ZFN pair binds to the underlined sequence on complementary DNA strands (ZFN target sequence: AACTACTTTCTGGTGTccctgGCGACGGCGGACGTGGCT). mRNAs encoding each ZFN pairs were prepared in injection buffer (10 mM Tris, 0.1 mM EDTA, pH 7.5) at a concentration of 10 ng/μl and injected into the pronucleus of fertilized SS one-cell embryos. Injected embryos were transferred to pseudopregnant females. At weaning, DNA was extracted from tail tissues and screened for ZFN-induced mutation by the Surveyor nuclease assay, as described previously [23, 24]. Extracted tail DNA was PCR-amplified with forward (5′–3′) and reverse primers (F: 5′-ACACAACCCCGGTAGAGGA-3′ and R: 5′-GATGGAGCTCTGTGTGAGCA-3′). The PCR products were cloned into the TOPO TA-cloning vector (Invitrogen) and subjected to standard sequencing. Among several mutant founders, one founder rat harboring a 162-base pair in-frame deletion (see Fig. 1) in exon 1 of Adora2b including the start codon was used for subsequent phenotyping. This founder rat was backcrossed to the parental SS strain and heterozygous progeny from subsequent generations were intercrossed to generate homozygous mutant animals. Experiments were performed on age-matched, parental male SS rats (hereafter called SS rats) and Adora2b mutant rats (officially designated SS-Adora2bem2Mcwi hereafter called SS-Adora2b mutant rats). Rat breeders and weanlings were fed a Teklad 7034 (T 0.3) diet (Harlan Laboratories Inc., Teklad diets, Madison, WI) containing 0.12 % NaCl.
Fig. 1.
Schematic representation of the A2BAR cDNA and protein sequence in SS-Adora2b mutant rats. SS-Adora2b mutant rats contain a 162-bp in-frame deletion that results in the removal of the start codon. Assuming translation proceeds utilizing the next potential start codon located at position 650, SS-Adora2b mutant rats are predicted to express a truncated form of the A2BAR consisting of transmembrane segments 5–7 and the C terminus. a Schematic illustration of cDNA sequence (deleted segment = gray; region predicted to be untranslated = dark gray). b 3-D illustration of the A2BAR protein predicted to be expressed in the mutant rat line (expressed regions = blue/green; unexpressed regions = gray)
Isolation of dermal and pulmonary fibroblasts
Dermal and pulmonary fibroblasts were isolated by collagenase digestion, as previously described [26]. To obtain dermal fibroblasts, ear samples were incubated in HBSS containing 0.51 mg/ml of collagenase (from Clostridium histolyticum; Sigma-Aldrich, St. Louis, MO) for 30 min (37 °C), after which the cells were pelleted by centrifugation and reincubated for 20 min (37 °C) in 0.5 ml of 1× trypsin-EDTA. To obtain pulmonary fibroblasts, lung tissue was incubated in 1× PBS containing 0.1 mg/ml of collagenase (type II from Worthington Biochemical Corporation, Lakewood, NJ) for ∼1 h (37 °C). During incubation, the digestion mixtures were constantly agitated by rocking and periodically forced through a 16-gauge needle to ensure adequate digestion. Once single-cell suspensions were achieved, the cells were washed by centrifugation and resuspended in DMEM/F-12 media supplemented with 10 % fetal calf serum, 100 U/ml penicillin, 100 g/ml streptomycin, and 0.25 g/ml fungizone. The cells were allowed to adhere to 3-cm tissue culture dishes for 2–5 days until confluence and were used up to passage 3.
Cyclic adenosine monophosphate measurements
Pulmonary fibroblasts obtained from SS control or SS-Adora2b mutant rats were treated with the selective A2BAR agonist BAY 60-6583 (BAY; Tocris Biosciences, Bristol, UK), the nonselective agonist adenosine-5′-N-ethylcarboxamide (NECA; Sigma-Aldrich, St. Louis, MO), or forskolin (Sigma-Aldrich) at the indicated concentrations for 1 h in the presence of the phosphodiesterase inhibitor Ro 20-1724 (20 M; Tocris Biosciences, Bristol, UK). Subsequently, the cells were lysed with 0.1-M HCl for 30 min at 4 °C. The lysate was stored at −20 °C until assayed for cyclic adenosine monophosphate (cAMP) content using a competitive protein binding assay. For the binding assay, the samples were diluted appropriately in 0.1-M HCl and incubated with 240-μg protein kinase A binding protein (obtained from bovine adrenal tissue) and [3H]-cAMP (11,000 cpm/tube; PerkinElmer Life Sciences Inc., Waltham, MA) for 2.5 h at 4 °C. The reaction mixture was filtered through glass microfiber filters (Whatman GF/B, Brandel Inc., Gaithersburg, MD), and the trapped radioactivity was determined by scintillation counting. The cAMP concentration in samples was calculated from standard curves.
Cytokine measurements
Levels of cytokines in culture media or plasma samples were determined using either multi-array assay plates (MSD, Rockville, MD) or individual ELISA kits (R & D Systems, Minneapolis, MN), as indicated. The MSD multi-array assay plates were analyzed using a MESO SECTOR S 600 imager and analyzed using Discovery Workbench 4.0 (MSD).
Glucose tolerance tests and assessment of BAY-induced hyperglycemia
Blood glucose levels were measured from tail-prick blood samples with a One-Touch Ultra Glucometer (LifeScan Inc., Milpitas, CA) after a 6-h fast. For glucose tolerance tests, rats were administered an intraperitoneal (i.p.) injection of sterile glucose (2 g/kg in HPLC-graded sterile water), after which glucose measurements were obtained at scheduled intervals. For assessment of A2BAR-induced hyperglycemia, rats were administered an i.p. injection of BAY dissolved in polyethylene glycol.
Blood pressure measurements and urine collections
Systolic blood pressure was obtained in the conscious state using an automated tail-cuff blood pressure analyzer (IITC Life Sciences Inc., Woodland Hills, CA). Blood pressure was monitored at the same time each day (9–11 am) to minimize circadian effects. With all measurements, the rats were positioned randomly in the blood pressure analyzer device, and the investigators were blinded to the genotype of the rats. At scheduled intervals, the rats were housed in metabolic cages for 24-h urine collections. Urine was assayed for protein content (Protein Determination Kit, Cayman Chemical Co., Ann Arbor, MI) and creatinine (Urinary Creatinine Colorimetric Assay Kit, Cayman Chemical Co.).
Echocardiography
Rats were anesthetized with 1–2 % isoflurane in a 100 % oxygen mix administered via a nose cone and maintained at 37 °C. Transthoracic echocardiography was performed using a Vevo 770 high-frequency ultrasound system (FUJIFILM VisualSonics Inc., Toronto, Canada) using a RMV 710 scanhead (12.5–37.5 mHz). Electrocardiogram and heart rate were monitored throughout the imaging procedure. Measurements were made off-line by blinded readers from the left ventricular parasternal long axis B- and M-mode views to assess cardiac structure and function.
Angiotensin II infusion protocol
Under isoflurane anesthesia, mini-osmotic pumps (Alzet model 2004; Durect Corporation, Cupertino, CA) were implanted subcutaneously at the dorsum of the neck to infuse Ang II (Phoenix Pharmaceuticals, Burlingame, CA) at a rate of 200 ng/kg/min for a period of 28 days.
Cardiac and renal histology
Hearts and kidneys were fixed in 10 % zinc formalin for 24 h and 10 % formalin for 3–4 days, respectively, prior to paraffin-embedding and sectioning (performed by the histology core of the Children’s Research Institute, Milwaukee, WI). Before excision, hearts were perfused with 20 ml of ice-cold cardioplegic solution (25 mEq/l KCl and 5 % dextrose in PBS) to allow for fixation during diastole. For staining with picrosirius red (PSR) to assess cardiac and renal fibrosis, sections were deparaffinized, rehydrated, and subsequently stained in 0.1 % Sirius Red in saturated picric acid for 1 h. The stained sections were then washed twice in dilute HCl (0.01 N), dehydrated three times in ethanol, and cleared in xylene before mounting. Slides were visualized using a Nikon Eclipse E-55i microscope, and fluorescent images (emission wavelength 600–660 nm, Texas Red) were recorded for quantification of cardiac fibrosis in a blinded fashion. The extent of interstitial fibrosis was assessed in a minimum of 20 fields (×20 magnification) and expressed as the collagen volume fraction [as the percentage of fluorescing pixels in the total tissue area] using ImageJ software.
Data analysis
Data are reported as means ± SEM. All data were compared by Student’s t test, with the exception of the echocardiography data from the Ang II infusion study that was assessed by two-way repeated measures ANOVA followed by Tukey’s multiple comparisons test. A p value <0.05 was considered statistically significant.
Results
Documentation of Adora2b mutation in rats
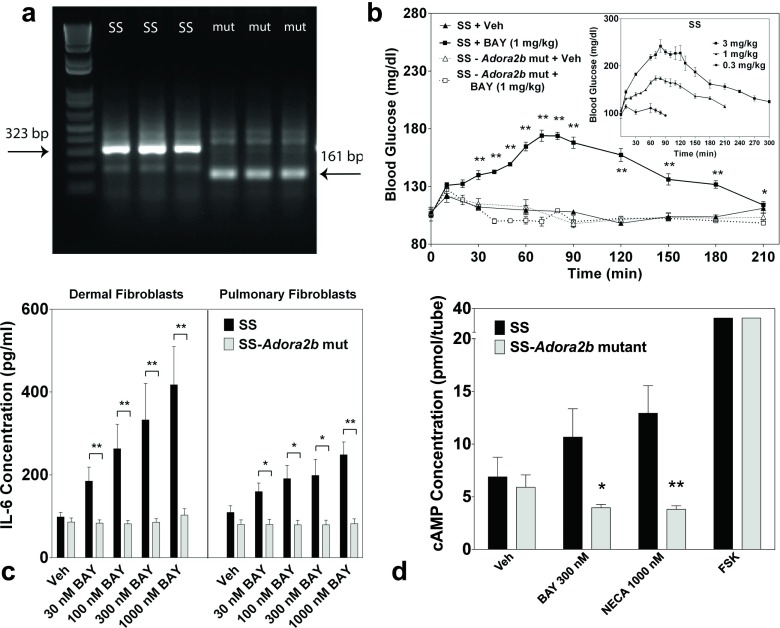
To investigate the function of the A2BAR in SS rats, ZFNs were designed to target Adora2b resulting in the creation of a mutant rat strain, designated SS-Adora2bem2Mcwi (referred to as SS-Adora2b mutant rats). Sequencing of the strain revealed a 162-bp in-frame deletion within exon 1 of Adora2b that included the initiator codon. Verification of mutation was confirmed by PCR (Fig. 2a). The R. norvegicus A2BAR complementary DNA (cDNA) sequence indicating the deleted segment is shown in Fig. 1a. Based on the location of the next potential in-frame initiator codon, sequence analysis predicts that this rat line may produce a truncated A2BAR protein consisting of only 154 amino acids (original length = 332 amino acids) that lacks the amino terminus, intracellular loops 1 and 2, extracellular loops 1 and 2, and the first 4 transmembrane segments (Fig. 1b). Expression of a truncated form of the A2BAR protein in the SS-Adora2b mutant rats could not be verified by Western immunoblotting or immunohistochemistry due to the lack of useful, high-affinity anti-A2BAR antibodies. However, disruption of A2BAR function was confirmed in the SS-Adora2b mutants by loss of BAY-induced hyperglycemia and loss of BAY-induced release of IL-6 from isolated pulmonary and dermal fibroblasts (Fig. 2b, c). We also observed loss of BAY- and NECA-induced cAMP elevation in cultured pulmonary fibroblasts isolated from SS-Adora2b mutants (Fig. 2d) and loss of NECA-induced elevation in plasma IL-6 content (not shown).
Fig. 2.
Validation of functional absence of A2BAR signaling in SS-Adora2b mutant rats. a Mutation of Adora2b in SS-Adora2b mutant rats confirmed by PCR. PCR was performed using DNA obtained from tail or ear snips and primers that flank the deleted segment, as described in the “Methods” section. Gel lanes labeled “SS” correspond to DNA from three SS controls (323-bp fragment) and lanes labeled “mut” correspond to DNA from three SS-Adora2b mutant rats (161-bp fragment) confirming a 162-bp deletion. b Loss of BAY-induced hyperglycemia in SS-Adora2b mutant rats. SS control or SS-Adora2b mutant rats (n = 3–6 male rats/group) were injected i.p. with 1 mg/kg BAY or vehicle, and the blood glucose concentration was measured with a One-Touch Ultra Glucometer at the times indicated. (Inset) Dose-response relationship of BAY to induce hyperglycemia in SS rats. n = 3–6 male rats/dose. *p < 0.05 and **p < 0.01 vs. the vehicle-treated SS control group by Student’s t test. c Loss of BAY-induced IL-6 secretion by dermal or pulmonary fibroblasts isolated from SS-Adora2b mutant rats. Following a 24-h serum deprivation, dermal or pulmonary fibroblasts were stimulated with increasing concentrations of BAY for 24 h, after which the media was collected and assayed for IL-6 content by ELISA. n = 3–10; *p < 0.05 and **p < 0.01 vs. the SS control group by Student’s t test. d Loss of BAY- and NECA-induced cAMP accumulation in pulmonary fibroblasts isolated from SS-Adora2b mutant rats. Fibroblasts were treated with BAY (0.3 μM) or NECA (1 μM) for 1 h in the presence of the phosphodiesterase inhibitor Ro-20-1274 (20 μM). Intracellular accumulation of cAMP was assessed using a competition protein binding assay, as described in the “Methods” section. Forskolin (10 M) was used as a positive control. Data are means ± SEM. n = 5; *p < 0.05 and **p < 0.01 vs. the SS control group by Student’s t test
Lipopolysaccharide-induced cytokine production is reduced in SS-Adora2b mutant rats
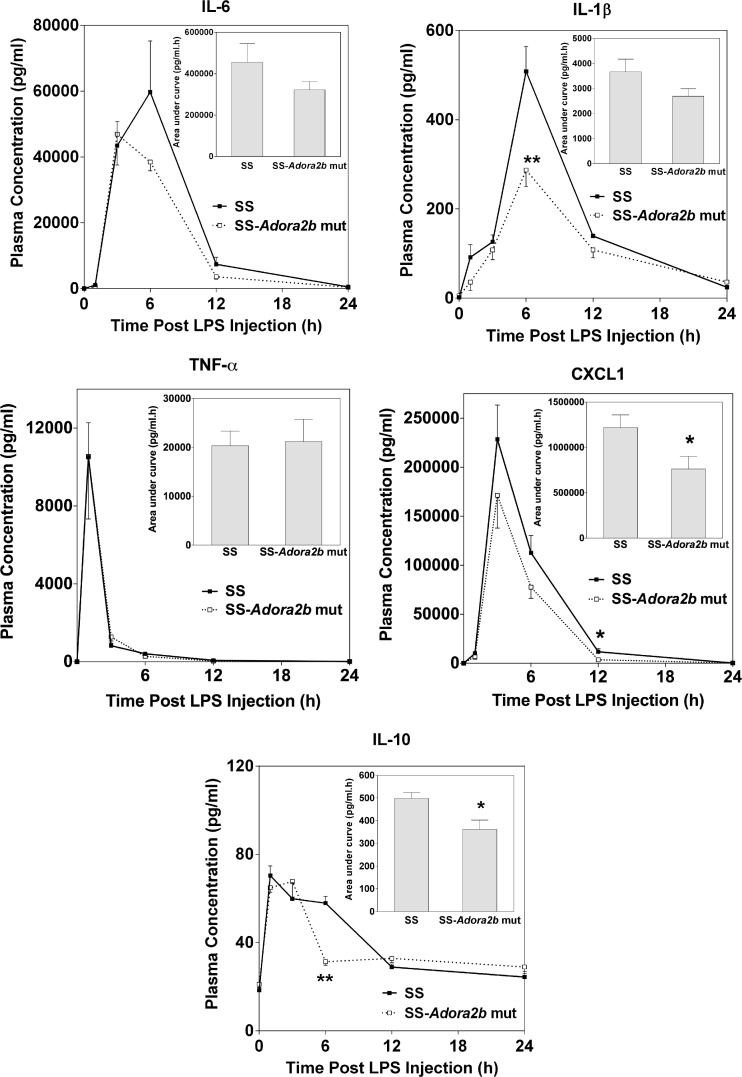
Exposure to lipopolysaccharide (LPS) results in augmented levels of tumor necrosis factor-α (TNF-α) and IL-6 in the plasma of Adora2b−/− mice compared to controls [8], suggesting that the A2BAR signals to suppress proinflammatory cytokine production in mice. This was examined in SS-Adora2b mutant rats. Figure 3 illustrates plasma concentrations of IL-1β, IL-6, IL-10, TNF-α, and CXCL1 at various times following i.p. injection of 5-mg/kg LPS (Escherichia coli serotype 0111:B4, Sigma-Aldrich) measured utilizing a multicytokine array assay. There were no differences in plasma concentrations of the cytokines at baseline prior to LPS administration, with the exception of a slight increase in IL-6 content in SS-Adora2b mutant rats (SS = 17 ± 2 pg/ml; SS-Adora2b mutant rats = 28 ± 3 pg/ml; p < 0.05). Upon challenge with LPS, however, the increases in IL-1β, IL-6, and CXCL1 in plasma were reduced in SS-Adora2b mutant rats, although there were no differences in the levels of TNF-α. The plasma concentration of the anti-inflammatory cytokine IL-10 was also reduced in SS-Adora2b mutant rats at the 6-h time point only. Although not shown, other cytokines included in the cytokine array including IL-4, IL-13, and IFN-γ were not different between the genotypes at baseline or following LPS administration. In all samples, the concentration of IL-5 was below the limits of detection. These findings indicate that, in contrast to B6 mice [8], the A2BAR facilitates LPS-induced proinflammatory cytokine production in SS rats.
Fig. 3.
Plasma concentration of proinflammatory cytokines following injection of LPS. SS control and SS-Adora2b mutant rats (12 weeks old) were injected i.p. with LPS (5 mg/kg) after which plasma was collected at the times indicated for the assessment of cytokine content using a multicytokine array assay. Data are means ± SEM. n = 6 male rats/group; *p < 0.05 or **p < 0.01 vs. SS controls using Student’s t test
SS-Adora2b mutant rats have accentuated hypertension and increased body weight
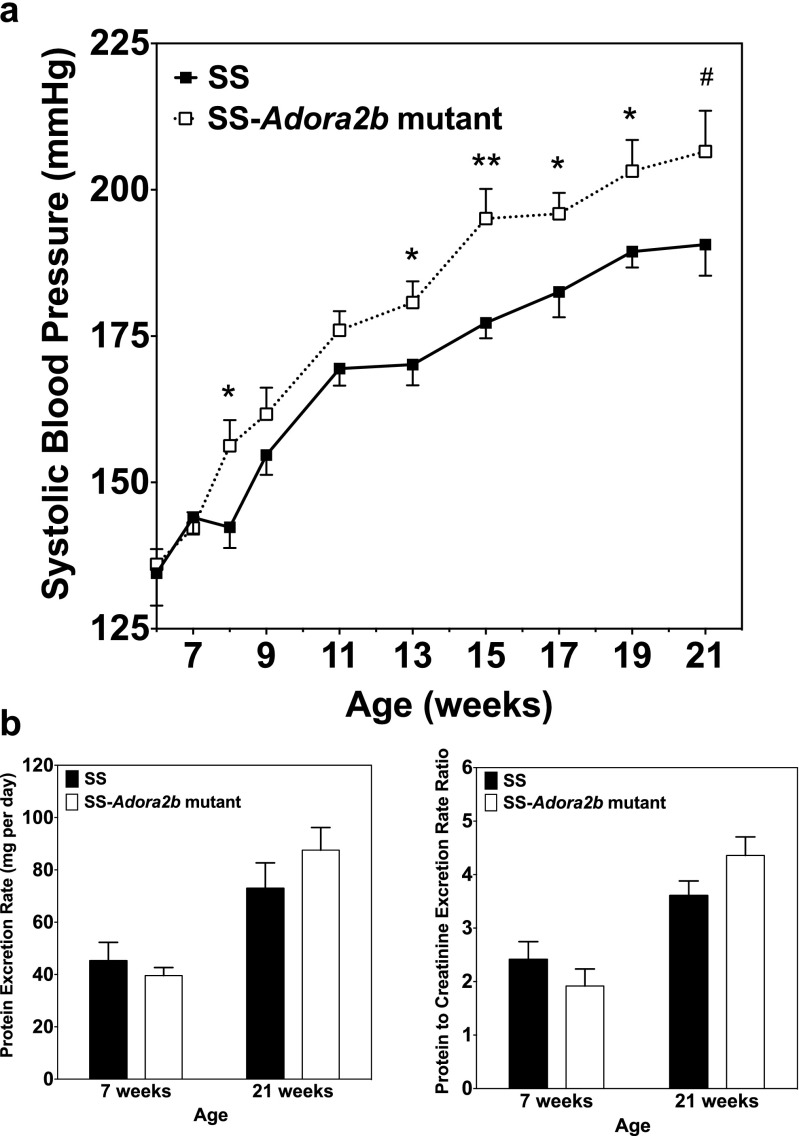
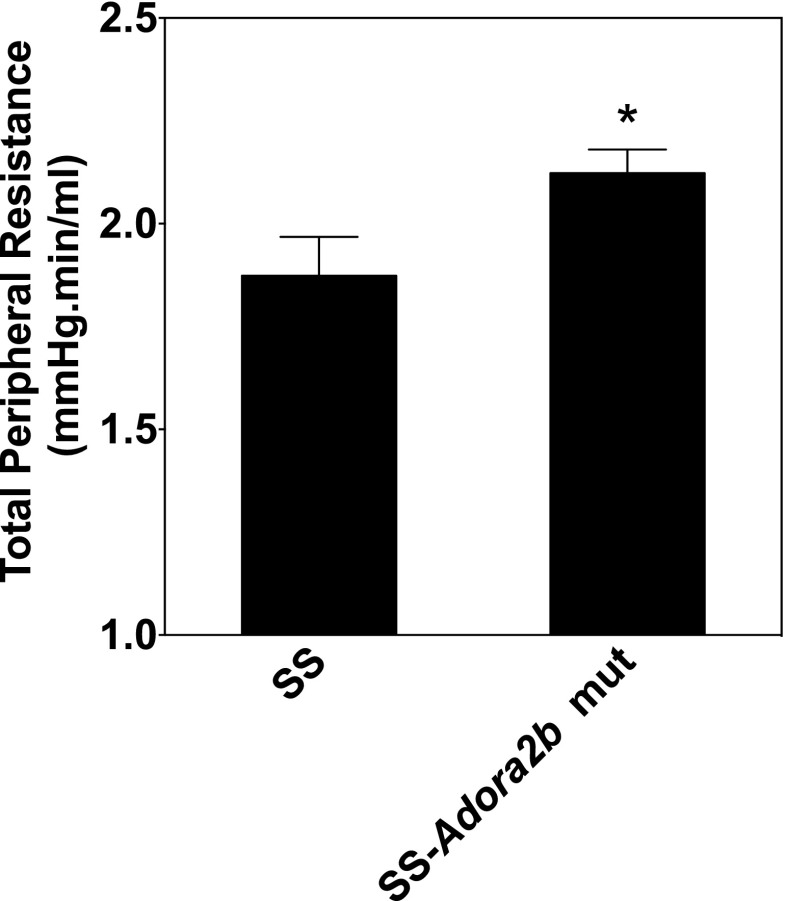
SS-Adora2b mutants were assessed to determine if genetic disruption of Adora2b influences the progression of hypertensive pathology in SS rats. Figure 4 shows the differences in blood pressure and the protein excretion rate between age-matched male SS and SS-Adora2b mutant rats maintained on chow with 0.12 % NaCl for 21 weeks. Table 1 reports echocardiographic assessment of cardiac structure and function from this experiment. We observed that systolic blood pressure was elevated significantly in SS-Adora2b mutants compared to SS controls, which became evident at 8 weeks of age with consistent differences of ∼15 mmHg at subsequent time points thereafter (Figure 4a). At 21 weeks of age, systolic blood pressure was 207 ± 7 mmHg in SS-Adora2b mutant rats versus 191 ± 5 mmHg in controls (p < 0.001). The protein excretion rate (Figure 4b) and echocardiographic measures of left ventricular structure and function obtained at 21 weeks of age (Table 1) were similar between the genotypes, with the exception of modestly increased posterior wall thickness in SS-Adora2b mutants that likely occurred because systemic blood pressure was increased to a greater extent. As shown in Fig. 5, total peripheral resistance calculated as systolic blood pressure divided by cardiac output obtained from the echocardiographic measurements was increased in SS-Adora2b mutant rats at 21 weeks of age. These data indicate that genetic disruption of Adora2b significantly accentuates hypertension in SS rats during low-salt feeding.
Fig. 4.
Systolic blood pressure and urinary protein excretion data from SS control and SS-Adora2b mutant rats maintained on a low-salt diet. a Systolic blood pressure assessed every 2 weeks using tail-cuff plethysmography. b Protein excretion rate and protein excretion rate to creatinine excretion rate ratio determined from 24-h urine collections at 7 and 21 weeks of age. Data are means ± SEM. n = 8–14 male rats/group; *p < 0.05, **p < 0.01 vs. SS control rats using Student’s t test
Table 1.
Echocardiographic data of 21-week-old SS-Adora2b mutant rats fed a low-salt diet
| SS control | SS-Adora2b mutant | |
|---|---|---|
| AW thickness (d), mm | 2.05 ± 0.09 | 2.02 ± 0.11 |
| PW thickness (d), mm | 1.80 ± 0.10 | 2.14 ± 0.09* |
| ID (d), mm | 7.80 ± 0.14 | 7.68 ± 0.12 |
| FS, % | 51.0 ± 1.2 | 54.3 ± 1.4 |
| Heart rate, bpm | 383 ± 6 | 391 ± 10 |
| SV, μl | 262 ± 10 | 263 ± 8 |
| CO, ml/min | 101 ± 4 | 101 ± 2 |
Data are presented as means ± SEM (n = 10–13 male rats/group)
d diastole, AW anterior wall, PW posterior wall, ID internal diameter, FS fractional shortening, bpm beats per minute, SV stroke volume, CO cardiac output
*p < 0.05 vs. SS controls by Student’s t test
Fig. 5.
Total peripheral resistance data from SS control and SS-Adora2b mutant rats maintained on a low-salt diet. Total peripheral vascular resistance, estimated as systolic blood pressure/cardiac output (determined from echocardiographic measurements), at 21 weeks of age. Data are means ± SEM (n = 7–8 male rats/group). *p < 0.05 vs. SS control rats using Student’s t test
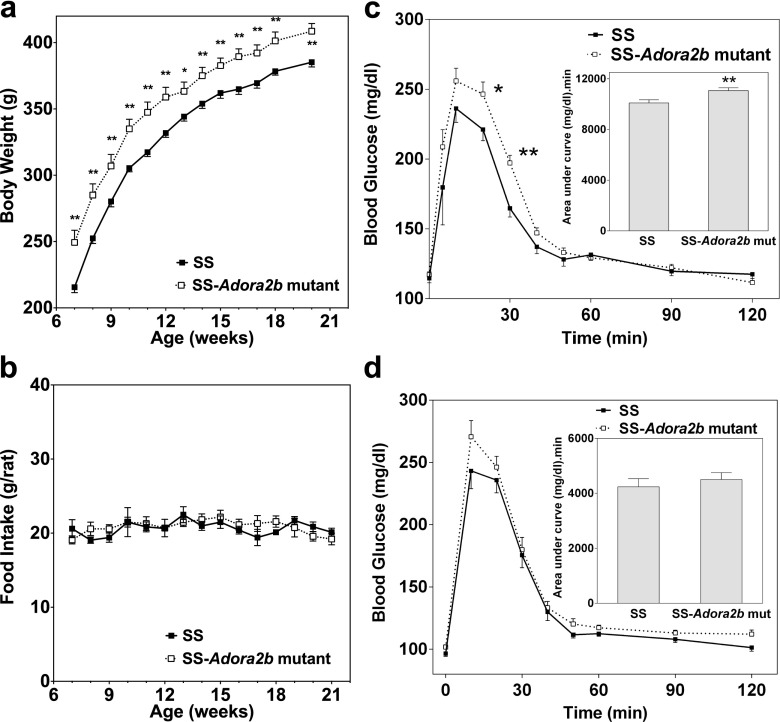
Body weight data was collected during this experiment, and it was consistently observed that the SS-Adora2b mutant rats were ∼20 g heavier than SS control rats throughout the observation period despite equivalent food intake (Fig. 6a, b). Based on this observation and previous reports in mice that implicate the A2BAR in glucose homeostasis, we conducted glucose tolerance tests on the SS-Adora2b mutant rats consisting of i.p. administration of 2 g/kg of glucose to fasted (6 h) animals. As shown in Fig. 6c, d, clearance of glucose was delayed significantly in young (10–12 weeks) SS-Adora2b mutant rats compared to SS controls; however, this difference faded as the animals aged to 20–24 weeks. Fasting glucose was not significantly different between the genotypes at either of the time points that were measured (SS-Adora2b mutant rats = 117 ± 2 mg/dl and SS rats = 114 ± 3 mg/dl at 12 weeks of age; SS-Adora2b mutant rats = 102 ± 2 mg/dl and SS rats = 96 ± 2 mg/dl at 20–24 weeks of age).
Fig. 6.
Body weight, food consumption, and glucose clearance of SS control and SS-Adora2b mutant rats maintained on a low-salt diet. a Body weight and b food consumption. c, d Glucose clearance determined from fasted rats (6 h) using a standard glucose tolerance test (i.p. administration of 2 g/kg sterile glucose), as described in the “Methods” section. These studies were conducted with rats aged 9–12 (c) or 20–24 (d) weeks. (Insets) Area-under-the-curve calculations. Data are means ± SEM. n = 11–13 male rats/group; *p < 0.05 and **p < 0.01 vs. SS control rats using Student t tests
Ang II-induced hypertension is attenuated in SS-Adora2b mutant rats
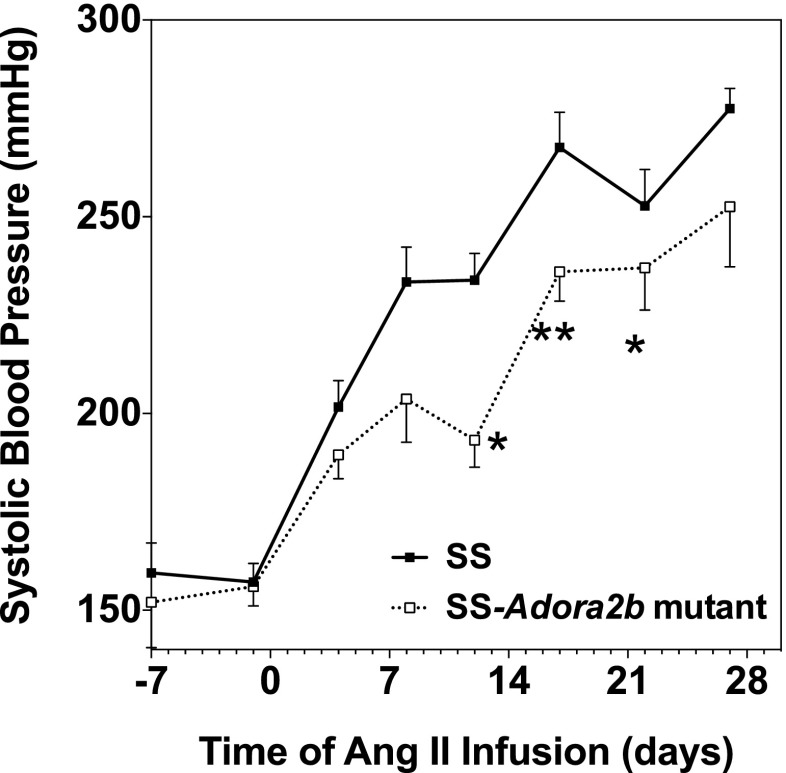
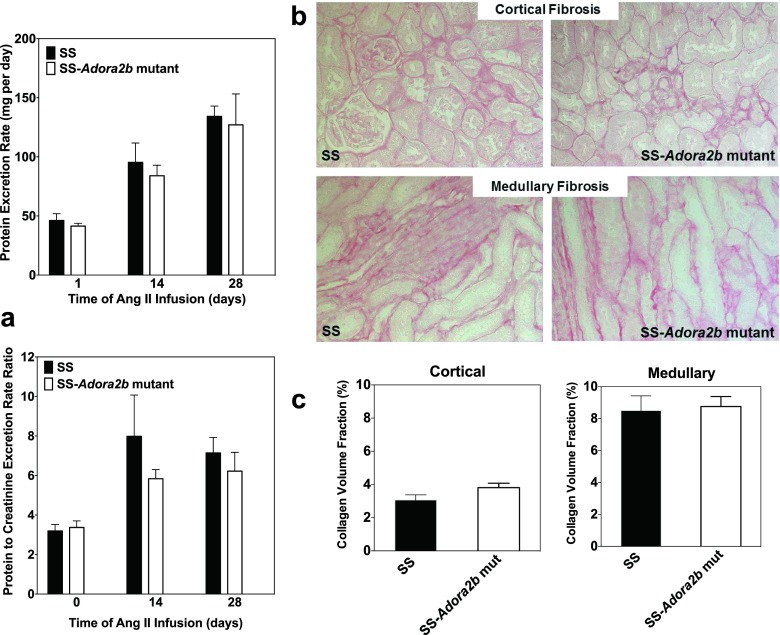
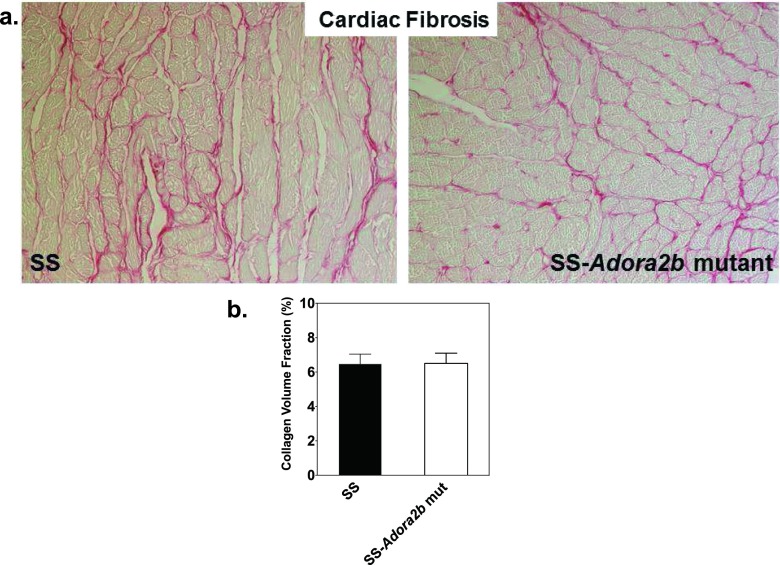
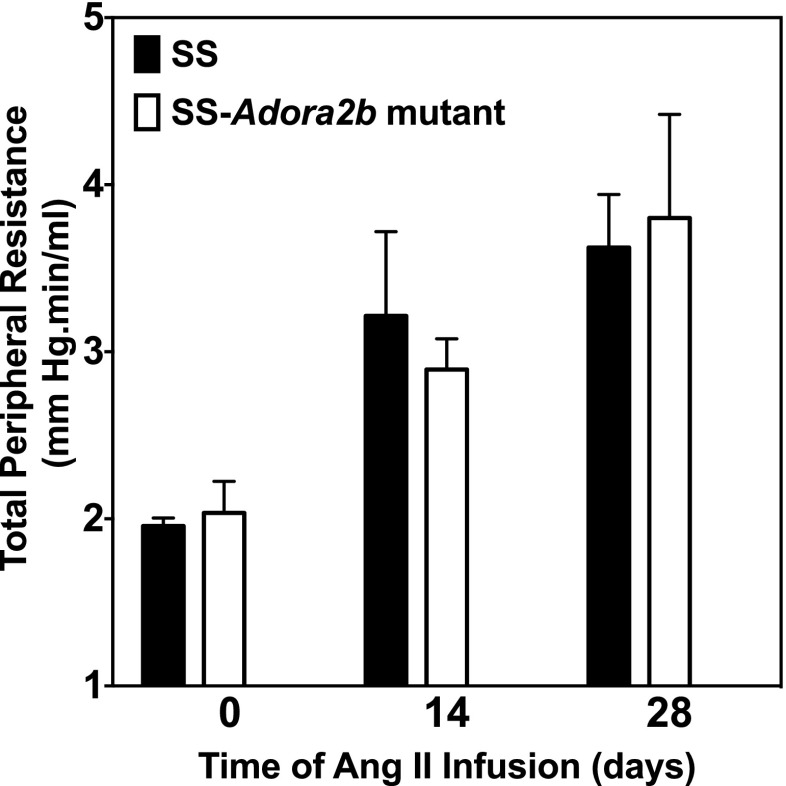
We next examined whether genetic disruption of Adora2b in SS rats influences the progression of hypertensive pathology during systemic infusion of Ang II via subcutaneous implantation of osmotic minipumps. The experiment was begun with rats aged 7–8 weeks when blood pressure is similar between the genotypes. Figures 7 and 8a show blood pressure and the protein excretion rate of age-matched male SS and SS-Adora2b mutant rats during infusion of 200 ng/kg/min of Ang II for 4 weeks. This dose of Ang II was identified in preliminary studies to increase systolic blood pressure in SS rats ∼100 mmHg above control levels. We observed that SS-Adora2b mutant rats had a significant attenuation of blood pressure compared to SS control rats (Figure 7) but no difference in the protein excretion rate (Figure 8a). After 2 weeks of Ang II infusion, systolic blood pressure was increased to 234 ± 7 mmHg in SS control rats, whereas it only increased to 193 ± 7 mmHg in SS-Adora2b mutant rats. The rate of weight change was not different in SS-Adora2b mutant rats (not shown), indicating that Ang II was administered at an equivalent dose throughout the experiment. To further assess renal injury, the extent of fibrosis was measured from picrosirius red-stained sections, but no differences were detected between the genotypes in either the cortical or medullary regions (Fig. 8b, c). There were also no differences in echocardiographic assessment of cardiac structure/function (Table 2), organ weights (Table 3), the extent of cardiac fibrosis (Fig. 9a, b), and total peripheral resistance (Fig. 10). Note that two out of eight rats from the SS control group died 3 ½ weeks after initiation of Ang II infusion likely due to complications of stroke, whereas all of the SS-Adora2b mutant rats survived the entire 28-day study. Collectively, these data indicate that genetic disruption of Adora2b significantly attenuates Ang II-accelerated hypertension in SS rats, but does not substantially influence renal or cardiac pathology.
Fig. 7.
Systolic blood pressure data of SS control and SS-Adora2b mutant rats from the Ang II infusion study. The rats were infused with Ang II at a dose of 200 ng/kg/min for 4 weeks via subcutaneous implantation of osmotic minipumps. Systolic blood pressure was assessed every ∼3–4 days by the tail-cuff method. Data are means ± SEM. n = 8 male rats/group; *p < 0.05 and **p < 0.01 vs. SS control rats using Student’s t test
Fig. 8.
Proteinuria and renal fibrosis data of SS control and SS-Adora2b mutant rats from the Ang II infusion study. The rats were infused with Ang II at a dose of 200 ng/kg/min for 4 weeks via subcutaneous implantation of osmotic minipumps. a Protein excretion rate and protein excretion rate to creatinine excretion rate ratio determined from 24-h urine collections at baseline (0) and then at 2 and 4 weeks after implantation of osmotic minipumps. b, c Renal fibrosis data. Kidneys were removed at the end of the study, and tissue sections were subjected to picrosirius red staining to evaluate the extent of interstitial fibrosis in cortical and medullary regions. Fibrosis was determined from fluorescent images. b Representative bright-field images and c collagen volume fraction data that was calculated using Image J software. Data are means ± SEM. n = 6–8 male rats/group
Table 2.
Echocardiographic data of SS-Adora2b mutant rats during the Ang II infusion study
| SS control (n = 5) | SS-Adora2b mutant (n = 7) | |
|---|---|---|
| AW thickness (d), mm | ||
| Baseline | 1.63 ± 0.08 | 1.55 ± 0.10 |
| Week 2 | 2.19 ± 0.21* | 1.91 ± 0.07* |
| Week 4 | 2.13 ± 0.09* | 1.97 ± 0.12* |
| PW thickness (d), mm | ||
| Baseline | 1.74 ± 0.08 | 1.72 ± 0.10 |
| Week 2 | 2.17 ± 0.11* | 2.33 ± 0.08* |
| Week 4 | 1.94 ± 0.18 | 2.11 ± 0.18 |
| ID (d), mm | ||
| Baseline | 6.99 ± 0.16 | 7.12 ± 0.22 |
| Week 2 | 6.63 ± 0.37 | 6.73 ± 0.18 |
| Week 4 | 7.15 ± 0.34 | 7.06 ± 0.22 |
| FS, % | ||
| Baseline | 48.0 ± 1.2 | 49.0 ± 2.3 |
| Week 2 | 57.2 ± 2.7* | 51.2 ± 3.3 |
| Week 4 | 51.9 ± 3.7 | 48.2 ± 3.5 |
| Heart rate, bpm | ||
| Baseline | 384 ± 6 | 347 ± 15 |
| Week 2 | 394 ± 6 | 360 ± 14 |
| Week 4 | 358 ± 17 | 351 ± 14 |
| SV, μl | ||
| Baseline | 200 ± 8 | 209 ± 12 |
| Week 2 | 200 ± 26 | 191 ± 11 |
| Week 4 | 219 ± 23 | 203 ± 17 |
| CO, ml/min | ||
| Baseline | 77 ± 4 | 75 ± 5 |
| Week 2 | 78 ± 10 | 68 ± 5 |
| Week 4 | 77 ± 6 | 71 ± 7 |
Data are expressed as means ± SEM (n = 5–7 male rats/group)
d diastole, AW anterior wall, PW posterior wall, ID internal diameter, FS fractional shortening, SV stroke volume, CO cardiac output
*p < 0.05 vs. baseline using two-way repeated measures ANOVA with Tukey’s multiple comparisons post hoc contrast
Table 3.
Organ weight data of SS-Adora2b mutant rats from the Ang II infusion study
| SS control (n = 6) | SS-Adora2b mutant (n = 8) | |
|---|---|---|
| LV weight/TL, g/cm | 0.19 ± 0.01 | 0.18 ± 0.01 |
| LK weight/TL, g/cm | 0.28 ± 0.01 | 0.27 ± 0.01 |
| L weight/TL, g/cm | 0.28 ± 0.01 | 0.28 ± 0.01 |
| TL, mm | 3.96 ± 0.03 | 3.95 ± 0.02 |
Data are expressed as means ± SEM (n = 6–8 male rats/group)
LV left ventricle, LK left kidney, L lung, TL tibia length
Fig. 9.
Cardiac fibrosis of SS control and SS-Adora2b mutant rats from the Ang II infusion study. Hearts were removed at the end of the study and tissue sections were subjected to picrosirius red staining. Fibrosis was determined from fluorescent images. Shown are bright-field images (a) and the collagen volume fraction (b) that was calculated using Image J software. Data are means ± SEM. n = 6–8 male rats/group
Fig. 10.
Total peripheral resistance of control SS and SS-Adora2b mutant rats from the Ang II infusion study. Total peripheral resistance was calculated as systolic blood pressure/cardiac output obtained (from echocardiographic measurements). Data are means ± SEM. n = 6–8 male rats/group
Discussion
This study presents the initial characterization of a novel line of SS rats with targeted disruption of Adora2b, officially designated SS-Adora2bem2Mcwi. The 162-bp in-frame deletion in the SS-Adora2b mutant rats results in loss of A2BAR signaling likely due to expression of a truncated, nonfunctional form of the receptor. Utilizing this novel genetic tool, the main finding of this study is that disruption of Adora2b in SS rats augments hypertension with maturation, yet it attenuates Ang II-accelerated hypertension. In both instances, the extent of renal and cardiac pathology in SS-Adora2b mutant rats was similar to control rats. These data reveal a variable role for adenosine and A2BAR signaling in regulating blood pressure in SS rats, playing both pro- and antihypertensive actions depending on the underlying pathogenic mechanisms that drive blood pressure elevation. Disruption of Adora2b in SS-Adora2b mutant rats also increased body weight, impaired glucose homeostasis, and suppressed responsiveness to inflammatory stress.
Hypertension was accentuated in SS-Adora2b mutant rats as they matured to adulthood during low-salt feeding (Fig. 4), implicating that A2BAR signaling exerts a blood pressure-lowering effect in SS rats under these conditions. A2BARs are expressed in most vascular beds where they mediate dilator responses [27–29]. We therefore speculate that blood pressure was elevated in SS-Adora2b mutant rats due to increased peripheral vascular resistance. In support of this idea, total peripheral resistance estimated as systolic blood pressure/cardiac output (from echocardiographic measurements) was increased in SS-Adora2b mutant rats at 21 weeks of age compared to controls (Fig. 5). However, renal mechanisms may contribute as well, since high levels of A2BAR expression have been noted in various regions of the nephron [30], and recent studies have implicated the A2BAR in regulating renal hemodynamics and sodium transport. For example, A2BAR activation has been shown to promote chloride secretion from inner medullary collecting duct cells [31] and to dilate renal afferent arterioles [27], both of which could lead to increased sodium excretion. Finally, increased body weight with normal food intake suggests increased visceral adiposity in SS-Adora2b mutant rats. This could lead to physical compression of the kidneys and increased activation of the sympathetic nervous and renin-angiotensin systems [32]. Blood pressure is normal in Adora2b−/− mice maintained on the B6 genetic background [8]. Thus, accentuated hypertension observed in SS-Adora2b mutant rats might depend on abnormalities in blood pressure regulation within the SS rat strain.
In contrast, hypertension was augmented in SS-Adora2b mutant rats during Ang II infusion (Fig. 7), suggesting that A2BAR signaling propagates hypertension driven by the renin-angiotensin system in SS rats. This observation is consistent with previous reports utilizing Adora2b−/− mice [18]. One possibility is that A2BAR disruption enhances catecholamine release in response to Ang II infusion. In addition, current evidence indicates that cells of the immune system contribute to hypertension in response to Ang II infusion [33]. Macrophages and specific T cell subsets accumulate within both the kidneys and the vasculature that contribute to blood pressure elevation by producing cytokines including TNF-α, IL-6, IL-17, and likely others that promote vasoconstriction, reactive oxygen species production, and sodium reabsorption in the kidneys [33]. Based on our observation that cytokine production was suppressed in SS-Adora2b mutants following inflammatory challenge with LPS (Fig. 3) and on the observation that A2BAR activation in SS rats stimulates the production of IL-6 (Fig. 2), it is conceivable that A2BAR activation during Ang II infusion may perpetuate a proinflammatory state within the kidneys and/or the vasculature thereby contributing to blood pressure elevation. It is important to note that the interstitial concentration of adenosine is increased markedly in the kidneys during Ang II infusion, potentially as a result of local ischemia due to vasoconstriction or direct activation of HIF signaling that controls key enzymes involved in adenosine production including the ecto-nucleotidase CD73 [18, 34].
We were surprised to observe that renal and cardiac pathologies were not attenuated in SS-Adora2b mutant rats in the Ang II infusion studies (Figs. 8 and 9). This was unexpected since Ang II-induced renal injury is attenuated in Adora2b−/− mice [18, 21] and because we and others recently observed a sustained reduction in fibrosis in Adora2b−/− mice following myocardial infarction implicating A2BAR signaling in regulating cardiac remodeling responses [35–38]. These discrepant findings raise the possibility that participation of A2BAR signaling in hypertension-induced end-organ injury differs between SS rats and B6 mice. In stark contrast to our findings with SS-Adora2b mutant rats, exposure to LPS by a protocol similar to that used in the present investigation in SS rats dramatically augments plasma levels of proinflammatory cytokines including TNF-α and IL-6 in (B6) Adora2b−/− mice as much as 5-fold [8], suggesting a stimulatory (rather than an inhibitory) effect of A2BAR signaling on Toll-like receptor-mediated cytokine production in B6 mice. Thus, control of inflammatory responses by the A2BAR also likely differs between SS rats and B6 mice. It is unclear at the present time whether these findings represent generalized species differences (i.e., rats vs. mice) or differences in A2BAR signaling during hypertension pathology in SS rats. To address this issue, we are transferring the Adora2b mutation to create outbred mutant rat strains to be assessed in future studies.
We did not investigate the underlying basis for increased body weight in SS-Adora2b mutant rats or altered glucose clearance. However, genetic disruption of Adora2b in B6 mice also results in increased weight gain, which was explained by increased adiposity correlated with reduced physical activity [39]. Adora2b−/− mice also display impairments in glucose and lipid metabolism, including delayed glucose clearance, reduced insulin sensitivity, hepatic hypertriglyceridemia, and impaired cholesterol metabolism resulting in increased total cholesterol, HDL, and LDL/VLDL content in plasma [39]. Some of these and other metabolic disturbances are augmented during high-fat feeding [40, 41]. These findings with Adora2b−/− mice, which we have partially corroborated in our preliminary studies with SS-Adora2b mutant rats, support the concept that A2BAR signaling is protective against obesity and have raised interest in the participation of adenosine signaling during metabolic diseases [11]. Further mechanistic studies with Adora2b−/− mice suggest that A2BAR signaling is protective by maintaining alternative macrophage activation and suppressing macrophage-dependent tissue inflammation [39, 40]. While these results suggest a positive role, Figler and colleagues [42] have provided evidence that A2BAR signaling may have a negative impact during the pathogenesis of diabetes. These investigators observed that blockade of A2BARs increases glucose clearance and insulin sensitivity in the genetically obese KK-Ay mouse model of type 2 diabetes [42]. Diabetes in these mice increased the expression of the A2BAR in both endothelial cells and macrophages and resulted in enhanced IL-6 secretion [42]. Thus, the contribution of adenosine and A2BAR signaling during metabolic disorders is likely to be complex and will require further investigation in additional model systems. Along with salt-sensitive hypertension, SS rats exhibit insulin resistance and hyperlipidemia [43, 44]. The newly created SS-Adora2b mutant rat line described in this study may be a particularly valuable model to investigate the importance of A2BAR signaling in the setting of metabolic syndrome.
In summary, this study describes the successful creation and validation of an Adora2b-disrupted rat line for study of A2BAR function in a genetic model of cardiovascular disease. Unlike the case in B6 mice, A2BAR disruption failed to influence cardiac or renal injury/fibrosis in response to hypertension, suggesting strain or species differences in profibrotic AR signaling, or differences in responsiveness to profibrotic factors such as IL-6 that are released following A2BAR activation. Our results indicate an important role for A2BAR signaling in regulating blood pressure during experimental hypertension, with a particularly prominent prohypertensive action during blood pressure elevation driven by Ang II. Our results also confirm associations between A2BAR signaling, inflammatory processes, and metabolic disorders.
Acknowledgments
This study was supported by grants from the National Institutes of Health (HL077707, HL111392, and RC2 HL101681).
References
- 1.Feoktistov I, Biaggioni I. Adenosine A2B receptors. Pharmacol Rev. 1997;49(4):381–402. [PubMed] [Google Scholar]
- 2.Kong T, Westerman KA, Faigle M, Eltzschig HK, Colgan SP. HIF-dependent induction of adenosine A2B receptor in hypoxia. FASEB J. 2006;20:2242–2250. doi: 10.1096/fj.06-6419com. [DOI] [PubMed] [Google Scholar]
- 3.Aherne CM, Kewley EM, Eltzschig HK. The resurgence of A2B adenosine receptor signaling. Biochim Biophys Acta. 2011;1808:1329–1339. doi: 10.1016/j.bbamem.2010.05.016. [DOI] [PMC free article] [PubMed] [Google Scholar]
- 4.Haskó G, Csóka B, Németh ZH, Vizi ES, Pacher P. A2B adenosine receptors in immunity and inflammation. Trends Immunol. 2009;30:263–270. doi: 10.1016/j.it.2009.04.001. [DOI] [PMC free article] [PubMed] [Google Scholar]
- 5.Kreckler LM, Wan TC, Ge ZD, Auchampach JA. Adenosine inhibits tumor necrosis factor-a release from mouse peritoneal macrophages via A2A and A2B but not the A3 adenosine receptor. J Pharmacol Exp Ther. 2006;317(1):172–180. doi: 10.1124/jpet.105.096016. [DOI] [PubMed] [Google Scholar]
- 6.Liu R, Groenewoud NJ, Peeters MC, Lenselink EB, IJzerman AP. A yeast screening method to decipher the interaction between the adenosine A2B receptor and the C-terminus of different G protein alpha-subunits. Purinergic Signal. 2014;10(3):441–453. doi: 10.1007/s11302-014-9407-6. [DOI] [PMC free article] [PubMed] [Google Scholar]
- 7.Auchampach JA, Kreckler LM, Wan TC, Maas JE, van der Hoeven D, Gizewski E, Narayanan J, Maas GE. Characterization of the A2B adenosine receptor from mouse, rabbit, and dog. J Pharmacol Exp Ther. 2009;329(1):2–13. doi: 10.1124/jpet.108.148270. [DOI] [PMC free article] [PubMed] [Google Scholar]
- 8.Yang D, Zhang Y, Nguyen HG, Koupenova M, Chauhan AK, Makitalo M, Jones MR, Hilaire CS, Seldin DC, Toselli P, Lamperti E, Schreiber BM, Gavras H, Wagner DD, Ravid K. The A2B adenosine receptor protects against inflammation and excessive vascular adhesion. J Clin Investig. 2006;116:1913–1923. doi: 10.1172/JCI27933. [DOI] [PMC free article] [PubMed] [Google Scholar]
- 9.van der Hoeven D, Wan TC, Gizewski ET, Kreckler LM, Maas JE, Van Orman J, Ravid K, Auchampach JA. A role for the low-affinity A2B adenosine receptor in regulating superoxide generation by murine neutrophils. J Pharmacol Exp Ther. 2011;338:1004–1012. doi: 10.1124/jpet.111.181792. [DOI] [PMC free article] [PubMed] [Google Scholar]
- 10.Moriyama K, Sitkovsky MV. Adenosine A2A receptor is involved in cell surface expression of A2B receptor. J Biol Chem. 2010;285(50):39271–39288. doi: 10.1074/jbc.M109.098293. [DOI] [PMC free article] [PubMed] [Google Scholar]
- 11.Antonioli L, Blandizzi C, Csóka B, Pacher P, Haskó G. Adenosine signalling in diabetes mellitus—pathophysiology and therapeutic considerations. Nat Rev Endocrinol. 2015;11:228–241. doi: 10.1038/nrendo.2015.10. [DOI] [PubMed] [Google Scholar]
- 12.Johnston-Cox HA, Koupenova M, Ravid K. A2 adenosine receptors and vascular pathologies. Arterioscler Thromb Vasc Biol. 2012;32:870–878. doi: 10.1161/ATVBAHA.112.246181. [DOI] [PMC free article] [PubMed] [Google Scholar]
- 13.Idzko M, Ferrari D, Eltzschig HK. Nucleotide signalling during inflammation. Nature. 2014;509(7500):310–317. doi: 10.1038/nature13085. [DOI] [PMC free article] [PubMed] [Google Scholar]
- 14.Vohwinkel CU, Hoegl S, Eltzschig HK (2015) Hypoxia signaling during acute lung injury. J Appl Physiol (1985):jap 00226 02015. doi:10.1152/japplphysiol.00226.2015 [DOI] [PMC free article] [PubMed]
- 15.Aherne CM, Saeedi B, Collins CB, Masterson JC, McNamee EN, Perrenoud L, Rapp CR, Curtis VF, Bayless A, Fletcher A, Glover LE, Evans CM, Jedlicka P, Furuta GT, de Zoeten EF, Colgan SP, Eltzschig HK. Epithelial-specific A2B adenosine receptor signaling protects the colonic epithelial barrier during acute colitis. Mucosal Immunol. 2015 doi: 10.1038/mi.2015.22. [DOI] [PMC free article] [PubMed] [Google Scholar]
- 16.Cronstein BN. Adenosine receptors and fibrosis: a translational review. F1000 Biol Rep. 2011;3:1–6. doi: 10.3410/B3-21. [DOI] [PMC free article] [PubMed] [Google Scholar]
- 17.Karmouty-Quintana H, Xia Y, Blackburn MR. Adenosine signaling during acute and chronic disease states. J Mol Med. 2013;91:173–181. doi: 10.1007/s00109-013-0997-1. [DOI] [PMC free article] [PubMed] [Google Scholar]
- 18.Zhang W, Zhang Y, Wang W, Dai Y, Ning C, Luo R, Sun K, Glover L, Grenz A, Sun H, Tao L, Zhang W, Colgan SP, Blackburn MR, Eltzschig HK, Kellems RE, Xia Y. Elevated ecto-5′-nucleotidase-mediated increased renal adenosine signaling via A2B adenosine receptor contributes to chronic hypertension. Circ Res. 2013;112:1466–1478. doi: 10.1161/CIRCRESAHA.111.300166. [DOI] [PMC free article] [PubMed] [Google Scholar]
- 19.Sun C-X, Zhong H, Mohsenin A, Morschl E, Chunn JL, Molina JG, Belardinelli L, Zeng D, Blackburn MR. Role of A2B adenosine receptor signaling in adenosine-dependent pulmonary inflammation and injury. J Clin Invest. 2006;116:2173–2182. doi: 10.1172/JCI27303. [DOI] [PMC free article] [PubMed] [Google Scholar]
- 20.Peng Z, Borea PA, Varani K, Wilder T, Yee H, Chiriboga L, Blackburn MR, Azzena G, Resta G, Cronstein BN. Adenosine signaling contributes to ethanol-induced fatty liver in mice. J Clin Invest. 2009;119:582–594. doi: 10.1172/JCI37409. [DOI] [PMC free article] [PubMed] [Google Scholar]
- 21.Dai Y, Zhang W, Wen J, Zhang Y, Kellems RE, Xia Y. A2B adenosine receptor-mediated induction of IL-6 promotes CKD. J Am Soc Nephrol. 2011;22:890–901. doi: 10.1681/ASN.2010080890. [DOI] [PMC free article] [PubMed] [Google Scholar]
- 22.Wen J, Jiang X, Dai Y, Zhang Y, Tang Y, Sun H, Mi T, Phatarpekar PV, Kellems RE, Blackburn MR, Xia Y. Increased adenosine contributes to penile fibrosis, a dangerous feature of priapism, via A2B adenosine receptor signaling. FASEB J. 2010;24:740–749. doi: 10.1096/fj.09-144147. [DOI] [PMC free article] [PubMed] [Google Scholar]
- 23.Geurts AM, Cost GJ, Freyvert Y, Zeitler B, Miller JC, Choi VM, Jenkins SS, Wood A, Cui X, Meng X, Vincent A, Lam S, Michalkiewicz M, Schilling R, Foeckler J, Kalloway S, Weiler H, Ménoret S, Anegon I, Davis GD, Zhang L, Rebar EJ, Gregory PD, Urnov FD, Jacob HJ, Buelow R. Knockout rats via embryo microinjection of zinc-finger nucleases. Science. 2009;325:433. doi: 10.1126/science.1172447. [DOI] [PMC free article] [PubMed] [Google Scholar]
- 24.Geurts AM, Cost GJ, Rémy S, Cui X, Tesson L, Usal C, Ménoret S, Jacob HJ, Anegon I, Buelow R. Generation of gene-specific mutated rats using zinc-finger nucleases. Methods Mol Biol. 2010;597:211–225. doi: 10.1007/978-1-60327-389-3_15. [DOI] [PubMed] [Google Scholar]
- 25.Rapp JP, Dene H. Development and characteristics of inbred strains of Dahl salt-sensitive and salt-resistant rats. Hypertension. 1985;7:340–349. [PubMed] [Google Scholar]
- 26.Takashima A (1998) Establishment of fibroblast cultures. Curr Protoc Cell Biol Chapter 2: Unit 2.1.1–2.2.12. doi:10.1002/0471143030.cb0201s00 [DOI] [PubMed]
- 27.Feng M-G, Navar LG. Afferent arteriolar vasodilator effect of adenosine predominantly involves adenosine A2B receptor activation. Am J Physiol Ren Physiol. 2010;299:F310–F315. doi: 10.1152/ajprenal.00149.2010. [DOI] [PMC free article] [PubMed] [Google Scholar]
- 28.Rubino A, Ralevic V, Burnstock G. Contribution of P1-(A2b subtype) and P2-purinoceptors to the control of vascular tone in the rat isolated mesenteric arterial bed. Br J Pharmacol. 1995;115(4):648–652. doi: 10.1111/j.1476-5381.1995.tb14981.x. [DOI] [PMC free article] [PubMed] [Google Scholar]
- 29.Sanjani MS, Teng B, Krahn T, Tilley S, Ledent C, Mustafa SJ. Contributions of A2A and A2B adenosine receptors in coronary flow responses in relation to the KATP channel using A2B and A2A/2B double-knockout mice. Am J Physiol Heart Circ Physiol. 2011;301(6):H2322–H2333. doi: 10.1152/ajpheart.00052.2011. [DOI] [PMC free article] [PubMed] [Google Scholar]
- 30.Vitzthum H, Weiss B, Bachleitner W, Krämer BK, Kurtz A. Gene expression of adenosine receptors along the nephron. Kidney Int. 2004;65:1180–1190. doi: 10.1111/j.1523-1755.2004.00490.x. [DOI] [PubMed] [Google Scholar]
- 31.Rajagopal M, Pao AC. Adenosine activates A2B receptors and enhances chloride secretion in kidney inner medullary collecting duct cells. Hypertension. 2010;27:1123–1128. doi: 10.1161/HYPERTENSIONAHA.109.143404. [DOI] [PMC free article] [PubMed] [Google Scholar]
- 32.Hall JE, do Carmo JM, da Silva AA, Wang Z, Hall ME. Obesity-induced hypertension: interaction of neurohumoral and renal mechanisms. Circ Res. 2015;116:991–1006. doi: 10.1161/CIRCRESAHA.116.305697. [DOI] [PMC free article] [PubMed] [Google Scholar]
- 33.McMaster WG, Kirabo A, Madhur MS, Harrison DG. Inflammation, immunity, and hypertensive end-organ damage. Circ Res. 2015;116(6):1022–1033. doi: 10.1161/CIRCRESAHA.116.303697. [DOI] [PMC free article] [PubMed] [Google Scholar]
- 34.Franco M, Bautista R, Pérez-Méndez O, González L, Pacheco U, Sánchez-Lozada LG, Santamaría J, Tapia E, Monreal R, Martínez F. Renal interstitial adenosine is increased in angiotensin II-induced hypertensive rats. Am J Physiol Ren Physiol. 2008;294:F84–F92. doi: 10.1152/ajprenal.00123.2007. [DOI] [PubMed] [Google Scholar]
- 35.Maas JE, Figler RA, Auchampach JA. Inhibition of the A2B adenosine receptor (AR) with ATL-801 reduced infarction-induced reactive fibrosis and cardiac dysfunction in mice. Circulation. 2009;120:S717–S718. doi: 10.1161/CIRCULATIONAHA.109.192598. [DOI] [Google Scholar]
- 36.Maas JE, Koupenova M, Ravid K, Auchampach JA. The A2B adenosine receptor contributes to post-infarction heart failure. Circulation. 2008;118:S956. [Google Scholar]
- 37.Toldo S, Mezzaroma E, Tassell BV, Kannan H, Zhong H, Zeng D, Belardinelli L, Voelkel N, Abbate A. Selective blockade of A2B adenosine receptor reduces cardiac remodeling following acute myocardial infarction in the mouse. J Am Coll Cardiol. 2012;59:E997. doi: 10.1016/S0735-1097(12)60998-X. [DOI] [PMC free article] [PubMed] [Google Scholar]
- 38.Zhang H, Zhong H, Everett TH, Wilson E, Chang R, Zeng D, Belardinelli L, Olgin JE. Blockade of A2B adenosine receptor reduces left ventricular dysfunction and ventricular arrhythmias 1 week after myocardial infarction in the rat model. Heart Rhythm. 2014;11:101–109. doi: 10.1016/j.hrthm.2013.10.023. [DOI] [PubMed] [Google Scholar]
- 39.Csoka B, Koscsó B, Töro G, Kókai E, Virág L, Németh ZH, Pacher P, Bai P, Haskó G. A2B adenosine receptors prevent insulin resistance by inhibiting adipose tissue inflammation via maintaining alternative macrophage activation. Diabetes. 2014;63:850–866. doi: 10.2337/db13-0573. [DOI] [PMC free article] [PubMed] [Google Scholar]
- 40.Johnston-Cox H, Eisenstein AS, Koupenova M, Carroll S, Ravid K. The macrophage A2B adenosine receptor regulates tissue insulin sensitivity. PLoS One. 2014;9:e98775. doi: 10.1371/journal.pone.0098775. [DOI] [PMC free article] [PubMed] [Google Scholar]
- 41.Johnston-Cox H, Koupenova M, Yang D, Corkey B, Gokce N, Farb MG, LeBrasseur N, Ravid K. The A2b adenosine receptor modulates glucose homeostasis and obesity. PLoS One. 2012;7:e40584. doi: 10.1371/journal.pone.0040584. [DOI] [PMC free article] [PubMed] [Google Scholar]
- 42.Ra F, Wang G, Srinivasan S, Jung DY, Zhang Z, Pankow JS, Ravid K, Fredholm B, Hedrick CC, Rich SS, Kim JK, LaNoue KF, Linden J. Links between insulin resistance, adenosine A2B receptors, and inflammatory markers in mice and humans. Diabetes. 2011;60:669–679. doi: 10.2337/db10-1070. [DOI] [PMC free article] [PubMed] [Google Scholar]
- 43.Ogihara T, Asano T, Ando K, Sakoda H, Anai M, Shojima N, Ono H, Onishi Y, Fujishiro M, Abe M, Fukushima Y, Kikuchi M, Fujita T. High-salt diet enhances insulin signaling and induces insulin resistance in Dahl salt-sensitive rats. Hypertension. 2002;40:83–89. doi: 10.1161/01.HYP.0000022880.45113.C9. [DOI] [PubMed] [Google Scholar]
- 44.Shehata MF. Important genetic checkpoints for insulin resistance in salt-sensitive (S) Dahl rats. Cardiovasc Diabetol. 2008;7:19. doi: 10.1186/1475-2840-7-19. [DOI] [PMC free article] [PubMed] [Google Scholar]


