

Abstract
Environmental conditions control rRNA transcription. Previously, we found that serum and glucose deprivation induces KDM2A-mediated H3K36me2 demethylation in the rRNA gene (rDNA) promoter and reduces rRNA transcription in the human breast cancer cell line MCF-7. However, the molecular mechanism and biological significance are still unclear. In the present study, we found that glucose starvation alone induced the KDM2A-dependent reduction of rRNA transcription. The treatment of cells with 2-deoxy-d-glucose, an inhibitor of glycolysis, reduced rRNA transcription and H3K36me2 in the rDNA promoter, both of which were completely dependent on KDM2A in low concentrations of 2-deoxy-d-glucose, that is, mild starvation conditions. The mild starvation induced these KDM2A activities through AMP-activated kinase (AMPK) but did not affect another AMPK effector of rRNA transcription, TIF-IA. In the triple-negative breast cancer cell line MDA-MB-231, the mild starvation also reduced rRNA transcription in a KDM2A-dependent manner. We detected KDM2A in breast cancer tissues irrespective of their estrogen receptor, progesterone receptor, and HER2 status, including triple-negative cancer tissues. In both MCF-7 and MDA-MB-231 cells, mild starvation reduced cell proliferation, and KDM2A knockdown suppressed the reduction of cell proliferation. These results suggest that under mild glucose starvation AMPK induces KDM2A-dependent reduction of rRNA transcription to control cell proliferation.
INTRODUCTION
Regulation of cell growth ultimately depends on the control of new ribosome synthesis, and the rate of ribosome synthesis is tightly regulated in mammalian cells (1). Three of the four structured ribosomal RNA (rRNA) molecules constituting a ribosome are produced by processing a precursor transcript, pre-rRNA. The pre-rRNA is coded by rRNA genes (rDNA) and specifically transcribed by RNA polymerase I (Pol I) in the nucleolus (1–5). Ribosome biogenesis is limited by rRNA transcription, and the control of rRNA transcription is thought to play a central role in the regulation of ribosome biogenesis and cell growth (6–9). The rRNA transcription is dysregulated during tumorigenesis, and selective inhibition of rRNA transcription may offer a therapeutic strategy to block cancer cell proliferation (3, 10, 11).
The level of rRNA transcription is controlled by environmental conditions (11). To date, increasing numbers of studies have revealed that the signal transduction pathways reach the rRNA transcription machinery in the nucleolus and regulate rRNA transcription (7, 9, 12–14). Some signal pathways control the activities of basic transcription factors for Pol I (2). For example, mitogen-activated protein kinase (MAPK) signaling, the mammalian target of rapamycin signaling, and type 1 insulin-like growth factor activate rRNA transcription through upstream binding factor, selectivity factor 1 and/or transcription initiation factor IA (TIF-IA, the mammalian homolog of yeast Rrn3) (15–21). AMP-activated kinase (AMPK), a sensor to maintain energy homeostasis in cells, decreases binding of the TIF-IA to rDNA promoter to reduce rRNA transcription (22). Recent reports also suggest that signal transduction pathways control the epigenetic states of rDNA (6). For example, while histone methylation, a key type of histone modification, plays a central role in epigenetic regulation (23), growth factor deprivation leads to upregulation of long noncoding RNAs (lncRNAs), recruitment of the H4K20 methyltransferase Suv4-20h2 with lncRNAs to rDNA, increased H4K20me3 levels, and compaction of chromatin (24). Manipulation of chromatin structures has been thought to be a novel therapy for cancer (25, 26), and further information on the control mechanisms of rDNA chromatin structures by signal transduction pathways would contribute to these therapies.
Although methylation of histones was long thought to be an irreversible modification, the discovery of histone demethylases has highlighted the dynamic nature of the regulation of histone methylation (27, 28). KDM2A (also known as FbxL11 and JHDM1A), a modular protein containing JmjC and CXXC-zinc finger domains, selectively removes mono- and dimethylation from histone H3K36 (H3K36me1/2) (29). KDM2A is expressed throughout the body during embryogenesis, and studies with KDM2A-KO mice suggest that KDM2A plays an essential role in embryonic development (30). Epigenetic dysregulation has emerged as a major contributor to tumorigenesis, and KDM2A is frequently overexpressed in non-small-cell lung cancer tumors and cell lines (31). The elevated expression of KDM2A promotes lung tumorigenesis by epigenetically enhancing ERK1/2 signaling (31), suggesting that KDM2A acts as a tumorigenic factor. On the other hand, KDM2A also shows tumor-suppressive functions. It was reported that the expression of KDM2A is significantly decreased in prostate carcinomas compared to normal prostate tissue (32, 33) and that KDM2A was implicated in suppressing genomic instability during mitosis (32, 33), inhibiting the ability of cells to grow under anchorage-independent conditions and to be transformed by the ras oncogene (33). These results suggest that KDM2A epigenetically regulates tumor progressions both positively and negatively, depending on the cell type.
Breast cancer is the most frequently diagnosed cancer in women and one of the leading causes of cancer death for women (34). Clinically, breast cancer can be divided into distinct subtypes that have prognostic and therapeutic implications. Expressions of estrogen receptor (ER) and progesterone receptor (PR) and amplification of HER-2/Neu are frequently evaluated in breast cancers. Tumors that do not express ER or PR and do not have HER-2/Neu amplification are referred to as triple-negative breast cancers (TNBCs). TNBCs represent approximately 10 to 15% of all breast cancers, and patients with TNBC have a poor outcome compared to the other subtypes of breast cancer (34).
In our previous study, we showed that KDM2A demethylated H3K36me2 in the rDNA promoter on starvation and reduced rRNA transcription in the breast cancer cell line MCF-7, which expresses ER and PR (14). Further, we demonstrated that KDM2A binds to the rDNA promoter with unmethylated CpG sequences via the CXXC-zinc finger domain and that starvation induces KDM2A-mediated H3K36me2 demethylation in the rDNA promoter in a JmjC domain-dependent manner and reduces rRNA transcription (14, 35). However, the molecular mechanism by which KDM2A in the rDNA promoter is regulated by starvation and the biological significance are still unclear.
In this study, we found that glucose deprivation repressed the rRNA transcription caused by KDM2A. Reduction of rRNA transcription was completely KDM2A-dependent at low concentrations of 2-deoxy-d-glucose (2DG), an inhibitor of glycolysis, that is, mild starvation conditions. Further, we identified AMPK as a crucial mediator for the glucose-starvation signal reaching KDM2A in the rDNA promoter. The mild starvation did not reduce the level of TIF-IA (22), the basic transcription factor for Pol I, in the rDNA promoter. These results suggest that KDM2A is sensitive to the starvation signal from AMPK to control rRNA transcription. We detected KDM2A in breast cancer tissues irrespective of their ER, PR, and HER2 statuses, including TNBC tissues. Finally, we provided the evidence that the KDM2A-dependent reduction of rRNA transcription suppressed proliferation of breast cancer cells, including TNBC cells.
MATERIALS AND METHODS
Cell culture.
The human breast adenocarcinoma cell line MCF-7 was cultured in RPMI 1640 medium (Nakalai Tesque, catalog no. 30264) supplemented with 10% fetal calf serum (FCS), 100 U of penicillin G (Nakalai Tesque, catalog no. 26239-42)/ml, and 100 μg streptomycin sulfate (Nakalai Tesque, catalog no. 33204-92)/ml (10FCS-RPMI) or in Dulbecco modified Eagle medium (DMEM; Sigma-Aldrich, catalog no. D5796) supplemented with 10% FCS, 100 U of penicillin G/ml, and 100 μg of streptomycin sulfate/ml (10FCS-DMEM). The human breast adenocarcinoma cell line MDA-MB-231 was cultured in 10FCS-DMEM. Cells were maintained at 37°C in a humidified atmosphere containing 5% CO2.
To identify the conditions that affect rRNA transcription, MCF-7 cells were cultured in 10FCS-DMEM, serum- and glucose-free DMEM (Sigma-Aldrich, catalog no. D5030), and Opti-MEM I (Life Technologies, catalog no. 11058-021). To identify the compounds that affect rRNA transcription, MCF-7 cells were cultured in serum- and glucose-free DMEM supplemented with insulin (6.67 μg/ml; Sigma-Aldrich, catalog no. I-3505), glucose (0.45 g/liter; Wako, catalog no. 041-00595), hypoxanthine (0.1 mM; Nacalai Tesque, catalog no. 17487-01), holo-transferrin (0.1 mg/ml; Nacalai Tesque, catalog no. 34443-44), and/or thymidine (16 μM; Kohjin, catalog no. 180), which are components of Opti-MEM.
To investigate how cells respond to various levels of glucose starvation, cells were cultured in 10FCS-RPMI containing different concentrations of 2-deoxy-d-glucose (2DG; Sigma-Aldrich, catalog no. D8375). To inhibit AMPK activity, MCF-7 cells were treated with 10 μM compound C (IN Solution AMPK Inhibitor, compound C; Calbiochem, catalog no. 171261) for 1 h before treatment with 2DG. To activate AMPK, cells were cultured in 10FCS-RPMI containing 5-aminoimidazole-4-carboxamide-1-β-d-ribofuranoside (AICAR; Tokyo Chemical Industry, catalog no. A2528).
RNA extraction and qRT-PCR.
Total RNA isolation from cells and cDNA synthesis were performed as described previously (14). The products were diluted up to 150 μl with distilled water, and 2.5 μl of the resultant single-strand cDNA was used as the template for quantitative reverse transcription-PCR (qRT-PCR), using Thunderbird SYBR qPCR Mix (Toyobo, catalog no. QPS-201) with an Mx3000P QPCR system (Agilent Technologies) according to the manufacturer's instructions. The values were normalized using the amounts for control mRNA for RNA polymerase II subunit a (Polr2a), β-actin (36), or TATA-binding protein (TBP). The PCR primer sets used for amplification of the pre-rRNA (a sequence in the 5′ untranslated 1-155 region) were as follows: 5′-GCTGACACGCTGTCCTCTG-3′ and 5′-TCGGACGCGCGAGAGAAC-3′. For KDM2A, the primers used were 5′-TCCCCACACACATTTTGACATC-3′ and 5′-GGGGTGGCTTGAGAGATCCT-3′. For Polr2a, the primers used were 5′-ATCTCTCCTGCCATGACACC-3′ and 5′-AGACCAGGCAGGGGAGTAAC-3′ (14). For β-actin, the primers used were 5′-CGTCTTCCCCTCCATCGT-3′ and 5′-GAAGGTGTGGTGCCAGATTT-3′. For TBP, the primers used were 5′-TGCTGCGGTATTCATGAGGATA-3′ and 5′-TGAAGTCCAAGAACTTAGCTGGAA-3′.
siRNA and transfection.
To introduce small interfering RNA (siRNA), cells were treated with specific siRNAs using Lipofectamine RNAiMAX (Life Technologies, catalog no. 13778-150) according to the manufacturer's instructions. The siRNAs specific for KDM2A were siKDM2A (5′-GAACCCGAAGAAGAAAGGAUUCGUU-3′) and siKDM2A-w (5′-CCGUUCCCACCUAACUAAGGAAUUU-3′), which have been described previously (14). The siRNA, Stealth RNAi negative control medium GC duplex (Life Technologies), was transfected as a control.
To knock down AMPKα, the siRNA for AMPKα1/2 (Santa Cruz Biotechnology, catalog no. sc-45312) was used. The control siRNA-A (Santa Cruz Biotechnology, catalog no. sc-37007) was transfected as a control.
Measurement of intracellular ATP.
The levels of ATP in MCF-7 cells were detected by the luciferase assay system using a Cell Titer-Glo assay kit (Promega, catalog no. G7570), according to the manufacturer's instructions. The ATP levels were expressed relative to those in cells without 2DG treatment.
The intracellular ATP levels in each cell were detected through the Förster resonance energy transfer (FRET) signal of an ATP indicator based on the epsilon subunit for analytical measurements (ATeam) protein (37). For imaging cellular ATP levels, MCF-7 cells were transfected with the expression plasmids for ATeam (pcDNA-cATeam) or mutant-type ATeam (pcDNA-mut cATeam). Two days after transfection, these cells were further cultured 2 h in 10FCS-DMEM (growth medium) or 10FCS-DMEM containing 2 mM 2DG (2DG); the intensities of the emission signals of YFP (Venus) from CFP and signals of CFP (mseCFP) were then detected by fluorescence microscopy systems, and the Venus/mseCFP ratios were calculated from these intensities, using the ImageJ program with suitable plug-ins (38). The color gradation from blue to red in cells shows the ratio of Venus/mseCFP (see Fig. S1 in the supplemental material).
Antibodies.
Anti-trimethylated histone H3 lys36 antibody (Active Motif, catalog no. 61021), anti-histone H3 antibody (Abcam, catalog no. ab1791), anti-dimethylated histone H3 lys36 antibody (Active Motif, catalog no. 61019), anti-Rrn3 (TIF-IA) antibody (Abcam, catalog no. ab112052), mouse monoclonal anti-β-actin (AC-15) antibody (Sigma, catalog no. A-5441), goat anti-rabbit IgG–HRP (Santa Cruz Biotechnology, catalog no. sc-2054) and goat anti-mouse IgG-HRP (Santa Cruz, catalog no. sc-2005) were purchased. Anti-phosphorylated AMPKα (Thr-172), anti-AMPKα, anti-phosphorylated acetyl coenzyme A carboxylase (ACC; Ser-79), and anti-ACC antibodies were purchased as AMPK and ACC antibody sampler kits (Cell Signaling, catalog no. 9957). The control antibody (Cell Signaling, normal rabbit IgG, catalog no. 2729S) for chromatin immunoprecipitation (ChIP) assays was also purchased. The anti-KDM2A antibody was described previously (14).
Western blotting.
Western blotting was performed as described previously (14). The intensities of the bands were measured by Multi Gauge software (Fujifilm, Inc.). The effects of the treatments on the band intensities were expressed as the values relative to those obtained without treatment.
ChIP assay.
A ChIP assay was performed as described previously (14). To detect specific binding, the values simultaneously obtained by using the control antibody (normal rabbit IgG) were subtracted from those using specific antibodies. The values for specific binding were divided by total input (% of input). To express the levels of histone modifications in genes, the values for the specific histone H3 modifications were normalized by the values for H3 (% of input normalized by H3).
Tissues and immunostaining.
Routinely processed formalin-fixed and paraffin-embedded specimens from 39 Japanese patients with breast cancer resected from 2011 to 2012 at the Department of Surgery of Kurume University Hospital were used. The breast cancer tissues included papillotubular, solid-tubular, scirrhous, mucinous, and micropapillary carcinomas. Immunostaining of tissues was performed essentially as described previously (39). Serial sections (4 μm) containing cancerous and noncancerous areas were mounted on 3-aminopropyltriethoxysilane-coated slides (Matsunami Glass, Osaka, Japan), and deparaffinized in xylene/alcohol and graded alcohols. The sections were microwaved in 10 mM sodium citrate buffer (pH 6.9) for 50 min for antigen retrieval. Immunostaining for KDM2A was performed using a streptavidin-biotin peroxidase (SAB-PO) kit (Nichirei, Tokyo, Japan) according to the manufacturer's protocol. After treatment with avidin and rabbit serum, the sections were incubated with primary antibodies at 4°C overnight. The peroxidase reaction was developed by the addition of 3,3-diaminobenzidine-H2O2 substrate solution, followed by incubation for 5 min. After light counterstaining with hematoxylin, the slides were dehydrated, coverslipped, and observed under a microscope (Olympus BX41, Olympus Optical, Tokyo, Japan). Negative controls were prepared by replacing the primary antibody with normal rabbit IgG.
Two pathologists, S. Ogasawara and H. Yano, who did not know the clinical status of each patient, independently evaluated and interpreted the results of immunostaining using Allred scoring for estrogen receptor (ER) expression (40, 41). The expression (staining) levels of KDM2A were classified into four categories: tumors that showed the KDM2A staining similar to that in nonneoplastic epithelial area were scored as 3, tumors that showed intermediate KDM2A staining were scored as 2, tumors that showed weak KDM2A staining were scored as 1, and tumors containing no identifiable KDM2A were scored as 0. To estimate the rate of stained cells, positive and negative tumor cells in a field were counted, and the ratio of positive to total cells was expressed as one of six categories: 0/100 as 0, 1/100 as 1, 1/10 as 2, 1/3 as 3, 2/3 as 4, and 1/1 as 5. The ratio of stained cells was added to the strength of the KDM2A staining to produce the KDM2A score. The sections were also characterized by ER, PR, and HER2 staining as described previously (41), and the results are shown in Table 1. This study was approved by the institutional ethics review board of Kurume University.
TABLE 1.
KDM2A expression and clinicopathological characteristics of breast cancer tissues
| Breast carcinoma subtype | KDM2A scorea | No. of specimens resected | No. of specimens with: |
|||||||||
|---|---|---|---|---|---|---|---|---|---|---|---|---|
| Strong KDM2A expression in invading cellsb | HER2 expression level of: |
ERc |
PRc |
TNBCsd |
||||||||
| 0 | 1 | 2 | 3 | − | + | − | + | |||||
| Papillotubular | 4 | 2 | 2 | 1 | 0 | 1 | 0 | 0 | 2 | 0 | 2 | 0 |
| 5 | 1 | 0 | 1 | 0 | 0 | 0 | 0 | 1 | 0 | 1 | 0 | |
| 6 | 1 | 1 | 0 | 0 | 1 | 0 | 0 | 1 | 0 | 1 | 0 | |
| 7 | 5 | 3 | 1 | 0 | 0 | 4 | 3 | 2 | 5 | 0 | 1 | |
| 8 | 9 | 3 | 5 | 4 | 0 | 0 | 1 | 8 | 1 | 8 | 1 | |
| Solid-tubular | 4 | 0 | 0 | 0 | 0 | 0 | 0 | 0 | 0 | 0 | 0 | 0 |
| 5 | 1 | 1 | 0 | 0 | 1 | 0 | 0 | 1 | 0 | 1 | 0 | |
| 6 | 0 | 0 | 0 | 0 | 0 | 0 | 0 | 0 | 0 | 0 | 0 | |
| 7 | 2 | 1 | 0 | 1 | 1 | 0 | 0 | 2 | 1 | 1 | 0 | |
| 8 | 0 | 0 | 0 | 0 | 0 | 0 | 0 | 0 | 0 | 0 | 0 | |
| Scirrhous | 4 | 2 | 1 | 0 | 0 | 0 | 2 | 1 | 1 | 1 | 1 | 0 |
| 5 | 0 | 0 | 0 | 0 | 0 | 0 | 0 | 0 | 0 | 0 | 0 | |
| 6 | 4 | 2 | 3 | 0 | 1 | 0 | 0 | 4 | 1 | 3 | 0 | |
| 7 | 3 | 1 | 1 | 0 | 1 | 1 | 1 | 2 | 2 | 1 | 0 | |
| 8 | 5 | 0 | 3 | 1 | 1 | 0 | 0 | 5 | 0 | 5 | 0 | |
| Mucinous | 4 | 0 | 0 | 0 | 0 | 0 | 0 | 0 | 0 | 0 | 0 | 0 |
| 5 | 0 | 0 | 0 | 0 | 0 | 0 | 0 | 0 | 0 | 0 | 0 | |
| 6 | 0 | 0 | 0 | 0 | 0 | 0 | 0 | 0 | 0 | 0 | 0 | |
| 7 | 2 | 1 | 1 | 1 | 0 | 0 | 0 | 2 | 1 | 1 | 0 | |
| 8 | 0 | 0 | 0 | 0 | 0 | 0 | 0 | 0 | 0 | 0 | 0 | |
| Micropapillary | 4 | 0 | 0 | 0 | 0 | 0 | 0 | 0 | 0 | 0 | 0 | 0 |
| 5 | 1 | 1 | 0 | 0 | 1 | 0 | 0 | 1 | 0 | 1 | 0 | |
| 6 | 1 | 0 | 0 | 0 | 0 | 1 | 1 | 0 | 1 | 0 | 0 | |
| 7 | 0 | 0 | 0 | 0 | 0 | 0 | 0 | 0 | 0 | 0 | 0 | |
| 8 | 0 | 0 | 0 | 0 | 0 | 0 | 0 | 0 | 0 | 0 | 0 | |
The ratio of stained cells (0 to 5) was added to the strength of the KDM2A staining (0 to 3) to produce the KDM2A score (0 to 8). The KDM2A scores of all specimens ranged from 4 to 8.
KDM2A staining intensity score of 3 in breast cancer cells invading around the main tumor.
+, present; −, absent.
TNBCs, triple-negative breast cancers, i.e., tumors that do not express estrogen receptor (ER) or progesterone receptor (PR) and do not have HER-2/Neu amplification.
RESULTS
Glucose suppresses KDM2A-dependent reduction of rRNA transcription in starvation conditions.
In our previous studies, we found that glucose and serum deprivation induced KDM2A-mediated H3K36me2 demethylation and reduces rRNA transcription (14, 35). These results suggest that the growth medium, but not the starvation medium, contains a factor(s) that inhibits the starvation signal to activate KDM2A.
To identify the factor(s) that inhibits the starvation signal, we first tested whether rRNA transcription was reduced in Opti-MEM, which is serum-free medium supplemented with several identified factors. We found that rRNA transcription was hardly reduced in MCF-7 cells in Opti-MEM (Fig. 1A). The addition of glucose, insulin, hypoxanthine, transferrin, and thymidine together, which are supplemental factors in Opti-MEM, to the starvation medium completely prevented the reduction of rRNA transcription (Fig. 1B). The addition of insulin or glucose to the starvation medium partially inhibited the reduction of rRNA transcription (Fig. 1B). Although the addition of glucose to the starvation medium elevated rRNA transcription in control cells, it did not in KDM2A-knockdown cells (Fig. 1C). On the other hand, the addition of insulin to the starvation medium elevated rRNA transcription in control cells, as well as in KDM2A-knockdown cells (Fig. 1D). These results suggest that glucose but not insulin inhibits the starvation signal to KDM2A and that glucose starvation induced the KDM2A-dependent reduction of rRNA transcription. 2-Deoxy-d-glucose (2DG) is a glucose analog and inhibits glucose metabolism (42). 2DG treatment prevented the elevation of rRNA transcription by glucose in the starvation medium (Fig. 1E), while 2DG did not reduce KDM2A expression (Fig. 1E). These results show that glucose is a key molecule in the regulation of KDM2A activity.
FIG 1.

Glucose suppresses KDM2A-dependent repression of rRNA transcription in starvation conditions. (A) MCF-7 cells were cultured 2 h in the growth medium (DMEM supplemented with 10% serum), starvation medium (serum- and glucose-free DMEM), or Opti-MEM (serum-free and supplemented with several factors). Total RNA was isolated and analyzed by quantitative real-time PCR (qRT-PCR) using specific primers for pre-rRNA. The expression levels were normalized by RNA polymerase II subunit a (Polr2a) mRNA. (B) Cells were cultured for 2 h in serum- and glucose-free DMEM supplemented with 6.67 μg of insulin/ml, 0.45 g of glucose/liter, 0.1 mM hypoxanthine, 0.1 mg of holo-transferrin/ml, and/or 16 μM thymidine, which are included in Opti-MEM. Pre-rRNA was detected as in panel A. (C) MCF-7 cells were transfected with control siRNA (control) or KDM2A siRNA (siKDM2A). Three days after transfection, the cells were further cultured for 2 h in serum- and glucose-free DMEM (“starvation +”) supplemented with or without 0.45 g of glucose/liter. Pre-rRNA and KDM2A mRNA were measured by qRT-PCR. The expression levels were normalized by using Polr2 mRNA. (D) Cells were treated and pre-rRNA and KDM2A mRNA were detected as for panel C, except that cells were cultured in serum- and glucose-free DMEM supplemented with or without 6.67 μg of insulin/ml. (E) Cells were cultured 2 h in growth medium (“starvation −”), the serum- and glucose-free DMEM (“starvation +”) or starvation medium supplemented with glucose in the absence or presence of 2 mM 2DG. Pre-rRNA and KDM2A mRNA were detected as in panel C. All experiments were performed three times, and mean values with the standard deviations are indicated. *, P < 0.05.
Mild starvation induces KDM2A-dependent reduction of rRNA transcription.
When 2DG was added to the growth medium, rRNA transcription was reduced in a dose-dependent manner (Fig. 2A). The reductions of rRNA transcription by 2DG were weakened by a KDM2A knockdown (Fig. 2A). Especially at low concentrations of 2DG (1 to 2 mM), the KDM2A knockdown completely suppressed the reduction of rRNA transcription (Fig. 2A). These results suggest that the relatively mild glucose starvation induced only the KDM2A-dependent mechanism to reduce rRNA transcription, whereas more severe glucose starvation with 10 mM 2DG activated an additional mechanism(s) to reduce rRNA transcription.
FIG 2.

KDM2A reduces rRNA transcription in mild glucose-starvation conditions. (A) Three days after transfection of control siRNA (control) or KDM2A siRNA (siKDM2A), MCF-7 cells were further cultured for 2 h in RPMI 1640 supplemented with 10% serum in the presence of 2DG at the indicated concentrations, and the amounts of pre-rRNA and KDM2A mRNA were measured by qRT-PCR. The expression levels were normalized by Polr2 mRNA. (B) Three days after transfection of siRNAs, the cells were further cultured for 2 h in RPMI 1640 supplemented with 10% serum in the presence or absence of 2 mM 2DG. ChIP analyses were performed to detect H3K36me2, H3K36me3, histone H3, and KDM2A in the rDNA promoter. The results of the histone modifications were expressed as the percentage of input normalized by the histone H3 values. The results of KDM2A were expressed as the percentage of input. (C) Three days after transfection of siRNAs, cells were further cultured for 2 h in various concentrations of glucose-containing DMEM supplemented with insulin, hypoxanthine, transferrin, and thymidine, and the amounts of pre-rRNA and KDM2A mRNA were measured by qRT-PCR. The expression levels were normalized by Polr2 mRNA. (D) Three days after transfection of siRNAs, cells were further cultured for 2 h in various concentrations of glucose-containing DMEM supplemented with insulin, hypoxanthine, transferrin, and thymidine. ChIP analyses were performed to detect H3K36me2, H3K36me3, histone H3, and KDM2A in the rDNA promoter. The results are expressed as in panel B. All experiments were performed at least three times, and mean values with the standard deviations are indicated. *, P < 0.05.
To determine whether 2DG treatment affected the histone demethylase activity of KDM2A in the rDNA promoter, we assessed the H3K36me2 levels in the rDNA promoter by a ChIP assay. The results showed that the treatment with 2 mM 2DG decreased H3K36me2 in the rDNA promoter (Fig. 2B). A KDM2A knockdown abolished the decrease of H3K36me2 in the rDNA promoter (Fig. 2B). The amounts of trimethylated histone H3K36 (H3K36me3) were not decreased by 2DG treatment (Fig. 2B). The amount of KDM2A binding to the rDNA promoter was not changed by 2DG treatment (Fig. 2B). These results indicated that treatment with 2 mM 2DG specifically induced demethylation of H3K36me2 by KDM2A in the rDNA promoter.
To investigate the relationship of glucose starvation to treatment with 2 mM 2DG, cells were cultured in various concentrations of glucose-containing DMEM supplemented with insulin, hypoxanthine, transferrin, and thymidine. The level of rRNA transcription was reduced, when the concentration of glucose was decreased (Fig. 2C). A decrease in glucose to 0.01 to 0.04 g/liter reduced rRNA transcription to levels similar to those obtained after treatment with 2 mM 2DG. This reduction was completely suppressed by a KDM2A knockdown (Fig. 2C). Further, ChIP assay showed that the decrease of glucose to 0.01 g/liter reduced H3K36me2 in the rDNA promoter (Fig. 2D), and a KDM2A knockdown abolished the reduction (Fig. 2D). KDM2A and H3K36me3 in the rDNA promoter were not changed in the experimental conditions (Fig. 2D). These results indicated that the treatment with 2 mM 2DG is almost equivalent to a decrease in glucose to 0.01 to 0.04 g/liter in the KDM2A-dependent reduction of rRNA transcription and H3K36me2 demethylation in the rDNA promoter.
AMPK is activated by mild starvation.
2DG incorporated into cells is phosphorylated by hexokinase. Phosphorylated 2DG cannot be further metabolized in cells (43), and the accumulation of phosphorylated 2DG results in depletion of cellular ATP (43). After the cells were treated with 2DG, they were lysed, and cellular ATP was detected using a luciferase assay. The results showed that treatments with 2 and 10 mM 2DG reduced the levels of cellular ATP to 80 and 70%, respectively (Fig. 3A). The reduction of cellular ATP levels by treatment with 2 mM 2DG was also detected by a FRET-based ATP indicator system (Fig. 3B; see also Fig. S1 in the supplemental material), confirming that intracellular ATP was reduced in cells.
FIG 3.

AMPK is activated by 2DG. (A) MCF-7 cells were cultured for 2 h in RPMI 1640 supplemented with 10% serum in the presence of 2DG at the indicated concentrations, and the cellular ATP levels were detected by the luciferase assay system. The results were expressed as values relative to that without 2DG. The mean values with standard deviations (n = 12) are indicated. *, P < 0.05. (B) MCF-7 cells were cultured for 2 h in RPMI 1640 supplemented with 10% serum in the presence or absence of 2 mM 2DG, and the cellular ATP levels were detected by a FRET-based ATP indicator system with pcDNA-cATeam (see Fig. S1 in the supplemental material). The results were expressed as the ratio of YFP/CFP signals. The values in cells transfected with mutant type ATeam (pcDNA-mut cATeam) were used to detect background signals. Mean values with the standard deviations (n = 10) are indicated. *, P < 0.05. (C) Phosphorylation of AMPK and ACC by treatment with 2DG. MCF-7 cells were cultured 2 h in RPMI 1640 supplemented with 10% serum in the presence of 2DG at the indicated concentrations. Cells were lysed and analyzed by Western blotting to detect phosphorylated AMPK (phosphorylated Thr-172), total AMPK, phosphorylated ACC (phosphorylated Ser-79), and total ACC. The positions of protein markers with defined molecular masses are indicated on the right side of the figure. The relative intensities of bands are shown under the panels.
One sensitive sensor responding to the cellular ATP level is AMPK (44). In energy-defective conditions, the ratios of ADP to ATP and AMP to ATP are increased, resulting in activation of AMPK (45). In the activated AMPK, Thr-172 in the α subunit is phosphorylated (45). As shown in Fig. 3C, treatment of cells with 1 to 10 mM 2DG enhanced the phosphorylation of the AMPKα subunit. The activated AMPK phosphorylates several proteins to control cellular metabolisms, such as acetyl coenzyme A carboxylase (ACC), a key regulator of fatty acid synthesis (44, 46). The phosphorylation of ACC in cells treated with 2 mM 2DG was higher than that in cells without 2DG. That in cells treated with 10 mM 2DG was higher than that in cells treated with 2 mM 2DG, suggesting that ACC was partially phosphorylated by AMPK in the presence of 2 mM 2DG. These results indicated that treatment with 2 mM 2DG reduced cellular ATP levels and activated AMPK.
AMPK is required for KDM2A-dependent reduction of rRNA transcription and H3K36me2 demethylation induced by mild starvation.
To investigate AMPK involvement in the reduction of rRNA transcription by KDM2A, cells were pretreated with compound C, an inhibitor of AMPK (47). The inhibition of AMPK by compound C was confirmed by the decreased phosphorylation of ACC (see Fig. S2 in the supplemental material). As shown in Fig. 4A, compound C treatment inhibited the reduction of rRNA transcription by 2 mM 2DG. Knockdown of the catalytic subunit of AMPK, AMPKα (see Fig. S3 in the supplemental material), also suppressed the reduction of rRNA transcription (Fig. 4B). Compound C or AMPKα knockdown alone did not affect the levels of rRNA transcription (Fig. 4A and B).
FIG 4.

AMPK activity is required for 2 mM 2DG induced-reductions of rRNA transcription and H3K36me2 in rDNA promoter. (A) MCF-7 cells were cultured for 2 h in RPMI 1640 supplemented with 10% serum in the presence or absence of 2 mM 2DG with or without pretreatment of 10 μM compound C, an AMPK inhibitor, for 1 h, and the amounts of pre-rRNA were measured by qRT-PCR. The expression levels were normalized by Polr2 mRNA. The results were expressed as values relative to those without the treatments of compound C and 2DG. (B) Three days after transfection of control siRNA (control) or AMPKα 1/2 siRNA (siAMPK), MCF-7 cells were cultured 2 h in RPMI 1640 supplemented with 10% serum in the presence or absence of 2 mM 2DG. The amounts of pre-rRNA were measured by qRT-PCR. The results were expressed as in panel A. Knockdown of the AMPK subunit was confirmed by Western blotting shown in Fig. S3 in the supplemental material. (C) After cells were treated as for panel A, ChIP analyses were performed to detect H3K36me2, H3K36me3, and KDM2A in the rDNA promoter. The results were expressed as in Fig. 2B. All experiments were performed three times, and mean values with the standard deviations are indicated. *, P < 0.05.
To investigate whether AMPK is involved in controlling the demethylation activity of KDM2A, the H3K36me2 levels in the rDNA promoter were measured. Although the treatment of cells with 2 mM 2DG reduced the level of H3K36me2 in the rDNA promoter, compound C inhibited the reduction of H3K36me2 levels by 2DG treatment (Fig. 4C). Compound C alone did not affect the levels of H3K36me2 in the rDNA promoter (see Fig. S4 in the supplemental material). The amount of histone H3K36me3 in the rDNA promoter was not changed by these treatments (Fig. 4C). These results indicate that AMPK activity was required for the 2DG treatment to decrease H3K36me2 in the rDNA promoter. The amount of KDM2A in the rDNA promoter was not changed by compound C in 2DG-treated cells (Fig. 4C), suggesting that the demethylase activity of KDM2A was controlled by AMPK activated by 2DG.
AMPK activation reduces rRNA transcription and H3K36me2 in rDNA promoter in a KDM2A-dependent manner.
To investigate whether AMPK activation is sufficient to induce the KDM2A-dependent reduction of rRNA transcription, cells were treated with AICAR, an activator of AMPK. Treatment of cells with 0.5 mM AICAR for 3 h induced phosphorylation of AMPK and ACC (Fig. 5A). Treatment with 0.5 mM AICAR for 3 and 6 h reduced rRNA transcription, and KDM2A knockdown completely abolished the reduction of rRNA transcription (Fig. 5B).
FIG 5.

Activation of AMPK induces KDM2A-dependent reductions of rRNA transcription and H3K36me2 in rDNA promoter. (A) MCF-7 cells were treated with AICAR at the indicated concentrations for 3 h in RPMI 1640 supplemented with 10% serum and analyzed by Western blotting as for Fig. 3C. The relative intensities of bands are shown under the panels. (B) Three days after transfection of control siRNA (control) or KDM2A siRNA (siKDM2A), cells were treated with 0.5 mM AICAR for 0, 3, and 6 h in RPMI 1640 supplemented with 10% serum. The amounts of pre-rRNA and KDM2A mRNA were measured by qRT-PCR. The expression levels were normalized by β-actin mRNA. (C) After cells were treated as in panel B, ChIP analyses were performed to detect H3K36me2, H3K36me3, and KDM2A in the rDNA promoter. The results were expressed as in Fig. 2B. The experiments whose results are depicted in panels B and C were performed three times, and mean values with the standard deviations are indicated. *, P < 0.05.
Next, we investigated whether AICAR treatment induced demethylation of H3K36me2 by KDM2A in the rDNA promoter. Treatment with 0.5 mM AICAR for 3 and 6 h decreased H3K36me2 in the rDNA promoter (Fig. 5C), and a KDM2A knockdown completely abolished the reduction of H3K36me2 by AICAR treatment (Fig. 5C). The levels of H3K36me3 in the rDNA promoter were hardly affected by all treatments performed in these experiments (Fig. 5C). These results demonstrate that AMPK induces KDM2A-mediated demethylation H3K36me2 in the rDNA promoter and reduces rRNA transcription.
Recruitment of TIF-IA to rDNA promoter is not reduced by mild starvation.
Previously, it was reported that glucose starvation activated AMPK, which inhibited the recruitment of TIF-IA to the rDNA promoter to reduce rRNA transcription (22). To test whether the change of recruitment of TIF-IA to the rDNA promoter was involved in the reduction of rRNA transcription by 2DG treatment, ChIP experiments were performed. TIF-IA accumulated in the rDNA promoter but not in the gene body (see Fig. S5 in the supplemental material). Although the treatment of cells with 10 mM 2DG decreased the amount of TIF-IA in the rDNA promoter (Fig. 6A), treatment with 2 mM 2DG did not (Fig. 6A). On the other hand, treatment of cells with 2 mM 2DG decreased the levels of H3K36me2 in the rDNA promoter to a level similar to that observed in cells treated with 10 mM 2DG (Fig. 6B). The H3K36me3 levels in the rDNA promoter were not affected by treatment with 2 or 10 mM 2DG (Fig. 6C). These results show that mild starvation with 2 mM 2DG reduces rRNA transcription without affecting the recruitment of TIF-IA to the rDNA promoter.
FIG 6.
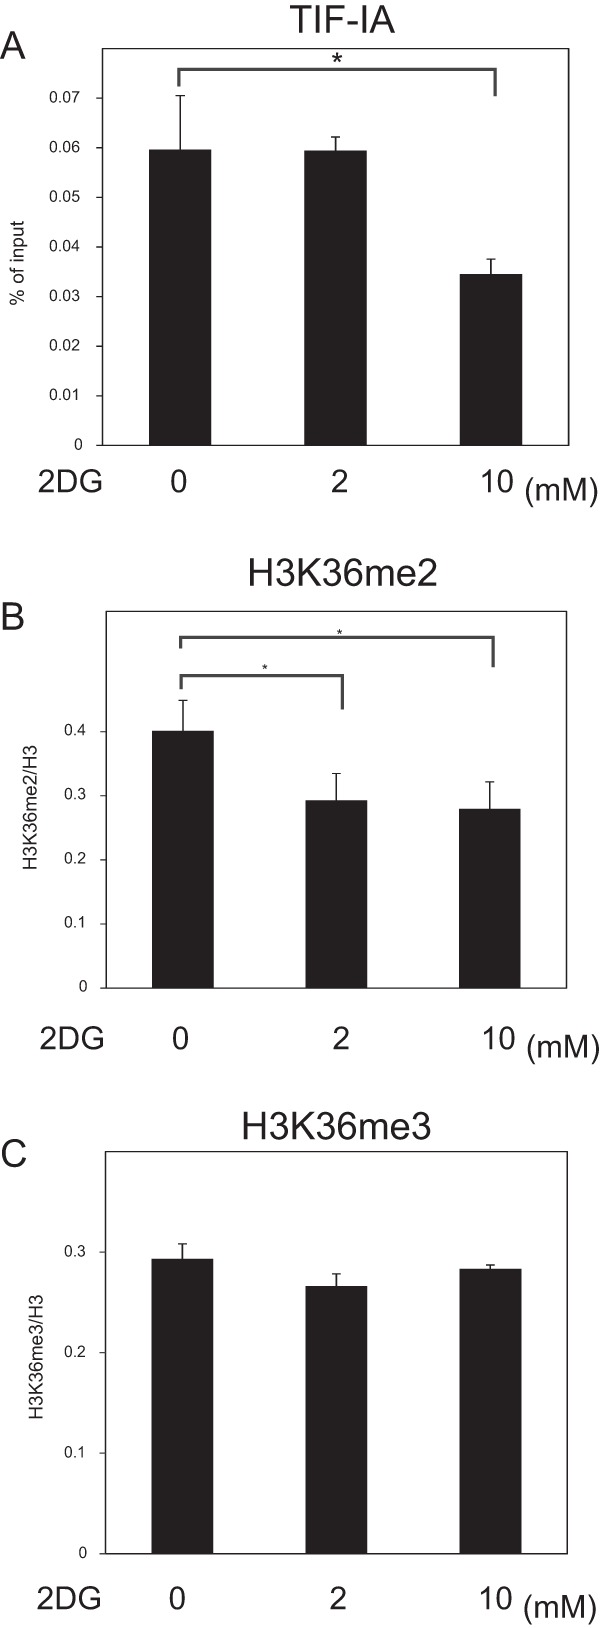
TIF-IA in rDNA promoter is decreased by 10 mM 2DG but not 2 mM 2DG. After MCF-7 cells were cultured 2 h in RPMI 1640 supplemented with 10% serum in the absence or presence of 2DG at the indicated concentrations, ChIP analyses were performed to detect TIF-IA (A), H3K36me2 (B), and H3K36me3 (C) in the rDNA promoter. The results of panel A were expressed as the percentage of input. The results of panels B and C are expressed as in Fig. 2B. All experiments were performed three times, and mean values with the standard deviations are indicated. *, P < 0.05.
Compound C treatment in the presence of 2 mM 2DG did not elevate the amount of TIF-IA in the rDNA promoter (see Fig. S5 in the supplemental material), suggesting that the elevation of rRNA transcription by compound C in the presence of 2DG (Fig. 4A) was not due to the changes of TIF-IA in the rDNA promoter.
KDM2A reduces rRNA transcription under mild starvation conditions in TNBC cell line MDA-MB-231.
MCF-7 cells, which we investigated in the experiments above, express ER and PR. Next, we tested whether KDM2A functions in a TNBC cell line MDA-MB-231. First, the expression of KDM2A was detected in MDA-MB-231 cells. The results of Western blotting and RT-PCR indicated that MDA-MB-231 cells expressed KDM2A protein and mRNA, at levels comparable to those of MCF-7 cells (Fig. 7A and B). Treatment with siRNA for KDM2A (siKDM2A or siKDM2A-w) reduced those signals, confirming that the signals detected were for KDM2A. Immunocytological studies detected for KDM2A signals in the nucleus and nucleoli, and the signals were highly reduced by siRNA for KDM2A (siKDM2A or siKDM2A-w) (Fig. 7C). These results showed that KDM2A was localized in nuclei and nucleoli of MDA-MB-231 cells as in MCF-7 cells (14). When MDA-MB-231cells were treated with 3 mM 2DG, rRNA transcription was reduced ca. 60%, and this reduction was suppressed by a KDM2A knockdown (Fig. 7D). These results indicate that the reduction of rRNA transcription by KDM2A under mild starvation conditions occurs in MDA-MB-231 cells and that KDM2A-dependent regulation of rRNA transcription is not cell line specific.
FIG 7.

KDM2A reduces rRNA transcription under mild starvation conditions in triple negative breast cancer (TNBC) cells. (A) Three days after transfection of control siRNA (control) or siRNA for KDM2A (siKDM2A or siKDM2A-w), MDA-MB-231 and MCF-7 cells were lysed and analyzed by Western blotting with antibodies to KDM2A and β-actin. (B) After the cells were prepared as described for panel A, RNA was isolated and analyzed by qRT-PCR with specific primers for KDM2A. The expression levels were normalized by TBP mRNA. (C) After the cells were prepared as described for panel A, KDM2A was detected by indirect immunofluorescence technique with anti-KDM2A (red) and antinucleolin (green) antibodies. (D) KDM2A reduces rRNA transcription under mild starvation conditions. After the cells were treated as described for panel A, MDA-MB-231 cells were cultured for 2 h in DMEM supplemented with 10% serum in the presence (+) or absence (−) of 3 mM 2DG. The amounts of pre-rRNA and KDM2A mRNA were measured by qRT-PCR. The expression levels were normalized by using polr2a mRNA.
KDM2A is expressed in breast cancer tissues.
To investigate the expression of KDM2A in breast cancer tissues, tumors from surgical breast cancer specimens including papillotubular, solid-tubular, scirrhous, mucinous, and micropapillary carcinomas were resected, and KDM2A was detected immunohistochemically. Hematoxylin and eosin staining was used to demarcate tumor areas. The section shown in Fig. 8A contains papillotubular carcinoma tissue and a nonneoplastic area. Figure 8B shows marked staining of KDM2A in both neoplastic and nonneoplastic areas. Specific staining was not observed when the first antibody was omitted (Fig. 8C). Staining of KDM2A was found in the nuclear regions of cells in both neoplastic and nonneoplastic areas, as shown in high-magnification photomicrographs (Fig. 8D and E, respectively). Staining indexes of KDM2A (KDM2A score) in 39 neoplastic areas, were determined (Table 1). The KDM2A scores of all specimens ranged from 4 to 8. We detected KDM2A in breast carcinomas irrespective of the presence or absence of ER, PR, and/or overexpressed HER2, including triple-negative specimens (Table 1 and Fig. 8). Our results showed that the expression of KDM2A in breast carcinomas remained during carcinogenesis.
FIG 8.

Human breast cancer tissues express KDM2A. (A) Breast cancer tissue with triple-negative papillotubular carcinoma (hematoxylin and eosin staining; magnification, ×40). (B) Serial section of panel A stained with anti-KDM2A antibody, showing the expression of KDM2A in both neoplastic and nonneoplastic areas (×40). (C) Control serial section, in which the primary antibody was omitted (×40). (D) High magnification of the neoplastic area in panel B (×200). (E) High magnification of the nonneoplastic area in panel B (×200). Positive staining is brown, and counterstained nuclei are blue (B to E).
KDM2A reduces cell proliferation under mild starvation conditions.
The rate of ribosome biogenesis controls cell proliferation (1–5). Because reduction of rRNA transcription by mild glucose starvation was completely KDM2A-dependent, we investigated whether cell proliferation under mild glucose starvation conditions was regulated by KDM2A. When MCF-7 cells were cultured in the presence of 2 mM 2DG in the growth medium for 2 days, cell numbers were reduced to about 50% (Fig. 9A). Treatment of cells with siRNA for KDM2A (siKDM2A or siKDM2A-w) recovered rRNA transcription (Fig. 9B), as described in Fig. 2, and cells were resistant to the reduction of cell numbers (Fig. 9A). To investigate the impact of the reduction of rRNA transcription on cell proliferation directly, cells were treated with various concentrations of CX-5461, a Pol I-specific inhibitor (48). When cells were treated with 50 and 100 nM CX-5461, rRNA transcription was reduced to about 75 and 60%, respectively (Fig. 9C), similar to the reduction by treatment with 2 mM 2DG. When cells were treated with 50 and 100 nM CX-5461, cell numbers were reduced to 70 and 50%, respectively (Fig. 9D), also similar to the reduction by treatment with 2 mM 2DG.
FIG 9.

Mild starvation induces KDM2A-dependent reduction of cell numbers. (A) The treatment with 2DG reduced proliferation of MCF-7 cells and a knockdown of KDM2A suppressed the reduction. Two days after transfection of control siRNA (control) or siRNA for KDM2A (siKDM2A or siKDM2A-w), MCF-7 cells were replated and cultured in DMEM supplemented with 10% serum in the presence or absence of 2 mM 2DG. On the indicated days, the cells were counted. (B) Three days after transfection of control siRNA (control) or KDM2A siRNA (siKDM2A or siKDM2A-w), MCF-7 cells were further cultured 2 h in RPMI 1640 supplemented with 10% serum in the presence or absence of 2 mM 2DG, and the amounts of pre-rRNA and KDM2A mRNA were measured by qRT-PCR. The expression levels were normalized by polr2a mRNA. (C) MCF-7 cells were treated with various concentrations of CX-5461 for 14 h in RPMI 1640 supplemented with 10% serum, and the amount of pre-rRNA was measured by qRT-PCR. The expression levels were normalized by β-actin mRNA. (D) MCF-7cells were cultured in DMEM supplemented with 10% serum in the absence or presence of various concentrations of CX-5461, and the cells were counted on the indicated days. (E) Treatment with 2DG reduced the proliferation of MDA-MB-231cells, and knockdown of KDM2A suppressed the reduction. Two days after transfection of control siRNA (control) or siRNA for KDM2A (siKDM2A or siKDM2A-w), MDA-MB-231cells were replated and cultured in DMEM supplemented with 10% serum in the presence or absence of 3 mM 2DG. On the indicated days, the cells were counted. (F) MDA-MB-231 cells were treated with various concentrations of CX-5461 for 14 h in DMEM supplemented with 10% serum, and the amount of pre-rRNA was measured by qRT-PCR. The expression levels were normalized by β-actin mRNA. (G) MDA-MB-231 cells were cultured in DMEM supplemented with 10% serum in the presence of indicated concentrations of CX-5461, and the cells were counted. All experiments were performed three times, and mean values with the standard deviations are indicated. *, P < 0.05.
The effect of mild glucose starvation on cell proliferation was also investigated in MDA-MB-231cells. When MDA-MB-231cells were treated with 3 mM 2DG, the cell number was reduced ca. 50% (Fig. 9E). This reduction was suppressed by KDM2A knockdown (Fig. 9E). When cells were treated with 25 and 50 nM CX-5461, rRNA transcription was reduced to ca. 80 and 60%, respectively (Fig. 9F), values similar to the reductions by 3 mM 2DG treatment (Fig. 7D). The treatments with 25 and 50 nM CX-5461 also reduced the cell numbers to 65 and 45%, respectively (Fig. 9G). Together, these results indicate that regulation of rRNA transcription by KDM2A in mild starvation conditions affects cell proliferation of breast cancer cells.
DISCUSSION
In previous studies, we reported that KDM2A demethylates histone H3K36me2 in the rDNA promoter in the glucose- and serum-deprived starvation medium and represses rRNA transcription (14, 35). In the present study, we found that deprivation of glucose induced the KDM2A-dependent reduction of rRNA transcription (Fig. 1 and 2). The 2DG treatment reduced rRNA transcription, which was completely KDM2A dependent in the presence of low concentrations of 2DG, that is, in mild starvation conditions (Fig. 2). Mild starvation reduced H3K36me2 in the rDNA promoter in a KDM2A-dependent manner (Fig. 2). The 2 mM 2DG treatment for the mild starvation was almost equivalent to the decrease of glucose concentrations to 0.01 to 0.04 g/liter in the KDM2A-dependent reduction of rRNA transcription and H3K36me2 demethylation in the rDNA promoter (Fig. 2). Mild starvation reduced the intracellular ATP level to 80% and activated AMPK (Fig. 3). Specific inhibition of AMPK prevented the KDM2A-dependent reductions of H3K36me2 and rRNA transcription (Fig. 4), and an AMPK activator induced them (Fig. 5). These results demonstrate that AMPK in response to mild glucose starvation induces KDM2A-dependent demethylation of H3K36me2 in the rDNA promoter and reduction of rRNA transcription.
It has been reported that activation of AMPK by glucose starvation reduced the amount of TIF-IA recruited to the rDNA promoter and reduced rRNA transcription (22), which we confirmed in the presence of 10 mM 2DG (Fig. 6). However, this reduction of TIF-IA-recruitment did not occur in the presence of 2 mM 2DG (Fig. 6). Because TIF-IA is a basic transcription factor to recruit Pol I to the rDNA promoter, these results suggest that KDM2A affects rRNA transcription at the regulatory step after association with the basic transcription factor in the rDNA promoter. These results also suggest that AMPK controls the activities of two proteins, TIF-IA and KDM2A, which adjust rRNA transcription in response to different levels of glucose starvation, and that KDM2A finely controls the rRNA transcription level, sensitively responding to glucose starvation.
A knockdown of KDM2A completely abolished the reduction of H3K36me2 levels in the rDNA promoter under starvation. We previously demonstrated that the demethylase activity of KDM2A itself is required for the reductions of H3K36me2 in the rDNA promoter on starvation (14, 35). Therefore, the results that the amount of KDM2A in the rDNA promoter did not change during starvation (Fig. 2, 4, and 5) (14, 35) suggest that the demethylase activity of KDM2A in the rDNA promoter is induced by starvation. Although treatment of cells with 2 mM 2DG (mild starvation) decreased the levels of H3K36me2 in the rDNA promoter to a level similar to that observed in cells treated with 10 mM 2DG (severe starvation) (Fig. 6), mild starvation did not induce TIF-IA detachment from the rDNA promoter and only partially induced phosphorylation of ACC (Fig. 4). These results suggested that mild glucose starvation efficiently induces the KDM2A-mediated H3K36me2 demethylation in the rDNA promoter among the proteins controlled by AMPK. Although there are reports searching the AMPK substrates (49–51) and the AMPK binding proteins (52), KDM2A has been identified as neither a substrate nor as a binding protein for AMPK at this point, and the mechanism of this highly efficient activation of KDM2A induced through AMPK is currently unknown and appears to be an important issue in understanding the regulation of rDNA chromatin and rRNA transcription.
We found that a TNBC cell line, MDA-MB-231, expressed KDM2A at a level comparable to that of MCF-7 cells and had the KDM2A-dependent mechanism to reduce rRNA transcription in response to mild glucose starvation (Fig. 7), showing that KDM2A-dependent regulation of rRNA transcription was not cell line specific. We detected KDM2A in breast cancer tissues, irrespective of ER and PR status and amplification of HER-2/Neu in all, including TNBC tissues (Fig. 8). Finally, we found that mild starvation resulted in reduction of cell proliferation of both MCF-7 and MDA-MB-231 cells and that a KDM2A knockdown suppressed the reduction (Fig. 9). The weak inhibition of Pol I activity, which reduced rRNA transcription to levels similar to that caused by mild starvation, suppressed cell proliferation (Fig. 9). From these results, we concluded that the reduction of rRNA transcription by KDM2A sensitively affects cell proliferation of breast cancer cells.
The reduction of intracellular ATP level might be a direct cause of the decreased cell proliferation, because ATP is required for almost all biological activities. In this scenario, the levels of ATP would be recovered by a KDM2A knockdown to recover cell proliferation. However, the reduction of the ATP levels by the 2DG treatments was not affected by a KDM2A knockdown 2 h after the addition of 2DG in MCF-7 cell (see Fig. S6A in the supplemental material). At 24 h after the addition of 2DG, the reductions in the cellular ATP levels by the 2 mM 2DG treatment were alleviated, irrespective of the presence or absence of a KDM2A knockdown (see Fig. S6B in the supplemental material). These results suggest that KDM2A does not affect the levels of ATP and that the reduction of cell proliferation in the presence of 2DG is not due to severe reduction of the ATP level. These results support our conclusion that regulation of rRNA transcription by KDM2A is involved in reduction of the proliferation of breast cancer cells.
At 2 and 24 h after the addition of 2DG, the activated AMPK level was high; this result was not affected by a KDM2A knockdown (see Fig. S6C in the supplemental material). The activated AMPK promotes ATP production by increasing the activity or the expression of proteins involved in catabolism (45). Eukaryotic cells express high levels of adenylate kinase, which catalyzes (2ADP ↔ ATP + AMP), and the decreasing energy status causes the adenylate kinase reaction move toward ATP and AMP production (45). Activated AMPK and/or adenylate kinase may be involved in avoiding a more severe decrease in cellular ATP levels 24 h after the addition of 2DG.
There are reports suggesting that KDM2A epigenetically regulates tumor progressions positively or negatively (31–33), which may depend on the cell type. Our results suggest that KDM2A has an antiproliferative activity under glucose starvation conditions. We also observed the reduction of cell proliferation by a KDM2A knockdown without glucose starvation in MCF-7 cells (Fig. 9), suggesting that KDM2A can positively influence cell proliferation. Previously, it was reported that the elevated expression of KDM2A promotes lung tumorigenesis by epigenetically enhancing ERK1/2 signaling (31). The activity of KDM2A enhancing ERK1/2 signaling may also be present in MCF-7 cells. These results suggest that KDM2A positively and negatively regulates cell proliferation even in one kind of cell line, depending on the environmental conditions. These bidirectional activities may explain why the expression of KDM2A in breast carcinomas remained relatively constant during carcinogenesis (Fig. 8). On the other hand, we hardly observed any reduction in cell proliferation in MDA-MB-231 cells by a KDM2A knockdown without glucose starvation (Fig. 9), and KDM2A appears to have only a negative effect on cell proliferation in this cell line. Identification of the cell types in which KDM2A has only a positive or negative effect on cell proliferation and xenograft experiments to measure the impact of KDM2A knockdown to the tumorigenesis in mice are required to use KDM2A as a molecular target in cancer therapy.
Our results demonstrated that KDM2A-mediated H3K36me2 demethylation is induced by AMPK under mild glucose starvation. The activated AMPK is believed to oppose the metabolic phenotypes favored by proliferating tumor cells, and compounds known to activate AMPK have been proposed as cancer therapeutics (53, 54). The antiproliferation activity of KDM2A induced under glucose starvation appears to contribute to the anti-tumor proliferation activity of AMPK. Further studies to clarify the mechanism by which glucose starvation induces the KDM2A-mediated H3K36me2 demethylation in the rDNA promoter and to develop a treatment that specifically induces H3K36me2 demethylation in the rDNA promoter would provide a novel therapy for cancers, including intractable TNBC (34).
Supplementary Material
ACKNOWLEDGMENTS
This study was supported by grants-in-aid from the Ministry of Education, Culture, Sports, Science, and Technology (MEXT) and the Japan Society for the Promotion of Science (JSPS) KAKENHI (Grant-in-Aid for Scientific Research C, 21570204 and 23770209; Grants-in-Aid for Young Scientists 23114721 and 25840011).
We thank Chihiro Kasahara and Shiori Yamada (Takasaki University of Health and Welfare) for technical assistance. We thank Kwesi Teye for reading the manuscript and helpful advice.
Footnotes
Supplemental material for this article may be found at http://dx.doi.org/10.1128/MCB.00579-15.
REFERENCES
- 1.Grummt I. 2003. Life on a planet of its own: regulation of RNA polymerase I transcription in the nucleolus. Genes Dev 17:1691–1702. doi: 10.1101/gad.1098503R. [DOI] [PubMed] [Google Scholar]
- 2.McStay B, Grummt I. 2008. The epigenetics of rRNA genes: from molecular to chromosome biology. Annu Rev Cell Dev Biol 24:131–157. doi: 10.1146/annurev.cellbio.24.110707.175259. [DOI] [PubMed] [Google Scholar]
- 3.Ruggero D, Pandolfi PP. 2003. Does the ribosome translate cancer? Nat Rev Cancer 3:179–192. doi: 10.1038/nrc1015. [DOI] [PubMed] [Google Scholar]
- 4.Grummt I. 2013. The nucleolus-guardian of cellular homeostasis and genome integrity. Chromosoma 122:487–497. doi: 10.1007/s00412-013-0430-0. [DOI] [PubMed] [Google Scholar]
- 5.Tanaka Y, Tsuneoka M. 2013. Control mechanisms of rRNA transcription. Seikagaku 85:852–860. (In Japanese.) [PubMed] [Google Scholar]
- 6.Grummt I, Langst G. 2013. Epigenetic control of RNA polymerase I transcription in mammalian cells. Biochim Biophys Acta 1829:393–404. doi: 10.1016/j.bbagrm.2012.10.004. [DOI] [PubMed] [Google Scholar]
- 7.Chedin S, Laferte A, Hoang T, Lafontaine DL, Riva M, Carles C. 2007. Is ribosome synthesis controlled by Pol I transcription? Cell Cycle 6:11–15. doi: 10.4161/cc.6.1.3649. [DOI] [PubMed] [Google Scholar]
- 8.Grewal SS, Evans JR, Edgar BA. 2007. Drosophila TIF-IA is required for ribosome synthesis and cell growth and is regulated by the TOR pathway. J Cell Biol 179:1105–1113. doi: 10.1083/jcb.200709044. [DOI] [PMC free article] [PubMed] [Google Scholar]
- 9.Laferte A, Favry E, Sentenac A, Riva M, Carles C, Chedin S. 2006. The transcriptional activity of RNA polymerase I is a key determinant for the level of all ribosome components. Genes Dev 20:2030–2040. doi: 10.1101/gad.386106. [DOI] [PMC free article] [PubMed] [Google Scholar]
- 10.Woods SJ, Hannan KM, Pearson RB, Hannan RD. 2015. The nucleolus as a fundamental regulator of the p53 response and a new target for cancer therapy. Biochim Biophys Acta 1849:821–829. doi: 10.1016/j.bbagrm.2014.10.007. [DOI] [PubMed] [Google Scholar]
- 11.Bywater MJ, Pearson RB, McArthur GA, Hannan RD. 2013. Dysregulation of the basal RNA polymerase transcription apparatus in cancer. Nat Rev Cancer 13:299–314. doi: 10.1038/nrc3496. [DOI] [PubMed] [Google Scholar]
- 12.Zhou Y, Schmitz KM, Mayer C, Yuan X, Akhtar A, Grummt I. 2009. Reversible acetylation of the chromatin remodeling complex NoRC is required for non-coding RNA-dependent silencing. Nat Cell Biol 11:1010–1016. doi: 10.1038/ncb1914. [DOI] [PubMed] [Google Scholar]
- 13.Xie W, Ling T, Zhou Y, Feng W, Zhu Q, Stunnenberg HG, Grummt I, Tao W. 2012. The chromatin remodeling complex NuRD establishes the poised state of rRNA genes characterized by bivalent histone modifications and altered nucleosome positions. Proc Natl Acad Sci U S A 109:8161–8166. doi: 10.1073/pnas.1201262109. [DOI] [PMC free article] [PubMed] [Google Scholar]
- 14.Tanaka Y, Okamoto K, Teye K, Umata T, Yamagiwa N, Suto Y, Zhang Y, Tsuneoka M. 2010. JmjC enzyme KDM2A is a regulator of rRNA transcription in response to starvation. EMBO J 29:1510–1522. doi: 10.1038/emboj.2010.56. [DOI] [PMC free article] [PubMed] [Google Scholar]
- 15.Stefanovsky V, Langlois F, Gagnon-Kugler T, Rothblum LI, Moss T. 2006. Growth factor signaling regulates elongation of RNA polymerase I transcription in mammals via UBF phosphorylation and r-chromatin remodeling. Mol Cell 21:629–639. doi: 10.1016/j.molcel.2006.01.023. [DOI] [PubMed] [Google Scholar]
- 16.Stefanovsky VY, Pelletier G, Hannan R, Gagnon-Kugler T, Rothblum LI, Moss T. 2001. An immediate response of ribosomal transcription to growth factor stimulation in mammals is mediated by ERK phosphorylation of UBF. Mol Cell 8:1063–1073. doi: 10.1016/S1097-2765(01)00384-7. [DOI] [PubMed] [Google Scholar]
- 17.Zhao J, Yuan X, Frodin M, Grummt I. 2003. ERK-dependent phosphorylation of the transcription initiation factor TIF-IA is required for RNA polymerase I transcription and cell growth. Mol Cell 11:405–413. doi: 10.1016/S1097-2765(03)00036-4. [DOI] [PubMed] [Google Scholar]
- 18.Wu A, Tu X, Prisco M, Baserga R. 2005. Regulation of upstream binding factor 1 activity by insulin-like growth factor I receptor signaling. J Biol Chem 280:2863–2872. doi: 10.1074/jbc.M406138200. [DOI] [PubMed] [Google Scholar]
- 19.Claypool JA, French SL, Johzuka K, Eliason K, Vu L, Dodd JA, Beyer AL, Nomura M. 2004. Tor pathway regulates Rrn3p-dependent recruitment of yeast RNA polymerase I to the promoter but does not participate in alteration of the number of active genes. Mol Biol Cell 15:946–956. doi: 10.1091/mbc.E03-08-0594. [DOI] [PMC free article] [PubMed] [Google Scholar]
- 20.Hannan KM, Brandenburger Y, Jenkins A, Sharkey K, Cavanaugh A, Rothblum L, Moss T, Poortinga G, McArthur GA, Pearson RB, Hannan RD. 2003. mTOR-dependent regulation of ribosomal gene transcription requires S6K1 and is mediated by phosphorylation of the carboxy-terminal activation domain of the nucleolar transcription factor UBF. Mol Cell Biol 23:8862–8877. doi: 10.1128/MCB.23.23.8862-8877.2003. [DOI] [PMC free article] [PubMed] [Google Scholar]
- 21.Mayer C, Zhao J, Yuan X, Grummt I. 2004. mTOR-dependent activation of the transcription factor TIF-IA links rRNA synthesis to nutrient availability. Genes Dev 18:423–434. doi: 10.1101/gad.285504. [DOI] [PMC free article] [PubMed] [Google Scholar]
- 22.Hoppe S, Bierhoff H, Cado I, Weber A, Tiebe M, Grummt I, Voit R. 2009. AMP-activated protein kinase adapts rRNA synthesis to cellular energy supply. Proc Natl Acad Sci U S A 106:17781–17786. doi: 10.1073/pnas.0909873106. [DOI] [PMC free article] [PubMed] [Google Scholar]
- 23.Jenuwein T, Allis CD. 2001. Translating the histone code. Science 293:1074–1080. doi: 10.1126/science.1063127. [DOI] [PubMed] [Google Scholar]
- 24.Bierhoff H, Dammert MA, Brocks D, Dambacher S, Schotta G, Grummt I. 2014. Quiescence-induced LncRNAs trigger H4K20 trimethylation and transcriptional silencing. Mol Cell 54:675–682. doi: 10.1016/j.molcel.2014.03.032. [DOI] [PubMed] [Google Scholar]
- 25.Hojfeldt JW, Agger K, Helin K. 2013. Histone lysine demethylases as targets for anticancer therapy. Nat Rev Drug Discov 12:917–930. doi: 10.1038/nrd4154. [DOI] [PubMed] [Google Scholar]
- 26.Helin K, Dhanak D. 2013. Chromatin proteins and modifications as drug targets. Nature 502:480–488. doi: 10.1038/nature12751. [DOI] [PubMed] [Google Scholar]
- 27.Kustatscher G, Ladurner AG. 2007. Modular paths to ‘decoding’ and ‘wiping’ histone lysine methylation. Curr Opin Chem Biol 11:628–635. doi: 10.1016/j.cbpa.2007.09.011. [DOI] [PubMed] [Google Scholar]
- 28.Stavropoulos P, Hoelz A. 2007. Lysine-specific demethylase 1 as a potential therapeutic target. Expert Opin Ther Targets 11:809–820. doi: 10.1517/14728222.11.6.809. [DOI] [PubMed] [Google Scholar]
- 29.Tsukada Y, Fang J, Erdjument-Bromage H, Warren ME, Borchers CH, Tempst P, Zhang Y. 2006. Histone demethylation by a family of JmjC domain-containing proteins. Nature 439:811–816. doi: 10.1038/nature04433. [DOI] [PubMed] [Google Scholar]
- 30.Kawakami E, Tokunaga A, Ozawa M, Sakamoto R, Yoshida N. 2014. The histone demethylase fbxl11/kdm2a plays an essential role in embryonic development by repressing cell-cycle regulators. Mech Dev 135:31–42. doi: 10.1016/j.mod.2014.10.001. [DOI] [PubMed] [Google Scholar]
- 31.Wagner KW, Alam H, Dhar SS, Giri U, Li N, Wei Y, Giri D, Cascone T, Kim JH, Ye Y, Multani AS, Chan CH, Erez B, Saigal B, Chung J, Lin HK, Wu X, Hung MC, Heymach JV, Lee MG. 2013. KDM2A promotes lung tumorigenesis by epigenetically enhancing ERK1/2 signaling. J Clin Invest 123:5231–5246. doi: 10.1172/JCI68642. [DOI] [PMC free article] [PubMed] [Google Scholar]
- 32.Frescas D, Guardavaccaro D, Kuchay SM, Kato H, Poleshko A, Basrur V, Elenitoba-Johnson KS, Katz RA, Pagano M. 2008. KDM2A represses transcription of centromeric satellite repeats and maintains the heterochromatic state. Cell Cycle 7:3539–3547. doi: 10.4161/cc.7.22.7062. [DOI] [PMC free article] [PubMed] [Google Scholar]
- 33.Cheng Z, Cheung P, Kuo AJ, Yukl ET, Wilmot CM, Gozani O, Patel DJ. 2014. A molecular threading mechanism underlies Jumonji lysine demethylase KDM2A regulation of methylated H3K36. Genes Dev 28:1758–1771. doi: 10.1101/gad.246561.114. [DOI] [PMC free article] [PubMed] [Google Scholar]
- 34.Chavez KJ, Garimella SV, Lipkowitz S. 2010. Triple negative breast cancer cell lines: one tool in the search for better treatment of triple negative breast cancer. Breast Dis 32:35–48. [DOI] [PMC free article] [PubMed] [Google Scholar]
- 35.Tanaka Y, Umata T, Okamoto K, Obuse C, Tsuneoka M. 2014. CxxC-ZF domain is needed for KDM2A to demethylate histone in rDNA promoter in response to starvation. Cell Struct Funct 39:79–92. doi: 10.1247/csf.13022. [DOI] [PubMed] [Google Scholar]
- 36.Dydensborg AB, Herring E, Auclair J, Tremblay E, Beaulieu JF. 2006. Normalizing genes for quantitative RT-PCR in differentiating human intestinal epithelial cells and adenocarcinomas of the colon. Am J Physiol Gastrointest Liver Physiol 290:G1067–G1074. [DOI] [PubMed] [Google Scholar]
- 37.Imamura H, Nhat KP, Togawa H, Saito K, Iino R, Kato-Yamada Y, Nagai T, Noji H. 2009. Visualization of ATP levels inside single living cells with fluorescence resonance energy transfer-based genetically encoded indicators. Proc Natl Acad Sci U S A 106:15651–15656. doi: 10.1073/pnas.0904764106. [DOI] [PMC free article] [PubMed] [Google Scholar]
- 38.Kardash E, Bandemer J, Raz E. 2011. Imaging protein activity in live embryos using fluorescence resonance energy transfer biosensors. Nat Protoc 6:1835–1846. doi: 10.1038/nprot.2011.395. [DOI] [PubMed] [Google Scholar]
- 39.Ishizaki H, Yano H, Tsuneoka M, Ogasawara S, Akiba J, Nishida N, Kojiro S, Fukahori S, Moriya F, Matsuoka K, Kojiro M. 2007. Overexpression of the myc target gene Mina53 in advanced renal cell carcinoma. Pathol Int 57:672–680. doi: 10.1111/j.1440-1827.2007.02156.x. [DOI] [PubMed] [Google Scholar]
- 40.Allred DC, Harvey JM, Berardo M, Clark GM. 1998. Prognostic and predictive factors in breast cancer by immunohistochemical analysis. Mod Pathol 11:155–168. [PubMed] [Google Scholar]
- 41.Theriault RL, Carlson RW, Allred C, Anderson BO, Burstein HJ, Edge SB, Farrar WB, Forero A, Giordano SH, Goldstein LJ, Gradishar WJ, Hayes DF, Hudis CA, Isakoff SJ, Ljung BM, Mankoff DA, Marcom PK, Mayer IA, McCormick B, Pierce LJ, Reed EC, Schwartzberg LS, Smith ML, Soliman H, Somlo G, Ward JH, Wolff AC, Zellars R, Shead DA, Kumar R. 2013. Breast cancer, version 3.2013: featured updates to the NCCN guidelines. J Natl Compr Canc Netw 11:753–761. [DOI] [PMC free article] [PubMed] [Google Scholar]
- 42.Pelicano H, Martin DS, Xu RH, Huang P. 2006. Glycolysis inhibition for anticancer treatment. Oncogene 25:4633–4646. doi: 10.1038/sj.onc.1209597. [DOI] [PubMed] [Google Scholar]
- 43.Weindruch R, Keenan KP, Carney JM, Fernandes G, Feuers RJ, Floyd RA, Halter JB, Ramsey JJ, Richardson A, Roth GS, Spindler SR. 2001. Caloric restriction mimetics: metabolic interventions. J Gerontol A Biol Sci Med Sci 56 Spec No 1:20–33. [DOI] [PubMed] [Google Scholar]
- 44.Hardie DG, Ross FA, Hawley SA. 2012. AMP-activated protein kinase: a target for drugs both ancient and modern. Chem Biol 19:1222–1236. doi: 10.1016/j.chembiol.2012.08.019. [DOI] [PMC free article] [PubMed] [Google Scholar]
- 45.Hardie DG, Ross FA, Hawley SA. 2012. AMPK: a nutrient and energy sensor that maintains energy homeostasis. Nat Rev Mol Cell Biol 13:251–262. doi: 10.1038/nrm3311. [DOI] [PMC free article] [PubMed] [Google Scholar]
- 46.Kahn BB, Alquier T, Carling D, Hardie DG. 2005. AMP-activated protein kinase: ancient energy gauge provides clues to modern understanding of metabolism. Cell Metab 1:15–25. doi: 10.1016/j.cmet.2004.12.003. [DOI] [PubMed] [Google Scholar]
- 47.Zhou G, Myers R, Li Y, Chen Y, Shen X, Fenyk-Melody J, Wu M, Ventre J, Doebber T, Fujii N, Musi N, Hirshman MF, Goodyear LJ, Moller DE. 2001. Role of AMP-activated protein kinase in mechanism of metformin action. J Clin Invest 108:1167–1174. doi: 10.1172/JCI13505. [DOI] [PMC free article] [PubMed] [Google Scholar]
- 48.Drygin D, Lin A, Bliesath J, Ho CB, O'Brien SE, Proffitt C, Omori M, Haddach M, Schwaebe MK, Siddiqui-Jain A, Streiner N, Quin JE, Sanij E, Bywater MJ, Hannan RD, Ryckman D, Anderes K, Rice WG. 2011. Targeting RNA polymerase I with an oral small molecule CX-5461 inhibits rRNA synthesis and solid tumor growth. Cancer Res 71:1418–1430. doi: 10.1158/0008-5472.CAN-10-1728. [DOI] [PubMed] [Google Scholar]
- 49.Ducommun S, Deak M, Sumpton D, Ford RJ, Nunez Galindo A, Kussmann M, Viollet B, Steinberg GR, Foretz M, Dayon L, Morrice NA, Sakamoto K. 2015. Motif affinity and mass spectrometry proteomic approach for the discovery of cellular AMPK targets: identification of mitochondrial fission factor as a new AMPK substrate. Cell Signal 27:978–988. doi: 10.1016/j.cellsig.2015.02.008. [DOI] [PubMed] [Google Scholar]
- 50.Tuerk RD, Thali RF, Auchli Y, Rechsteiner H, Brunisholz RA, Schlattner U, Wallimann T, Neumann D. 2007. New candidate targets of AMP-activated protein kinase in murine brain revealed by a novel multidimensional substrate-screen for protein kinases. J Proteome Res 6:3266–3277. doi: 10.1021/pr070160a. [DOI] [PubMed] [Google Scholar]
- 51.Klaus A, Polge C, Zorman S, Auchli Y, Brunisholz R, Schlattner U. 2012. A two-dimensional screen for AMPK substrates identifies tumor suppressor fumarate hydratase as a preferential AMPKalpha2 substrate. J Proteomics 75:3304–3313. doi: 10.1016/j.jprot.2012.03.040. [DOI] [PubMed] [Google Scholar]
- 52.Moon S, Han D, Kim Y, Jin J, Ho WK. 2014. Interactome analysis of AMP-activated protein kinase (AMPK)-α1 and -β1 in INS-1 pancreatic beta-cells by affinity purification-mass spectrometry. Sci Rep 4:4376. [DOI] [PMC free article] [PubMed] [Google Scholar]
- 53.Pernicova I, Korbonits M. 2014. Metformin: mode of action and clinical implications for diabetes and cancer. Nat Rev Endocrinol 10:143–156. doi: 10.1038/nrendo.2013.256. [DOI] [PubMed] [Google Scholar]
- 54.Vincent EE, Coelho PP, Blagih J, Griss T, Viollet B, Jones RG. 2015. Differential effects of AMPK agonists on cell growth and metabolism. Oncogene 34:3627–3639. doi: 10.1038/onc.2014.301. [DOI] [PMC free article] [PubMed] [Google Scholar]
Associated Data
This section collects any data citations, data availability statements, or supplementary materials included in this article.