Abstract
The spatial distribution of theaflavin and thearubigin fractions and their impact on black tea quality were investigated using multivariate and geostatistics techniques. Black tea samples were collected from tea gardens of six geographical regions of Assam and West Bengal, India. Total theaflavin (TF) and its four fractions of upper Assam, south bank and North Bank teas were higher than the other regions. Simple theaflavin showed highest significant correlation with tasters’ quality. Low molecular weight thearubigins of south bank and North Bank were significantly higher than other regions. Total thearubigin (TR) and its fractions revealed significant positive correlation with tasters’ organoleptic valuations. Tea tasters’ parameters were significantly and positively correlated with each other. The semivariogram for quality parameters were best represented by gaussian models. The nugget/sill ratio indicated a strong/moderate spatial dependence of the studied parameters. Spatial variation of tea quality parameters may be used for quality assessment in the tea growing areas of India.
Keywords: Black tea, Theaflavins, Thearubigins, Geostatistics, North-East India
Introduction
Tea is a heterogeneous plant with many morphological and physiological overlappings and its quality is determined by genetic factors based on morphological characters and biochemical compositions (Roberts 1962). The environmental factors such as temperature, rainfall, altitude and soil, and cultural practices such as plucking, pruning, shade and use of fertilizer influences the quality of black tea (Bhuyan et al. 2009; Owuor and Obanda 1998; Carloni et al. 2013).
The variability of total as well as the fractions of TF and TR of different regions may be attributed to factors such as type of cultivar, environment, soil and method of processing. The characteristic quality attributes of black tea are theaflavins (TF) and thearubigins (TR), which are largely responsible for briskness, brightness, strength and colour (Biswas and Sarkar 1973; Yang and Liu 2013). TFs and TRs are formed by enzymatic oxidation of catechins and their gallates during the fermentation/oxidation stage of tea processing. The four major theaflavins formed from different catechins are simple theaflavin [Epigallocatechin (EGC) + Epicatechin (EC)], theaflavin-3-gallate [Epigallocatechingallate (EGCG) + EC], theaflavin-3´-gallate [EGC + Epicatechingallate (ECG)] and theaflavin-3–3´-digallate [EGCG + ECG] (Robertson 1992). Astringency is a tactile sensation perceived through tongue elicited primarily by flavanol polymers (Lesschceve and Noble Lesschceve 2005). Astringency is described sensorially as a puckering or drying mouthfeel. Monomers, dimmers and trimers of flavan-3-ol i.e. the theaflavins gallates in tea have been shown to elicit the sensation of astringency. This may arise due to formation of unprecipitated complexes with saliva proteins. The TF fractions have vast differences in their astringency levels (Olmez and Yilmaz 2010). The relative astringency levels of four predominant TFs, viz. theaflavin-3,3′-digallate (TF4), theaflavin-3′-gallate (TF3), theaflavin- 3-gallate (TF2), and simple theaflavin (TF1) in black tea were found to be 6.4, 2.2, 2.2 and 1, respectively (Owuor et al. 2006). More gallate content in the TF means more astringency. An astringency normalisation factor, the theaflavin digallate equivalent (TDE), is more relevant than the individual TFs. It takes into account the astringency levels of individual TFs in black tea (Owuor and Obanda 2007).
TRs are polymeric compounds derived from polyphenols and their structures are still not well elucidated. TRs are thought to be formed from TFs; therefore, prolonged oxidation during fermentation results in less TFs and more TRs (Robertson 1992). Considering polarity/molecular weight, Roberts and Smith (1963) separated TRs into two large groups, viz. low molecular weight TRs (TRSI) and high molecular weight TRs (TRSII). TRs contribute about 35 % of total colour. It is responsible for taste, tone of colour, body and strength of the brew.
Total soluble solid (TSS) is an important physico-chemical parameter of black tea quality (Bhuyan et al. 2009) and has been regarded as an international standard for quality control (Yao et al. 2006). TSS consists of several biochemical compounds such as polyphenols, sugars, caffeine, amino acids and minerals (Harbowy and Balentine 1997; Wood et al. 1964). A high content of TSS in brew is an indication of good quality (Wood et al. 1964).
Geostatistical methods are applied to study spatial variability of the different properties of soil, sediment etc. (Goovaerts 1997; Santra et al. 2012). Geostatistics is based on the theory of a regionalized variable (Burgos et al. 2006), which is distributed in space (with spatial coordinates) and shows spatial autocorrelation such that samples close together in space are more alike than those that are farther apart. The geostatistical approach consists of two parts: one is the calculation of an experimental variogram from the data and the model fitting and the second is the estimation or prediction at unsampled locations. A variogram (or semi-variogram) is used to measure the spatial variability of a regionalized variable and provides the input parameters for the spatial interpolation of variogram kriging (Webster and Oliver 2001). Among the several estimation methods, kriging is the most popular (Santra et al. 2008). Kriging is not just used to estimate unsampled areas; it is also used to build probabilistic models of uncertainty about the unknown but estimated predicted values (Burgos et al. 2006). The kriging estimates can be mapped to reveal the overall trend of data. Maps provide helpful visual displays of the spatial variability in the field and can be used for the summarization and representation of soil properties where natural hazards can be identified (Goovaerts 1997).
Studies have shown that the black tea quality is influenced by many factors such as season and altitude, genetic make-up of the plant (Owuor and Obanda 1995) and the region of production and climate (Owuor et al. 2008). The formation of theaflavins depends upon geographical areas of production and genetic variations of cultivar. Theaflavins formation is also dependent upon the environmental conditions (McDowell et al. 1991). Roberts (1962) reported a very good correlation of theaflavins with high cash value of CTC black tea. Tea composition and also the taste and aroma vary with climate, soil, cultural practices, cultivar (variety), season etc. (Sarmah and Rao 2009). Significant relationship between theaflavins and tasters’ quality was established for Kenyan tea (Owuor et al. 2006). The relationship of theaflavins and thearubigins with tasters’ quality was reported for black tea from the geographical regions of Northeast India (Bhuyan et al. 2009, 2013). For assessing tea quality, the use of TF fractions is more appropriate than the use of total TF content. This is because of (a) the contribution of TF to astringency of the tea brew varies with the extent of galloylation of TF and (b) the relative abundance of TF, TF-monogallates (TFMG) and TF-digallate (TFDG) in the tea brew (Muthumani and Senthil Kumar 2007). Organoleptic evaluation of tea is a vital process to correlate the effects of biochemical components for assessment of quality. Evaluation is carried out by skilled and experienced tasters who determine the market value of tea on a purely subjective basis. Four important liquor characteristics of brew are brightness, briskness, strength and quality. The study of individual theaflavins or thearubigins and their relationship with tea tasters’ quality is limited. To the best of our knowledge there is no reported data on spatial distribution of black tea quality parameters from the regions of Northeast India. Therefore, under this study an attempt was made to understand the impact of individual theaflavins and thearubigin fractions on black tea quality. Statistical and geostatistical methods were used in order to reveal the spatial distribution and the relation between the variables determined in soil.
Materials and methods
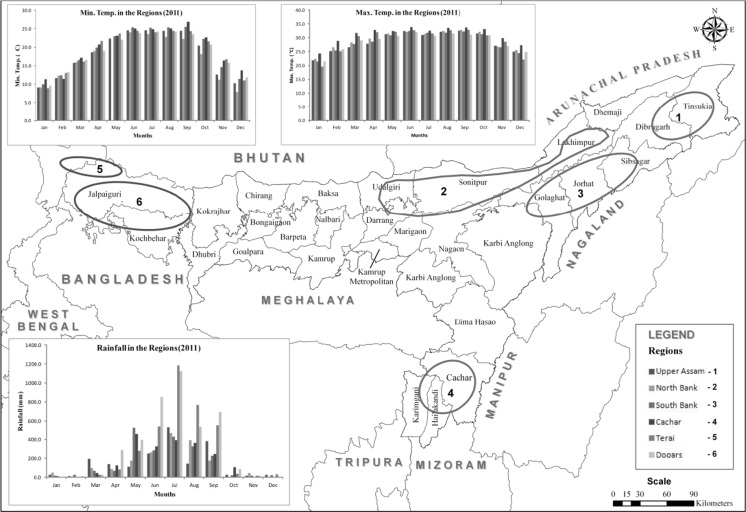
A total of 102 CTC (crush, tear and curl) black tea samples were collected from commercial gardens of six tea producing regions of Assam (upper Assam, south bank, North Bank and Barak valley) and West Bengal (Dooars and Terai), India (Fig. 1).
Fig. 1.
Locations of Study Areas: (1) Upper Assam, (2) North Bank, (3) South Bank and (4) Barak valley from Assam, (5) Terai and (6) Dooars from West Bengal, India
Total theaflavins, total thearubigins and thearubigin fractions were determined by spectrophotometric method (Ullah et al. 1984; Obanda et al. 2001). Theaflavin profiles were identified and estimated by using HPLC method (Opie et al. 1990; Sabhapondit et al. 2014). Total soluble solids (TSS) were estimated by the method IS 13862 1999.
The tasters’ sensory (organoleptic) evaluation was performed as described by Bhuyan et al. (2009).
Statistical and geostatistical analysis
Statistical analyses such as principal component analysis (PCA) and analysis of variance (ANOVA) were done using SPSS statistical package. ANOVA and least significant difference (LSD) tests were carried out to evaluate differences between the variables. A Pearson-correlation analysis was carried out to check the significances of the linear relations between the obtained variables.
The characterization data were analyzed through PCA using factor extraction with an eigenvalue >1 and varimax rotation. All data were log-transformed to achieve closeness to normal distribution and all the variables were standardized by ‘z-score’ analysis to measure the similarity between the samples. Furthermore, we performed factor score analysis to understand the source relevance of black tea samples collected from six different regions. The raw data were used for graphical presentation (Box-Whisker diagram), whereas the transformed (log-transformed and standardized) ones were used for factor analysis (principal components analysis).
In this study, omnidirectional semivariogram was prepared for each biochemical property because no significant directional trend was observed. Then, the variogram plots were fitted to a theoretical model, such as spherical, exponential, linear or Gaussian models. The geostatistical software GS+ version 9 was used for fitting the appropriate semivariogram model to each data set. Best-fit model with smallest nugget values with minimum root mean square error (RMSE) and root mean square standardized (prediction) errors (RMSSE) close to 1 were selected for each measured parameter. Finally, the cross-validation method was applied to validate the parameters of the model (Goovaerts 1997). Using the model semivariogram, basic spatial parameters such as nugget (Co) and partial sill (C + Co) were calculated. Nugget is the variance at zero distance; partial sill is the lag distance between measurements at which one value for a variable does not influence neighbouring values ( Lopez-Granadoset et al. Lopez-Granados et al. 2002). Geostatistical analysis consisting of variogram calculation, kriging, cross-validation, and mapping was performed using the GS+ software.
Results and discussion
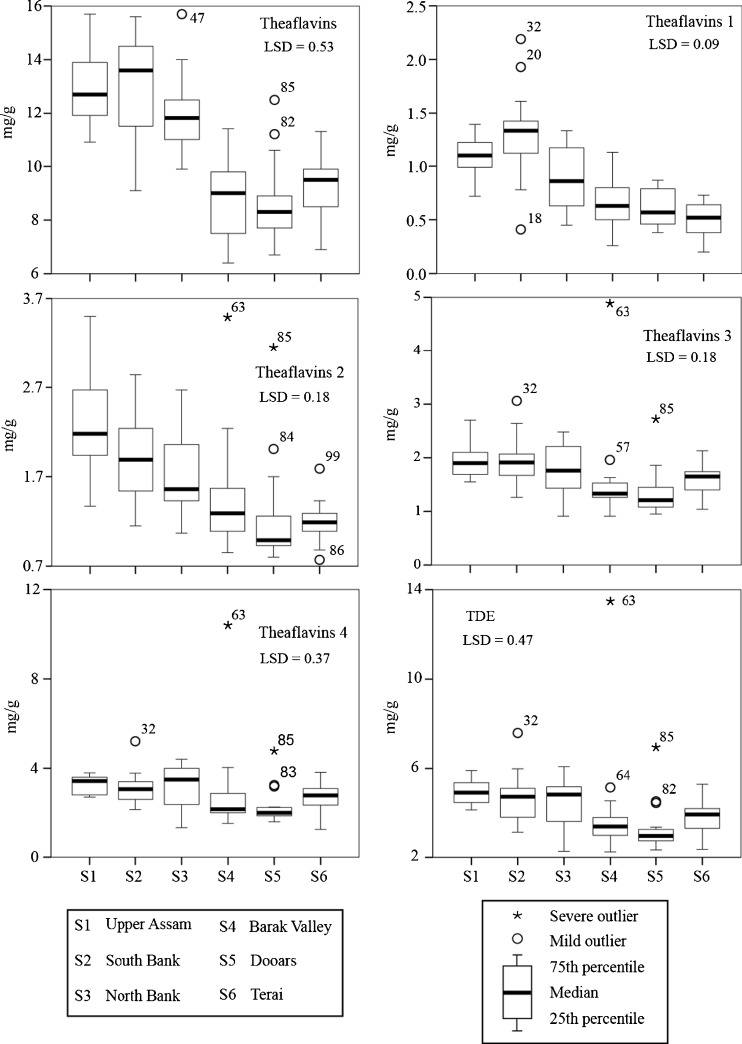
Total TF and its four major fractions [simple theaflavin, theaflavin-3-gallate, theaflavin-3´-gallate and theaflavin-3–3´-digallate] of CTC black teas of the six tea growing regions of Assam and West Bengal, India are presented in Fig. 2. Total TF contents of upper Assam, south bank and North Bank teas were distinctly higher than other regions. These three regions of Brahmaputra valley are situated in similar geographical and climatic zones. Because of similarity in their soil status, distribution of TF is also similar (Bhuyan et al. 2013). The increasing or decreasing trends of four TFs of the regions were not similar. Simple TF (TF1) was found to be highest in South bank region tea followed by upper Assam, North Bank, Barak valley, Dooars and Terai. A significant variation in TF2 was observed between the regions and was found highest in upper Assam tea and lowest in Terai region tea. The variations in TF3 and TF4 between the regions were less in comparison to TF1 and TF2. The variation was also similar among the regions except North Bank. Although the variation of TF3 and TF4 between the regions was not highly significant, these two components were found to be the highest in upper Assam and south bank followed by the North Bank, Barak valley, Terai and Dooars. Of the four major TFs, the amount of theaflavin-3–3´-digallate (TF4) was the highest and simple theaflavin (TF1) was the lowest. Owuor et al. (2006) reported the astringency level of TF4 to be 6.4 times and TF3 and TF2 2.2 times more than TF1.The level of astringency and/or briskness is usually associated with simple theaflavin, theaflavin-digalate equivalent and unoxidised catechins (Ding et al. 1992). In our study it was observed that significant level of tasters’ brightness, briskness, strength and quality was more in TF1 which was in conformity with earlier observations (Ding et al. 1992). As per tasters’ evaluation the impact on quality of TF fractions was in the order of TF1 > TF2 > TF3 > TF4.
Fig. 2.
Theaflavin fractions and TDE of Black Tea from different sampling sites (LSD = least significant difference at 5 % level)
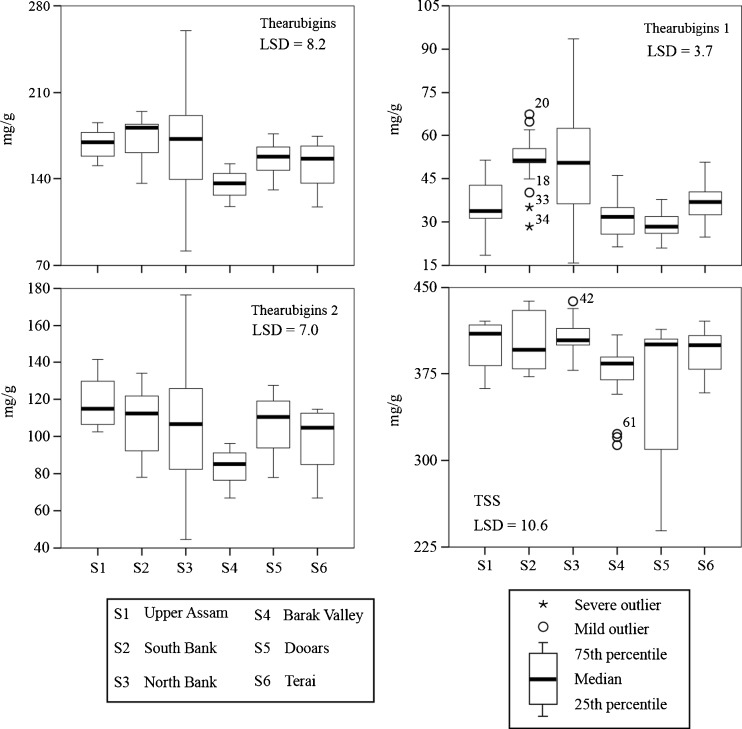
Total thearubigins (TR), their fractions i.e., low molecular weight TR (TR1) and high molecular weight TR (TR2) and total soluble solid (TSS) of CTC black tea of upper Assam, south bank, North Bank, Barak valley, Dooars and Terai regions are presented in Fig. 3. Like total TF, total TR contents of upper Assam, south bank and North Bank regions teas were higher than those in teas from other three regions. Low molecular weight TR (TR1) was found to be highest in south bank followed by North Bank, Terai, upper Assam, Barak valley and Dooars. High molecular weight TR (TR2) of upper Assam, south bank, North Bank, Dooars and Terai regions tea were comparable. Barak valley tea contained the lowest (mean 83.48 mg/g) among the regions.
Fig. 3.
Thearubigin fractions and TSS of Black Tea from different sampling sites (LSD = least significant difference at 5 % level)
The individual TFs have different astringencies. TF-3, 3́-digallate is 6.4 times, TF-3-gallate and TF-3́-gallate are 2.22 times more astringent than TF1. TDE was calculated from the following equation (Owuor et al. 2006):
TDE in black teas from upper Assam, south bank and North Bank regions was higher than TDE in teas from the other three regions (Fig. 2). TDE in black tea followed the same trend as of TF fractions. Correlation between the studied parameters showed that TF and its fractions had significant positive correlation with organoleptic parameters (Table 1). This result was well corroborated with the earlier studies (Owuor et al. 2006). Organoleptic parameters were also better correlated with TFs and TF fractions as compared to TDE. So, unlike central African tea, TDE is not the most appropriate parameter to determine the Indian black tea quality.
Table 1.
Correlation coefficient among biochemical parameters and tasters’ quality (n = 102)
| Parameters | TF | TR | TR1 | TR2 | TSS | TF1 | TF2 | TF3 | TF4 | TDE |
|---|---|---|---|---|---|---|---|---|---|---|
| TR | 0.59** | |||||||||
| TR1 | 0.49** | 0.61** | ||||||||
| TR2 | 0.50** | 0.92** | 0.40** | |||||||
| TSS | 0.57** | 0.38** | 0.33** | 0.36** | ||||||
| TF1 | 0.81** | 0.53** | 0.45** | 0.45** | 0.48** | |||||
| TF2 | 0.74** | 0.36** | 0.25** | 0.31** | 0.34** | 0.59** | ||||
| TF3 | 0.61** | 0.42** | 0.38** | 0.34** | 0.35** | 0.47** | 0.78** | |||
| TF4 | 0.53** | 0.40** | 0.39** | 0.31** | 0.36** | 0.38** | 0.60** | 0.89** | ||
| TDE | 0.63** | 0.43** | 0.41** | 0.35** | 0.39** | 0.48** | 0.73** | 0.95** | 0.98** | |
| Brightness | 0.60** | 0.47** | 0.46** | 0.44** | 0.46** | 0.60** | 0.42** | 0.28** | 0.23* | 0.30** |
| Briskness | 0.54** | 0.45** | 0.43** | 0.39** | 0.45** | 0.54** | 0.38** | 0.24* | 0.18 | 0.25** |
| Strength | 0.60** | 0.50** | 0.46** | 0.47** | 0.51** | 0.56** | 0.43** | 0.28** | 0.22* | 0.30** |
| Quality | 0.58** | 0.50** | 0.45** | 0.47** | 0.49** | 0.54** | 0.43** | 0.30** | 0.23* | 0.30** |
*Significant at 5 % level; **significant at 1 % level
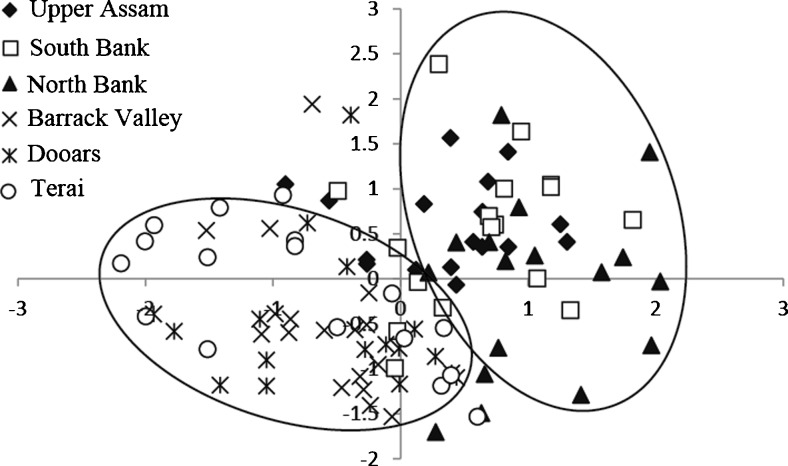
Factor scores, calculated using factor loading matrix, represent relative intensities of each factor (Fig. 4). The tea samples from upper Assam, North Bank, and south bank showed the highest factor 1 and factor 2 scores, indicating the high contents of theaflavins, thearubigins and their fractions. Tea samples from Barak Valley, Terai, and Dooars regions showed the lowest scores for factor 1 and factor 2, indicating lower theaflavin and thearubigin fractions. Upper Assam, North Bank and South bank are situated in geographically and climatically similar regions. Apart from these two factors, similar soil conditions are also responsible for better tea quality (Bhuyan et al. 2013). Comparable theaflavins and thearubigin and their fractions of the Terai region and Barak valley are due to their similar climatic conditions although they are far apart from each other. Even though Dooars is nearer to the Terai region, different climatic conditions of these two regions are reflected in the tea qualities. (Mcdowell et al. 1991; Owuor et al. 2006, 2010).
Fig. 4.
A bi-plot factor score for each site
The levels of total soluble solid (TSS) of upper Assam teas (399.35 mg/g) was comparable with the other regions like south bank (mean 404.72 mg/g), North Bank (mean 406.88 mg/g), Barak valley (mean 373.91), Dooars (mean 368.84) and Terai regions (mean 394.81 mg/g) teas (Fig. 3). The TSS contents of black teas of all the regions were more than 320.00 mg/g, the minimum value of PFA (Prevention of Food Adulteration) act, below which teas become substandard (Venkatesan and Ganapathy 2004). The variation in TSS of the samples depends mainly on the amount of chemical constituents present in green leaf and processing system. High amount of TSS in tea is an indication of good quality (Wood et al. 1964).
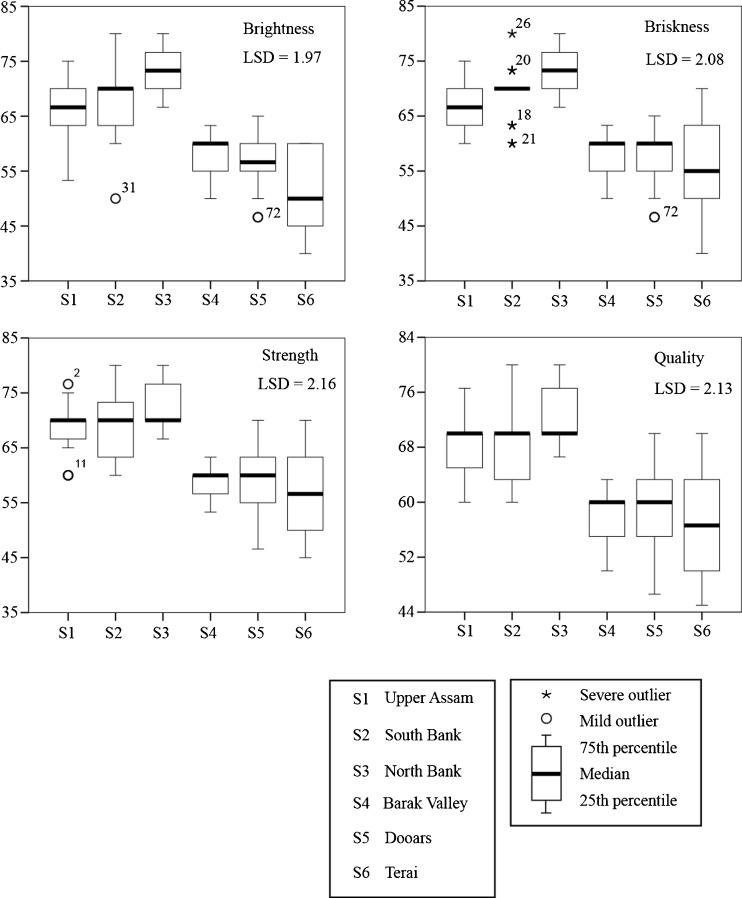
The organoleptic evaluations (10–100 scale basis) of black tea from upper Assam, south bank, North Bank, Barak valley, Dooars and Terai are presented in Fig. 5. A distinct variation in all the tasters’ parameters of Brahmaputra valley teas with other regions was observed. Tasters’ organoleptic valuations of the regions of Brahmaputra valley i.e., upper Assam (mean 67.83), south bank (mean 68.42) and North Bank (mean 72.91) were comparable and found to be higher than the teas of Barak valley (mean 57.82), Dooars (mean 58.32) and Terai (mean 56.55) regions. The correlations between biochemical components and tasters’ parameters are presented in Table 1. Quality of tea as characterised by tea tasters is the masking effect of biochemicals present in tea, out of which theaflavins and thearubigins are largely responsible for brightness, briskness and strength (Bhuyan et al. 2009). All the analysed biochemical components showed significant positive correlations with tasters’ observations. Among the TF fractions TF1 showed highest significant positive correlation with all the four parameters of tea tasters followed by TF2, TF3 and TF4. No distinct variation in the levels of significance between low molecular weight TR and high molecular weight TR was observed. Although both TF and TR showed positive correlations with tasters’ brightness, briskness, strength and quality, the impact of theaflavins was more than thearubigins. Linear correlation analysis showed that there were significant linear relationships between the individual tea quality attributes, and the total quality score was significantly correlated to the individual tea quality attributes (Table 1). This suggests that a good tea should have good individual quality attributes.
Fig. 5.
Tasters’ evaluation of processed Black Tea from different sampling sites (LSD = least significant difference at 5 % level)
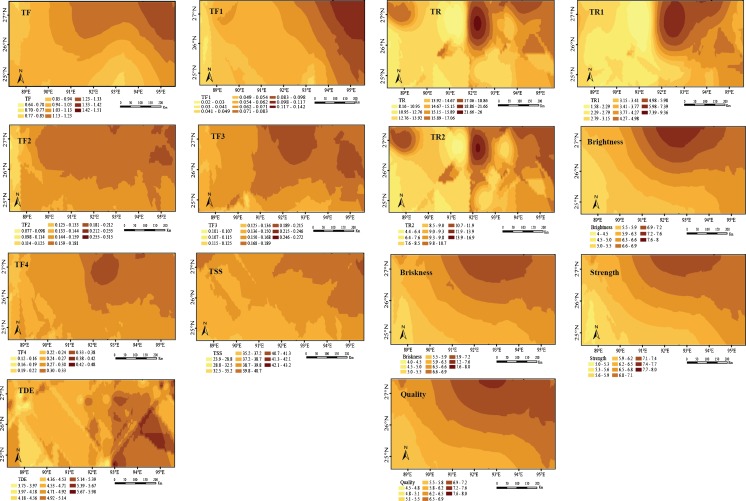
Spatial distribution of tea quality parameters such as theaflavins, thearubigins and organoleptic parameters were carried out through geostatistical techniques. Ordinary Kriging was used to obtain the spatial distribution of tea quality parameters over the area. The distribution map clearly reveals that the tea quality of upper Assam, North Bank and south bank area are better compared to other tea growing areas with respect to the measured quality parameter (Fig. 6). Table 2 represents characteristic parameters of best fitted semivariogram models of tea quality parameters in the regions of study area. Semivariograms showed a lower nugget effect on TF, TR faction and organoleptic properties of black tea, indicating that the sampling density was adequate to reveal the spatial structures (Burgos et al. 2006). The results showed that the TF, TF1, TF3, TF4, TR fractions (TR1 and TR2), TDE and TSS semivariograms were well described with the Gaussian model, while the TF2 semivariogram was well described with the exponential model. In the semivariogarm analysis, the nugget values represented the variability of measured parameters at zero distance, which were positive in this study for all the parameters. This spatial random variance is caused by the artificial nature of tea quality; meaning that anthropogenic inputs like tea variety and tea processing conditions play a significant role in the tea quality. The sill and the sum of partial sill and nugget, showed the maximum variance between data pairs that reflected the variations of regionalized variables in the study area. The ratio of nugget and sill is commonly used to express the spatial autocorrelation of regional variables, which also indicates the predominant factors among all natural soil conditions, weather, geographical locations and anthropogenic factors (Bhuyan et al. 2013). The ratio of nugget and sill expressed in percentages can be regarded as a criterion for classifying the spatial dependence of tea quality parameters. The variable is considered to have a strong spatial dependence if the nugget-to-sill ratio is less than 25 %, a moderate spatial dependence if this ratio is between 25 % and 75 %, and a weak spatial dependence if the ratio is more than 75 % (Cambardella et al. 1994). The nugget-to-sill ratio of all the variables showed a strong spatial dependence except TR2, TF3 and TF4. The MSE values were close to zero and their corresponding RMSSE values close to one represent a good prediction model. Close values of RMSE and ASE for all the tea quality parameters also showed good agreement with the model. Best fit model with lowest value of Akaike Information Criterion (AIC) was also used in this study. The model with the lowest value of AIC was adjudged the best one to describe the spatial variation of the studied parameters (Santra et al. 2012). The Gaussian and exponential models were found with the lowest value of AIC and this was considered as the best to fit the computed semivariogram values.
Fig. 6.
Spatial predicted map of tea quality parameters
Table 2.
Characteristics parameters of variogram models
| Parameters | Best fitted model | Nugget (C0) | Sill (C0 + C) | Nugget/Sill*100 | Spatial dependency | AIC | ME | RMSE | ASE | MSE | RMSSE | G |
|---|---|---|---|---|---|---|---|---|---|---|---|---|
| TF | Gaussian | 0.0214 | 0.1198 | 17.86 | Strong | −100.5 | 0.0020 | 0.178 | 0.165 | −0.002 | 1.08 | 42.57 |
| TR | Gaussian | 4.86 | 19.8600 | 24.47 | Strong | 64.5 | 0.0393 | 2.747 | 1.906 | 0.019 | 1.33 | 8.37 |
| TR1 | Gaussian | 1.06 | 5.0070 | 21.17 | Strong | 27.1 | 0.0068 | 1.407 | 1.082 | 0.010 | 1.28 | 19.15 |
| TR2 | Gaussian | 4.05 | 13.2600 | 30.54 | Moderate | 52.5 | −0.0333 | 2.284 | 1.832 | −0.008 | 1.17 | 2.64 |
| TSS | Gaussian | 0.23 | 10.8700 | 2.12 | Strong | 78.4 | −0.1877 | 3.897 | 3.712 | −0.050 | 1.05 | −12.99 |
| TF1 | Gaussian | 0.000075 | 0.0013 | 5.91 | Strong | −207.1 | 0.0004 | 0.026 | 0.026 | 0.012 | 0.98 | 43.64 |
| TF2 | Exponential | 0.000002 | 0.0029 | 0.07 | Strong | −170.9 | −0.0005 | 0.056 | 0.056 | −0.011 | 1.00 | 4.05 |
| TF3 | Gaussian | 0.001686 | 0.0034 | 49.85 | Moderate | −187.6 | 0.0006 | 0.049 | 0.046 | 0.007 | 1.05 | −1.92 |
| TF4 | Gaussian | 0.00538 | 0.0169 | 31.91 | Moderate | −160.6 | −0.0006 | 0.090 | 0.085 | −0.009 | 1.04 | −10.26 |
| TDE | Gaussian | 0.58 | 2.85 | 20.35 | Strong | −89.3 | 0.0067 | 0.067 | 0.68 | 0.069 | 1.08 | −17.01 |
| Brightness | Gaussian | 0.252 | 1.6910 | 14.90 | Strong | −19.2 | 0.0258 | 0.570 | 0.606 | 0.037 | 0.95 | 56.57 |
| Briskness | Gaussian | 0.372 | 1.9050 | 19.53 | Strong | −19.7 | 0.0338 | 0.712 | 0.739 | 0.043 | 0.97 | 30.09 |
| Strength | Gaussian | 0.265 | 1.8910 | 14.01 | Strong | −28.6 | 0.0172 | 0.613 | 0.643 | 0.025 | 0.96 | 30.03 |
| Quality | Gaussian | 0.326 | 1.6730 | 19.49 | Strong | −25.2 | 0.0245 | 0.650 | 0.702 | 0.032 | 0.93 | 38.51 |
AIC – Akaike Information Criterion; ME – Mean error; MSE – Mean square error; RMSE – Root mean square error; ASE – Average standard error;
G – Goodnees-of-prediction
Spatial maps prepared through ordinary kriging using the semivariogram parameters were cross validated. Evaluation indices resulting from cross validation of spatial maps of black tea properties are given in Table 2. Except for three cases the G value was greater than zero, which indicates that spatial prediction using semivariogram parameters was better than assuming mean of observed value as the property value for unsampled location (Santra et al. 2008). This also showed that semivariogram parameters obtained from fitting of experimental semivariogram values were reasonable to describe the spatial variation. Although the G values for the three cases were below zero, inclusion of more number of samples might lead to a proper fitting of experimental semivariogram and describe the spatial variation in a better way. This also showed that semivariogram parameters obtained from fitting of experimental semivariogram values were reasonable to describe the spatial variation of all the studied parameters.
Conclusion
Theaflavins and thearubigins are the two basic biochemical components for determination of CTC black tea quality. These two components of black tea from Brahmaputra valley i.e., upper Assam, south bank and North Bank were distinctly higher than those of Barak valley, Dooars and Terai region teas. Among the theaflavin fractions, simple theaflavin (TF1) was also distinctly higher in the regions of Brahmaputra valley and its impact on quality was more than other theaflavin fractions. The tea tasters’ assessment was in agreement with all these biochemical findings. The variations in total theaflavins, total thearubigins and their fractions were the main causes of variations in CTC black tea quality of the regions. TF, TF fractions and TDE showed positive significant correlations with organoleptic parameters. Among the TF fractions, TF1 was better correlated with the organoleptic parameters. Hence, TF and TF1 are the key components of CTC black tea which can influence the tasters’ sensory evaluation. A good variogram structure of studied parameters was obtained, showing that there were clear spatial patterns of tea quality parameters on the distribution map and also that the current sampling density was sufficient to indicate such patterns. Cross validation of kriged map showed that spatial prediction of tea quality parameters using semi variogram parameters was better than assuming mean of the observed values for any unsampled location. This study demonstrates that the multivariate and geostatistical analyses are effective tools for assessing tea quality parameters in major tea growing areas of India.
Contributor Information
Lakshi Prasad Bhuyan, Email: bhuyanlp@yahoo.com.
Pradip Bhattacharyya, Email: b_pradip@rediffmail.com.
References
- Bhuyan LP, Hussain A, Tamuly P, Gogoi RC, Bordoloi PK, Hazarika M. Chemical characterization of CTC black tea of northeast India: correlation of quality parameters with tea tasters’ evaluation. J Sci Food Agric. 2009;89:1498–1507. doi: 10.1002/jsfa.3614. [DOI] [Google Scholar]
- Bhuyan LP, Sabhapondit S, Baruah BD, Bordoloi C, Gogoi R, Bhattacharyya P. Polyphenolic compounds and antioxidant activity of CTC black tea of North-East India. Food Chem. 2013;141:3744–3751. doi: 10.1016/j.foodchem.2013.06.086. [DOI] [PubMed] [Google Scholar]
- Biswas AK, Sarkar AR. Biological and chemical factors affecting the valuations of North-East Indian Plains teas. II.- statistical evaluation of the biochemical constituents and their effects on briskness, quality and cash valuations of black teas. J Sci Food Agric. 1973;24:1457–1477. doi: 10.1002/jsfa.2740241202. [DOI] [Google Scholar]
- Burgos P, Madejon E, Perez-de-Mora A, Cabrera F. Spatial variability of the chemical characteristics of a trace element contaminated soil before and after remediation. Geoderma. 2006;130:157–175. doi: 10.1016/j.geoderma.2005.01.016. [DOI] [Google Scholar]
- Cambardella CA, Moorman TB, Novak JM, Parkin TB, Karlen DL, Turco RF, Konopka AE. Field scale variability of soil properties in Central Iowa soils. Soil Sci Soc Am J. 1994;58:1501–1511. doi: 10.2136/sssaj1994.03615995005800050033x. [DOI] [Google Scholar]
- Carloni P, Tiano L, Padella L, Bacchetti T, Customu C, Kay A, Damiani E. Antioxidant activity of white, green and black tea obtained from the same tea cultivar. Food Res Int. 2013;53:900–908. doi: 10.1016/j.foodres.2012.07.057. [DOI] [Google Scholar]
- Ding Z, Kuhr S, Engelhardt UH. Influence of catechins and theaflavins on the astringent taste of black tea brews. ZeitschriftfürLebensmittel-Untersuchung und -Forschung. 1992;195:108–111. doi: 10.1007/BF01201768. [DOI] [Google Scholar]
- Goovaerts P. Geostatistics for natural resource evaluation. New York: Oxford University Press; 1997. [Google Scholar]
- Harbowy ME, Balentine DA. Tea chemistry. Crit Rev Plant Sci. 1997;16:415–480. doi: 10.1080/07352689709701956. [DOI] [Google Scholar]
- IS 13862 (1999) Determination of water extract (First revision)
- Lesschceve I. Noble AC (2005) polyphenols: factors influencing their sensory properties and their effects on food and beverage preferences. Am J Clin Nutr. 2005;81(suppl):330S–335S. doi: 10.1093/ajcn/81.1.330S. [DOI] [PubMed] [Google Scholar]
- Lopez-Granados F, Jurado-Exposito M, Atenciano S, Garcia-Ferre A, De laOrden MS, Garcia-Torres L. Spatial variability of agricultural soil parameters in southern Spain. Plant Soil. 2002;246:97–105. doi: 10.1023/A:1021568415380. [DOI] [Google Scholar]
- McDowell I, Feakes J, Gay C. Phenolic compounds of black tea liquors as a means of predicting price and country of origin. J Sci Food Agric. 1991;55:627–641. doi: 10.1002/jsfa.2740550414. [DOI] [Google Scholar]
- Muthumani T, Senthil Kumar RS. Influence of fermentation time on the development of compounds responsible for quality of black tea. Food Chem. 2007;101:98–102. doi: 10.1016/j.foodchem.2006.01.008. [DOI] [Google Scholar]
- Obanda M, Owuor PO, Mang’oka R (2001) Changes in the chemical and sensory quality parameters of black tea due to variations of fermentation time and, temperature. Food Chem 75: 395–404
- Olmez H, Yilmaz A. Changes in chemical constituents and polyphenol oxidase activity of tea leaves with shoot maturity and cold storage. J Food Process Preserv. 2010;34:653–665. doi: 10.1111/j.1745-4549.2009.00423.x. [DOI] [Google Scholar]
- Opie SC, Robertson A, Clifford MN. Black tea thearubigins-their HPLC separation and preparation during in – vitro oxidation. J Sci Food Agric. 1990;50:547–564. doi: 10.1002/jsfa.2740500412. [DOI] [Google Scholar]
- Owuor PO, Obanda M. The impact of withering temperature on black tea quality. J Sci Food Agric. 1995;70:288–292. doi: 10.1002/(SICI)1097-0010(199603)70:3<288::AID-JSFA482>3.0.CO;2-Q. [DOI] [Google Scholar]
- Owuor PO, Obanda M. The use of green tea (Camellia sinensis) leaf, flavan-3-ol composition in predicting plain black tea quality. Food Chem. 2007;100:873–884. doi: 10.1016/j.foodchem.2005.10.030. [DOI] [Google Scholar]
- Owuor PO, Obanda M. The changes of black tea quality due to variations of plucking standard and fermentation time. Food Chem. 1998;61:435–441. doi: 10.1016/S0308-8146(97)00092-7. [DOI] [Google Scholar]
- Owuor PO, Obanda M, Nyirenda HE, Mphangwe NIK, Wright LP, Apostolides Z. The relationship between some chemical parameters and sensory evaluations for plain black tea produced in Kenya and comparison with similar teas from Malawi and South Africa. Food Chem. 2006;97:644–653. doi: 10.1016/j.foodchem.2005.04.027. [DOI] [Google Scholar]
- Owuor PO, Obanda M, Nyirenda HE, Mandala WL. Influence of region of production on clonal black tea chemical characteristics. Food Chem. 2008;108:263–271. doi: 10.1016/j.foodchem.2007.09.017. [DOI] [Google Scholar]
- Owuor PO, Wachira FN, Ng’etich WK. Influence of region of production on relative clonal plain tea quality parameters in Kenya. Food Chem. 2010;119:1168–1174. doi: 10.1016/j.foodchem.2009.08.032. [DOI] [Google Scholar]
- Roberts EAH. Economic importance of flavonoid substances: tea fermentation. In: Geissman TA, editor. The chemistry of flavonoid compounds. New York: Pergamon Press; 1962. pp. 468–510. [Google Scholar]
- Robertson A. The chemistry and biochemistry of black tea production – the non-volatiles. In: Wilson KC, Clifford MN, editors. Tea cultivation to consumption. London: Chapman & Hall; 1992. pp. 555–601. [Google Scholar]
- Roberts EAH, Smith RF. Phenolic substances of manufactured tea. II Spectrophotometric Evaluation of tea Liquors J Sci Food Agric. 1963;14:689–700. [Google Scholar]
- Sabhapondit S, Bhattacharyya P, Bhuyan LP, Hazarika M, Goswami BC. Optimisation of withered leaf moisture during the manufacture of black tea based upon theaflavins fractions. Int J Food Sci Technol. 2014;49:205–209. doi: 10.1111/ijfs.12299. [DOI] [Google Scholar]
- Santra P, Chopra UK, Chakraborty D. Spatial variability of soil properties and its application in prediscting surface map of hydraulic properties in an agricultural farm. Curr Sci. 2008;95:937–945. [Google Scholar]
- Santra P, Kumawat RN, Mertia RS, Mahla HR, Sinha NK. Spatial variation of soil organic carbon stock in a typical agricultural farm of hot arid ecosystem of India. Curr Sci. 2012;102:1303–1309. [Google Scholar]
- Sarmah V, Rao LJM. A thought on the biological activities of black tea. Crit Rev Sci Nutr. 2009;49:379–404. doi: 10.1080/10408390802068066. [DOI] [PubMed] [Google Scholar]
- Ullah MR, Gogoi N, Baruah D. The effect of withering on fermentation of tea leaf and development of liquor characters of black teas. J Sci Food Agric. 1984;35:1142–1147. doi: 10.1002/jsfa.2740351014. [DOI] [Google Scholar]
- Venkatesan S, Ganapathy MNK. Impact of nitrogen and potassium fertilizer application on quality of CTC tea. Food Chem. 2004;84:325–328. doi: 10.1016/S0308-8146(03)00215-2. [DOI] [Google Scholar]
- Webster R, Oliver MA. Geostatistics for environmental scientists. Chichester: John Wiley & Sons Ltd.; 2001. [Google Scholar]
- Wood DJ, Bhatia S, Chakraborty S, Choudhury MND, Deb SB, Roberts EAH. The chemical basis of quality in tea. 2. Analysis of withered leaf manufactured tea. J Sci Food Agric. 1964;15:14–19. doi: 10.1002/jsfa.2740150103. [DOI] [Google Scholar]
- Yang J, Liu RH. The phenolic profiles and antioxidant activity in different types of tea. Int J Food Sci Technol. 2013;48:163–171. doi: 10.1111/j.1365-2621.2012.03173.x. [DOI] [Google Scholar]
- Yao L, Liu X, Jiang Y, Caffin N, D’Arcy B, Singanusong R, Datta N, Xu Y. Compositional analysis of teas from Australian supermarkets. Food Chem. 2006;94:115–122. doi: 10.1016/j.foodchem.2004.11.009. [DOI] [Google Scholar]


