

Abstract
Circuit dysfunction in complex brain disorders such as schizophrenia and autism is caused by imbalances between inhibitory and excitatory synaptic transmission (I/E). Short-term plasticity differentially alters responses from excitatory and inhibitory synapses, causing the I/E ratio to change as a function of frequency. However, little is known about I/E ratio dynamics in complex brain disorders. Transcriptional dysregulation in interneurons, particularly parvalbumin interneurons, is a consistent pathophysiological feature of schizophrenia. Peroxisome proliferator activated receptor γ coactivator 1α (PGC-1α) is a transcriptional coactivator that in hippocampus is highly concentrated in inhibitory interneurons and regulates parvalbumin transcription. Here, we used PGC-1α−/− mice to investigate effects of interneuron transcriptional dysregulation on the dynamics of the I/E ratio at the synaptic and circuit level in hippocampus. We find that loss of PGC-1α increases the I/E ratio onto CA1 pyramidal cells in response to Schaffer collateral stimulation in slices from young adult mice. The underlying mechanism is enhanced basal inhibition, including increased inhibition from parvalbumin interneurons. This decreases the spread of activation in CA1 and dramatically limits pyramidal cell spiking, reducing hippocampal output. The I/E ratio and CA1 output are partially restored by paired-pulse stimulation at short intervals, indicating frequency-dependent effects. However, circuit dysfunction persists, indicated by alterations in kainate-induced gamma oscillations and impaired nest building. Together, these results show that transcriptional dysregulation in hippocampal interneurons causes frequency-dependent alterations in I/E ratio and circuit function, suggesting that PGC-1α deficiency in psychiatric and neurological disorders contributes to disease by causing functionally relevant alterations in I/E balance.
SIGNIFICANCE STATEMENT Alteration in the inhibitory and excitatory synaptic transmission (I/E) balance is a fundamental principle underlying the circuit dysfunction observed in many neuropsychiatric and neurodevelopmental disorders. The I/E ratio is dynamic, continuously changing because of synaptic short-term plasticity. We show here that transcriptional dysregulation in interneurons, particularly parvalbumin interneurons, causes frequency-dependent alterations in the I/E ratio and in circuit function in hippocampus. Peroxisome proliferator activated receptor γ coactivator 1α (PGC-1α-deficient) mice have enhanced inhibition in CA1, the opposite of what is seen in cortex. This study fills an important gap in current understanding of how changes in inhibition in complex brain disorders affect I/E dynamics, leading to region-specific circuit dysfunction and behavioral impairment. This study also provides a conceptual framework for analyzing the effects of short-term plasticity on the I/E balance in disease models.
Keywords: circuit function, E/I ratio, inhibitory interneurons, parvalbumin, schizophrenia, short-term plasticity
Introduction
Alteration in the balance between inhibitory and excitatory synaptic transmission (I/E balance) is emerging as a fundamental principle underlying a variety of neuropsychiatric and neurodevelopmental disorders (for review, see Levitt et al., 2004; Lewis et al., 2012). I/E imbalance has been found in schizophrenia (Lewis and Hashimoto, 2007), bipolar disorder (Benes and Berretta, 2001), depression (Luscher et al., 2011), anxiety (Möhler, 2006), fragile X syndrome (Gibson et al., 2008), and Rett syndrome (Dani et al., 2005). Maintaining the proper balance is essential for normal circuit function; decreases and increases in I/E can each lead to dysfunction, as seen in autism and Down syndrome, respectively (Rubenstein and Merzenich, 2003; Kleschevnikov et al., 2004). Correcting the I/E imbalance is a potential therapy for both neuropsychiatric and neurodevelopmental disorders (Fernandez et al., 2007). Synaptic short-term plasticity differentially alters the synaptic response of excitatory and inhibitory synapses, causing the I/E balance to be dynamic (Bartley and Dobrunz, 2015). However, almost nothing is known about how the dynamics of the I/E balance are affected in complex brain disorders.
GABAergic interneurons, particularly parvalbumin basket cells, are critical regulators of circuit function (Roux et al., 2014). Transcriptional dysregulation in interneurons causes altered inhibition in a variety of disorders, including schizophrenia (Lewis and Hashimoto, 2007), bipolar disorder (Chen et al., 2011), and epilepsy (Olivetti and Noebels, 2012). One of the most prevalent findings in postmortem tissue from schizophrenia patients is a decrease in parvalbumin mRNA in interneurons (Eyles et al., 2002; Knable et al., 2004; Reynolds et al., 2004). Decreased parvalbumin has also been observed in bipolar disorder (Sibille et al., 2011) and autism (Gandal et al., 2012). Peroxisome proliferator activated receptor γ coactivator 1α (PGC-1α) is a transcriptional coactivator in interneurons (Cowell et al., 2007) that regulates transcription of parvalbumin (Lucas et al., 2010). Genetic deletion of PGC-1α in mice results in decreased protein expression of parvalbumin in interneurons (Lucas et al., 2010). PGC-1α−/− mice also have decreased expression of complexin (Lucas et al., 2014), which is also decreased in postmortem schizophrenia tissue (Sawada et al., 2005). PGC-1α−/− mice provide a way to investigate the multifactorial effects of interneuron transcriptional dysregulation on synaptic and circuit function and to elucidate the functional consequences of hippocampal PGC-1α deficiency observed in neurological disorders such as Alzheimer's disease (Qin et al., 2009; Sheng et al., 2012; Pedrós et al., 2014). These studies will also provide insight into possible functional impacts of PGC-1α polymorphisms that are associated with generalized anxiety disorder (Hettema et al., 2011).
Previous studies have shown that genetic global deletion of PGC-1α reduces inhibitory synaptic transmission in cortex (Dougherty et al., 2014) while increasing high-frequency inhibitory synaptic transmission in dentate gyrus of hippocampus (Lucas et al., 2010). This indicates that the role of PGC-1α in regulating inhibitory synaptic transmission is circuit dependent. The effects of PGC-1α deletion in CA1, where inhibition by parvalbumin basket cells strongly regulates the output of hippocampus, are not yet known and nothing is known about the effects of PGC-1α loss on circuit function or on the dynamics of the I/E balance.
Here, we investigated alterations in the dynamic I/E balance in the CA1 region of hippocampus caused by genetic deletion of PGC-1α. We find that loss of PGC-1α causes an increase in the I/E ratio caused by enhanced inhibition, which severely impairs CA1 circuit function. This is caused in part by dysfunction of parvalbumin interneurons and deletion of PGC-1α only from parvalbumin interneurons recapitulates the enhanced inhibition and circuit dysfunction. The effect is frequency dependent in that paired-pulse stimulation at short intervals partially restores the I/E balance and circuit function. However, loss of PGC-1α causes alterations in kainate-induced gamma oscillations, indicating that circuit dysfunction remains. PGC-1α−/− mice also have impaired nest building, a hippocampal-dependent behavior (Deacon et al., 2002). Our results show that short-term plasticity is an important modulator of the imbalance between inhibition and excitation in an animal model of interneuron transcriptional dysregulation.
Materials and Methods
Animals.
Approval was obtained for all experimental protocols from the University of Alabama at Birmingham Institutional Animal Care and Use Committee. All experiments were conducted in accordance with the Guide for the Care and Use of Laboratory Animals adopted by the National Institutes of Health. Global (germline) PGC-1α−/− mice (Lin et al., 2004) were maintained on a C57BL/6J genetic background and housed in a 26 ± 2°C room with food and water ad libitum. All experiments using the global PGC-1α line were conducted in 4- to 8-week-old male and female PGC-1α+/+ and PGC-1α−/− littermates generated by breeding PGC-1α +/− mice (JAX # 008597; Lin et al., 2004). A subset of experiments were performed in mice that had PGC-1α specifically removed from parvalbumin interneurons, generated by crossing parvalbumin-Cre mice (PV-Cre, JAX # 008069; Hippenmeyer et al., 2005) with FLOX-PGC-1α mice (LoxP cites flanking the exon 3–5 region of the PGC-1α promoter, JAX # 009666; Lin et al., 2004). Specificity of recombination by PV-Cre was assessed by crossing PV-Cre mice with tdTomato reporter mice (Rosa-CAG-LSL-tdTomato-WPRE; JAX #007909; Madisen et al., 2010). Complete recombination took up to 3 months (Lucas et al., 2014); these animals were used at 7–9 months of age for all electrophysiology experiments.
Slice preparation.
Mice were anesthetized with isoflurane, decapitated, and brains rapidly removed. Then, 400-μm-thick coronal slices of hippocampus were cut on a vibrating microtome (VT1000S; Leica) using standard methods (Sun et al., 2005; Sun and Dobrunz, 2006; Sun et al., 2009). Slicing and dissection of the hippocampi were done in ice-cold (1–3°C) dissecting solution containing the following (in mm): 120 NaCl, 3.5 KCl, 0.75 CaCl2, 4.0 MgCl2, 1.25 NaH2PO4, 26 NaHCO3, and 10 glucose, bubbled with 95% O2/5% CO2, pH 7.35–7.45. Slices were stored at room temperature in a holding chamber containing the dissecting solution. For animals 7–9 months of age, the slices were dissected in a sucrose based solution containing the following (in mm): 87 NaCl, 3 KCl, 0.5 CaCl2, 7.0 MgCl2, 1.25 NaH2PO4, 26 NaHCO3, 75 sucrose, and 20 glucose, bubbled with 95% O2/5% CO2, pH 7.35–7.45. The slices from older animals were placed in a 32°C water bath for 45 min to 1 h before being returned to room temperature. Slices were bubbled with 95% O2–5% CO2 for ≥1 h before recording.
Electrophysiology.
Electrophysiology experiments were performed between 28°C and 30°C, unless noted otherwise. During experiments, slices were held in a submersion recording chamber perfused (2.5–3.5 mls/min) with external recording solution (ERS). ERS contained the following compounds (in mm): 120 NaCl, 3.5 KCl, 2.5 CaCl2, 1.3 MgCl2, 1.25 NaH2PO4, 26 NaHCO3, and 10 glucose, bubbled with 95% O2/5% CO2, pH 7.35–7.45. ERS also had 50 μm d-APV (D-2-amino-5-phosphonopentanoic acid) to block NMDA receptor-mediated currents and prevent postsynaptic short-term plasticity, as well as to prevent long-term potentiation and long-term depression; 1 μm AM251 (N-(piperidin-1-yl)-5-(4-iodophenyl)-1-(2,4-dichlorophenyl)-4-methyl-1H-pyrazole-3-car-boxamide) to block CB1 receptors and prevent depolarization-induced suppression of inhibition (DSI) (De-May and Ali, 2013); and 10 μm CGP 55845 ((2S)-3-[[(1S)-1-(3,4-Dichlorophenyl-)ethyl]amino-2-hydroxypropyl](phenylmethyl)phosphinic acid) to block GABAB receptors, including the receptors localized presynaptically at Schaffer collateral synapses, thereby preventing activity-dependent reduction in glutamate release (Speed and Dobrunz, 2008). No effect of APV, CGP 55845, or AM251 on the I/E ratio induced by paired-pulse stimulation was observed (Bartley and Dobrunz, 2015). To isolate monosynaptic IPSCs, 10 μm NBQX (2,3-dioxo-6-nitro-1,2,3,4-tetrahydr-obenzo[f]quinoxaline-7-sulfonamide) was added to the ERS. Where noted, picrotoxin (100 μm) was added to the ERS to block inhibitory synaptic responses mediated by GABAA receptors. To isolate monosynaptic IPSCs from either cholecystokinin (CCK) or parvalbumin basket cells, the following compounds were used, respectively, 500 nm DAMGO ([D-Ala2,N-MePhe4,Gly-ol5]enkephalin) or 1 μm WINN55,212 (R-(+)-(2,3-dihydro-5-methyl-3-[(4-morpholinyl)methyl]pyrol[1,2,3-de]-1,4-benzoxazin-6-yl) (1-naphthalenyl)meth anone mesylate) (Glickfeld et al., 2008). In experiments to isolate monosynaptic IPSCs from basket cells (see below), AM 251 was not added to the ERS.
Pyramidal whole-cell recording.
CA1 pyramidal cells were blindly patched on a Nikon Optiphot-2 upright microscope. Neurons were patched in the voltage-clamp configuration and recorded at various holding potentials (0 mV, −40 mV, and −55 mV) using a Multiclamp 700A amplifier (Molecular Devices). Patch electrodes (4–6MΩ) were filled with internal solution composed of the following (in mm): 125 Cs-gluconate, 0.6 EGTA, 1.0 MgCl2, 3 MgSO4, 25 HEPES, 10 Na-ATP, 0.3 GTP, 5 phospocreatine, pH was adjusted to 7.2 with CsOH. The internal solution also contained 10 mm Cs-BAPTA to block DSI (Isokawa and Alger, 2005) and QX-314 (N-(2,6-dimethylphenylcarbamoylmethyl) triethylammonium chloride) (2 mm) to improve space clamp and to reduce nonlinear effects caused by voltage-gated channels in dendrites while recording from the soma (Colling and Wheal, 1994). The access resistance and holding current (<200 pA) were monitored continuously. Recordings were rejected if either access resistance or holding current increased >25% during the experiment.
PSCs were recorded in response to extracellular stimulation elicited using a bipolar tungsten microelectrode (FHC). Stimulation was generated from a DS8000 digital stimulator (WPI) and applied with a BSI-2 biphasic stimulus isolator (BAK Electronics). The stimulation intensity ranged from 10 to 100 μA unless otherwise noted and the duration of stimulation was 100 μs. Except where noted, the stimulating electrode was placed in stratum radiatum to stimulate the Schaffer collateral axons and positioned between 250 and 400 μm away from the cell being recorded. Paired-pulse stimulation at different intervals (in ms: 40, 60, 100, 200, and 1000) were applied and repeated 20–25 times for each interval at 0.07 Hz. Paired-pulse ratios are calculated as the amplitude of response 2/amplitude of response 1.
Compound PSCs, which contain both excitatory and inhibitory responses, were recorded in CA1 pyramidal cells held between −45 mV to −40 mV. The stimulus strength was adjusted to produce a PSC with a single excitatory peak and a single inhibitory peak that was 40–60% of the maximum inhibitory component. Disynaptic IPSCs and monosynaptic IPSCs were recorded at 0 mV. To record disynaptic IPSCs, the stimulating electrode was placed in stratum radiatum. To record monosynaptic IPSCs, the stimulating electrode was placed in stratum pyramidale for somatic inhibition and distal stratum radiatum for dendritic inhibition. The maximal IPSC was determined and stimulation was reduced to generate a response with an amplitude 40–60% of the maximum IPSC. EPSCs were recorded at −55 mV. The stimulation intensity was adjusted to obtain a response that was ∼50% of the maximum EPSC. For the input/output curves of EPSCs, disynaptic IPSCs, and monosynaptic IPSCs, the stimulus intensity of the threshold evoked response, referred to as 1×, was determined as the intensity that gave a response between 10 and 15 pA. Stimulation was increased in a multiplicative manner to develop the input/output curves. For isolation of monosynaptic IPSCs from parvalbumin versus CCK basket cells, the maximal IPSC amplitude was determined and the stimulus intensity was reduced to reach 30% of the maximum IPSC amplitude.
Spontaneous IPSCs (sIPSCs) were pharmacologically isolated with NBQX (10 μm) and d-APV (50 μm). Using 1 μm TTX (tetrodotoxin), mini-IPSCs (mIPSCs) were then isolated. Analyses of sIPSCs and mIPSCs were performed using custom software written in Visual Basic, which measured amplitude and interevent interval. Events were fit to a template response and all sIPSCs and mIPSCs that fit the template and passed visual inspection were included in the analysis.
EPSP-spike coupling recording.
Two field recording electrodes were placed in the slice, one in stratum pyramidale to measure the population spike and the other in stratum radiatum to measure the dendritic field EPSP. The population spike amplitude was calculated by measuring the amplitude of the negative peak and adding it to the average response size of the two positive peaks, as described previously (Marder and Buonomano, 2003). Stimulation was applied every 10 s as a pair of pulses 60 ms apart. A stable baseline was obtained before applying a series of stimulus intensities (10–300 μA). The data were normalized to the maximum population spike amplitude of the second pulse at 60 ms and fitted using a Boltzmann curve.
In vitro gamma oscillations.
For gamma oscillation experiments, 300-μm-thick horizontal hippocampal slices were made from 4- to 6-week-old male and female PGC-1α+/+ and PGC-1α−/− mice using the standard dissection solution described above. Slices recovered for 1 h in a 32°C water bath before being returned to room temperature. Field recording electrodes were placed in stratum pyramidale of CA3 in slices using a submerged recording chamber. Throughout the experiment, the ERS was maintained at 32°C with a flow rate of 3–5 ml/min. After a period of stabilization, 100 nm kainate was applied to generate gamma oscillations (Fuchs et al., 2007). Fast Fourier transforms for power spectra were computed using custom written software in Visual Basic.
Voltage-sensitive dye recordings.
Slices were stained with the voltage-sensitive fluorescent dye N-(3-triethylammoniumpropyl)-4-{4-[4-(diethylamino)phenyl]butadienyl}pyridinium dibromide (RH-414; 30 μm) for at least 45 min at room temperature and with continuous bubbling using 95% O2/5% CO2. Excess dye was washed out for a minimum of 10 min in a submersion chamber perfused (2.5–3.0 ml/min) with ERS maintained at 30°C. RH-414 was briefly excited with 535 ± 40 nm light. RH-414 fluorescence emission was collected by a ×10 0.5 numerical aperture Plan-Neofluar objective (Carl Zeiss) and detected by a NeuroPDA 464-element photodiode array (Red Shirt Imaging) mounted under an inverted microscope (Zeiss Axiovert 135TV). To image membrane depolarization in area CA1 with RH-414, Schaffer collateral axons in stratum radiatum were stimulated with paired current pulses (50 and 500 ms) at different current intensities (30–130 μA) delivered through a bipolar tungsten microelectrode (FHC) connected to a constant-current stimulus isolator (S8800 stimulator; Grass Instruments). Individual photodiode currents were sampled at 1.6 kHz, amplified, digitized, and stored on a computer running Neuroplex software (Red Shirt Imaging), as described previously (Calfa et al., 2011).
Fluorescence measurements during image sequences were normalized to the resting light intensity measured for each photodiode in the array. RH-414 bleaching was corrected by imaging sequences in the absence of stimulation. The maximum amplitude was obtained by averaging the traces from 20 diodes located in the vicinity of the stimulus electrode. The area of the spatial spread was obtained by determining the number of photodiodes in the array that showed ΔF/F levels twice the baseline noise and multiplying by 75 μm. Similarly, the duration of RH-414 signals was obtained from the interval between the first and the last frames of a sequence that showed ΔF/F levels above the baseline noise.
Gene and protein expression analyses.
Mice were anesthetized with isoflurane before decapitation. Whole hippocampi were quickly dissected, frozen on dry ice, and stored at −80°C until RNA or protein isolation. RNA isolation, reverse transcription, and Taqman q-RT-PCR were conducted as described previously (Lucas et al., 2010; Lucas et al., 2014) with Applied Biosystems primer/probe sets for parvalbumin (Mm00443100_m1), complexin 1 (Mm00514378_m1), and synaptotagmin 2 (Mm00436864_m1). Relative concentrations of the genes of interest were calculated compared with a standard curve calculated from dilutions of cDNA (1:5, 1:10, 1:20) from a pool of littermate controls. Values were normalized to β-actin (Mm00607939_s1) and expressed as ratio to control samples ± SE.
Western blot analysis and immunofluorescence studies were conducted as described previously (Lucas et al., 2014). Primary antibodies included complexin 1,2 (Synaptic Systems; Pabst et al., 2000), parvalbumin (Sigma-Aldrich), and synaptotagmin 2 (znp-1; Zebrafish International Resource Center; Fox and Sanes, 2007). For Western blot anlysis, β-actin (Millipore Bioscience Research Reagents; Cowell et al., 2007) was used as the internal control.
Nesting behavior.
Two-month-old male and female PGC-1α+/+ and PGC-1α−/− mice were individually housed with food and water ad libitum for at least 48 h. The room temperature was maintained at 21 ± 2°C. The floor of the cage was covered with bedding to a depth of 0.5 cm. One hour before the onset of the dark phase of the light cycle, each cage was supplied with a nestlet of pressed cotton (3 g; Ancare). The next morning, cages were inspected for nests. Pictures were taken for documentation and the untorn nestlet was weighed. Nest construction was scored using an established 5 point system as follows (Deacon, 2006; Deacon, 2012): 1, nestlet not noticeably touched; 2, nestlet partially torn up (50–90% remaining intact); 3, nestlet mostly shredded but often no identifiable nest site (<90% shredded); 4, an identifiable, but flat nest; or 5, a (near) perfect nest with clear nest crater (>90% shredded). Nesting behavior was also performed in PGC-1αWT:PV-Cre and PGC-1αfl/fl: PV-cre mice (2–8 months old).
Statistical analysis.
All statistics were performed using Origin software and statistical significance was p < 0.05. Data are presented as means ± SE and sample number (n) refers to cell number for electrophysiological experiments. Statistical comparisons were made using Student's t test or one-way ANOVA followed by Tukey post hoc analysis for multiple comparisons.
Results
I/E ratio is enhanced in PGC-1α−/− mice due to increased inhibition
To test the effects of transcriptional dysfunction in interneurons on the I/E ratio, we recorded compound postsynaptic currents from CA1 pyramidal cells at a holding potential near the threshold for action potential generation (between −45 mV and −40 mV) in response to stimulation of Schaffer collateral axons, which generates a trace with both an EPSC and subsequent IPSC (compound PSC; Fig. 1A, inset). We quantified the I/E ratio by measuring the peak amplitude of the inhibitory and excitatory components of the compound PSC. The baseline I/E ratio showed almost a 4-fold increase in slices from PGC-1α−/− mice compared with PGC-1α+/+ mice (Fig. 1A), although there was no difference in the stimulus intensity used (PGC-1α+/+ 70.8 ± 11.1 μA vs PGC-1α−/− 64.3 ± 10.8 μA; Student's t test, p = 0.69). There was also no difference in input resistance of CA1 pyramidal cells between the two genotypes (PGC-1α+/+ 136.93 ± 11.06 MΩ vs PGC-1α−/− 129.43 ± 10.75 MΩ, n = 14, 20, Student's t test, p = 0.59). However, the excitation window (the time that the compound PSC is excitatory) was dramatically reduced in PGC-1α−/− mice (Fig. 1B). The change in I/E ratio could be caused by either changes in excitation or inhibition or possibly both. To test this, we measured EPSCs and disynaptic IPSCs at their respective reversal potentials (0 mV, −55 mV). There was an almost 2-fold enhancement of the basal disynaptic inhibition (Fig. 1C), but no change in the magnitude of excitation onto CA1 pyramidal cells (Fig. 1D). We also quantified the I/E ratio using the peak amplitudes measured at the respective reversal potentials (Torborg et al., 2010; Bartley and Dobrunz, 2015); this method showed approximately a two-fold enhancement of the baseline I/E ratio (PGC-1α+/+ 1.8 ± 0.2 vs PGC-1α−/− 3.9 ± 0.7; Student's t test, p < 0.05, n = 10, 13). To verify that the observed effects were not caused by differences in stimulation intensity between the two genotypes, we measured input/output curves for both disynaptic IPSCs and for EPSCs, plotting peak amplitude as a function of stimulus intensity (as a multiple of threshold intensity). The input/output curves showed greatly enhanced amplitude of disynaptic IPSCs across a range of stimulus intensities (Fig. 1E), but no significant difference in EPSC amplitudes (Fig. 1F). Therefore, the alterations in I/E balance in PGC-1α−/− mice are only due to the large increase in the magnitude of disynaptic inhibition.
Figure 1.

Increased I/E ratio in PGC-1α−/− mice is caused by enhanced inhibition. A, The I/E ratio in CA1 pyramidal cells, as determined from the peaks of the compound PSC in response to Schaffer collateral stimulation, is greatly enhanced in slices from PGC-1α−/− mice (n = 10, 6). Inset, Example traces of compound PSCs in CA1 pyramidal cells held at −45 mV from PGC-1α+/+ (black) and PGC-1α−/− (red) mice. Scale bars, 50 ms, 50 pA. B, The excitation window (width of the excitatory component of the compound PSC at the points that it crosses 0 pA as depicted by arrows; Chittajallu et al., 2013; Bartley and Dobrunz, 2015) is shorter in slices from PGC-1α−/− mice. Inset, Example traces of compound PSCs in CA1 pyramidal cells held at −45 mV from PGC-1α+/+ (black) and PGC-1α−/− (red) mice. Scale bars, 10 ms, 50 pA. C, The peak amplitude of disynaptic inhibition is enhanced nearly two-fold in slices from PGC-1α−/− mice (n = 17, 22). Inset, Example traces of disynaptic IPSCs onto CA1 pyramidal cells held at the reversal potential of excitation (0 mV) from PGC-1α+/+ (black) and PGC-1α−/− (red) mice. Scale bars, 50 ms, 200 pA. D, The peak amplitude of the EPSCs is not significantly reduced in slices from PGC-1α−/− mice (n = 12, 13). Inset, Example traces of EPSCs onto CA1 pyramidal cells held at the reversal potential of inhibition (−55 mV) from PGC-1α+/+ (black) and PGC-1α−/− (red) mice. Scale bars, 25 ms, 75 pA. E, Input/output curve for disynaptic IPSCs onto CA1 pyramidal cells held at 0 mV indicates that the peak IPSC amplitude is larger in slices from PGC-1α−/− mice at all stimulation amplitudes above threshold (ANOVA, F(7, 40) = 5.81, p < 0.001, n = 4, 4). F, Input/output curve for EPSCs onto CA1 pyramidal cells held at −55 mV in indicates that the peak EPSC amplitude is not different in slices from PGC-1α−/− mice across a range of stimulus intensities (ANOVA, F(6, 35) = 1.12, p = 0.37, n = 4, 3). *p < 0.05, Student's t test.
The spread of activity and the output of CA1 pyramidal cells are greatly reduced in PGC-1α−/− mice
To determine how the enhanced inhibition affected the CA1 microcircuit, we used voltage-sensitive dye imaging (Albertson et al., 2011; Calfa et al., 2011) to measure the spatiotemporal spread of depolarization in CA1 in response to Schaffer collateral stimulation (Fig. 2A–D). Example images show that the spread of activity is greatly reduced in CA1 from PGC-1α−/− mice compared with PGC-1α+/+ mice (Fig. 2A). Group results show that the amplitude (Fig. 2B), spatial spread (Fig. 2C), and duration (Fig. 2D) of the voltage-sensitive dye signal are all greatly reduced in PGC-1α−/− mice.
Figure 2.
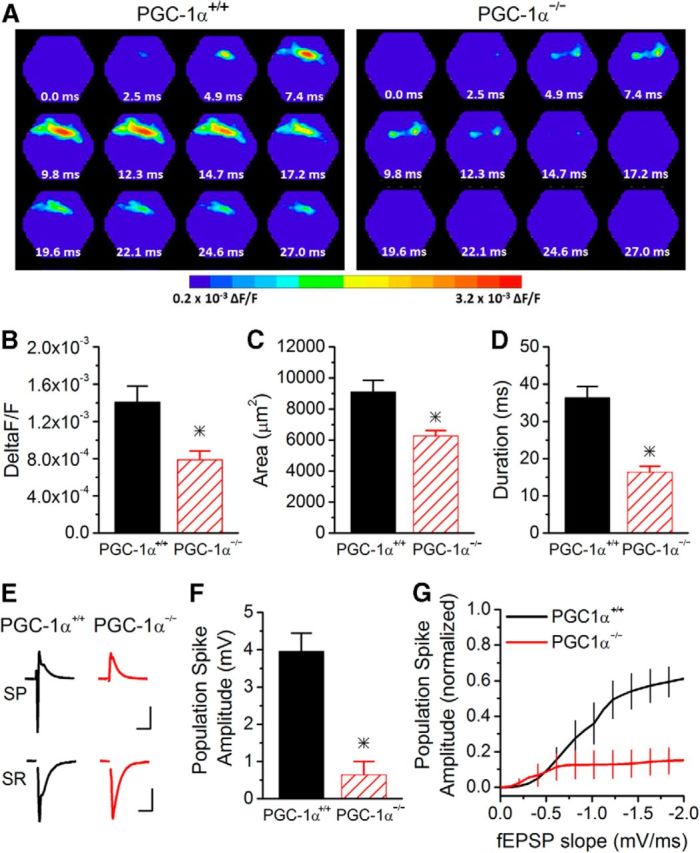
Reduced activation of CA1 hippocampal circuit in PGC-1α−/− mice. A, Example images of the spatiotemporal pattern of voltage-sensitive dye signals evoked in CA1 from PGC-1α+/+ and PGC-1α−/− mice. Frames are 2.47 ms apart. B, The maximum amplitude of the response is reduced in PGC-1α−/− mice (n = 14, 9). C, The spread of the response is reduced in PGC-1α−/− mice (n = 14, 9). D, The duration of the response is reduced in PGC-1α−/− mice (n = 14, 9). E, Example traces of field recording in stratum pyramidale and stratum radiatum from PGC-1α+/+ (black) and PGC-1α−/− (red) mice. Scale bars, 15 ms, 1 mV (top and bottom). F, Population spike amplitudes were measured in stratum pyramidale. The maximum population spike generated in PGC-1α−/− mice (n = 6) was dramatically reduced compared with PGC-1α+/+ mice (n = 9). G, EPSP-spike coupling was measured in response to stimulation of Schaffer collateral axons. The average Boltzmann curve for each group is displayed. In PGC-1α−/− mice, the output from CA1 pyramidal cells was greatly reduced (ANOVA, F(14, 749) = 80.28, p < 0.001, n = 9, 6). *p < 0.05, Student's t test.
To test the effects of the increased I/E ratio on CA1 output, we used extracellular recordings to measure EPSP-spike coupling (Marder and Buonomano, 2003) in CA1 from PGC-1α+/+ and PGC-1α−/− mice in response to Schaffer collateral stimulation over a wide range of stimulus intensities (10–300 μA). Although population spikes in the CA1 pyramidal cell layer were readily observed in slices from PGC-1α+/+ mice, almost no spiking was observed in PGC-1α−/− mice even at high stimulus intensities (Fig. 2E–G). The maximum population spike amplitude was greatly reduced (Fig. 2F) and 50% of slices from PGC-1α−/− mice had no detectable population spikes even at 300 μA stimulation. The narrow excitation window observed in these mice (Fig. 1B) most likely plays a strong role in the reduced spiking. In slices in which spiking was observed, the relationship between spiking and the dendritic field potential slope was shifted downward (Fig. 2G), indicating that more excitatory input was required to cause CA1 pyramidal cell spiking. This shows that the enhanced I/E ratio due to loss of PGC-1α causes a large decrease in synaptically evoked spiking of CA1 pyramidal cells. This would lead to an impairment of CA1 output, and thus hippocampal output, caused by transcriptional dysregulation in interneurons.
Loss of PGC-1α causes increased GABA release
To determine whether the enhancement in disynaptic inhibition in CA1 is caused by a change in the properties of the inhibitory synapses, we recorded from CA1 pyramidal cells holding the cell at 0 mV without applying stimulation to record either mIPSCs (addition of TTX; Fig. 3A) or sIPSCs (Fig. 3B). The mIPSC amplitude was unchanged in PGC-1α−/− slices (Fig. 3A1), suggesting that the responsiveness of GABAA receptors is not enhanced. Instead, the frequency of mIPSCs was increased (Fig. 3A2), suggesting an increase in the release of GABA. This could be caused by an increase in the release probability of GABA, an increase in the number of inhibitory synapses, or both. If the number of inhibitory synapses were increased, it would be expected that the average number of synapses made by individual GABAergic axons onto each CA1 pyramidal cell would be greater. Because spontaneous action potentials would cause simultaneous release from multiple synapses per axon at the same time, this would therefore cause an increase in the sIPSC amplitude. However, the amplitude of the sIPSCs was unchanged (Fig. 3B1), suggesting that the number of inhibitory synapses is not increased. The frequency of sIPSCs was also enhanced in PGC-1α−/− compared with PGC-1α+/+ mice (Fig. 3B2), consistent with the increase in mIPSC frequency.
Figure 3.

Inhibitory synapses are altered by the loss of PGC-1α. A, The amplitude of mIPSCs is not altered (A1, n = 10, 6). However, the frequency of the mIPSCs is enhanced in PGC-1α−/− mice (A2, n = 10, 6). Insets, Example traces of mIPSCs onto CA1 pyramidal cells from PGC-1α+/+ (black) and PGC-1α−/− (red) mice. Scale bars, 200 ms, 25 pA. B, Similar to the mIPSCs, the amplitude of the sIPSCs is unchanged (B1, n = 11, 13), whereas the frequency of the sIPSCs is enhanced in PGC-1α−/− mice (B2, n = 11, 13). Insets, Example traces of sIPSC onto CA1 pyramidal cells from PGC-1α+/+ (black) and PGC-1α−/− (red) mice. Scale bars, 200 ms, 50 pA. C, D, Evoked monosynaptic inhibition is enhanced from both somatic (C, n = 12, 8) and dendritic (D, n = 19, 11) targeting interneurons in slices from PGC-1α−/− mice. Monosynaptic IPSCs were generated from stimulation in stratum radiatum near the stratum pyramidale (somatic, left) and near stratum lacunosum moleculare (dendritic, right). Insets, Example traces of evoked monosynaptic IPSCs onto CA1 pyramidal cells held at 0 mV from PGC-1α+/+ (black) and PGC-1α−/− (red) mice. Scale bars, 50 ms, 200 pA. E, F, The CV of monosynaptic IPSCs is reduced in PGC-1α−/− mice for both somatic IPSCs (E, n = 12, 8) and dendritic IPSCs (F, n = 14, 12). G, H, Input/output curves for monosynaptic IPSCs indicate that the peak IPSC amplitude is larger in slices from PGC-1α−/− mice at all stimulation amplitudes above threshold for both somatic (G, ANOVA, F(7, 44) = 11.25, p < 0.002, n = 4, 4) and dendritic (H, ANOVA, F(7, 44) = 10.04, p < 0.003, n = 4, 4) targeting interneurons. I, There are two main classes of somatic targeting interneurons, parvalbumin (PV) and CCK basket cells. Inhibition from each subtype can be pharmacologically isolated by application of either 1 μm WINN or 500 nm DAMGO, respectively. Somatic monosynaptic IPSCs from PV (n = 5, 4) and CCK (n = 3, 3) interneurons have larger amplitudes in slices from PGC-1α−/− mice. J, The percentage of the somatic monosynaptic IPSC that is from parvalbumin cells is larger in PGC-1α−/− mice (n = 8, 7). *p < 0.05, Student's t test.
PGC-1α is found in all types of interneurons (Cowell et al., 2007). Previous work has shown that PGC-1α regulates the expression of parvalbumin (Lucas et al., 2010), which is expressed primarily in fast-spiking basket cells that heavily innervate cell bodies of CA1 pyramidal cells, although it is also expressed in a subset of dendritic-targeting interneurons. It is therefore possible that the loss of PGC-1α has a greater effect on somatic inhibition than dendritic inhibition. We tested this by measuring monosynaptic inhibition in CA1 (with excitatory synapses blocked by 10 μm NBQX) in response to extracellular stimulation of inhibitory axons in stratum pyramidale (somatic) or stratum radiatum (dendritic) (Miles et al., 1996; Chevaleyre and Castillo, 2003; Mendoza et al., 2006). In both the somatic and dendritic targeting inhibition, the amplitude of the monosynaptic IPSCs in PGC-1α−/− mice was enhanced >2-fold compared with PGC-1α+/+ mice (Fig. 3C,D), suggesting that loss of PGC-1α affects both somatic and dendritic inhibition. To further explore the possibility that PGC-1α−/− mice have enhanced GABA release probability, we measured the coefficient of variation (CV) of monosynaptic IPSCs from both genotypes (Dvorzhak et al., 2013). The PGC-1α−/− mice had a lower CV compared with PGC-1α+/+ mice for both somatic IPSCs (Fig. 3E) and dendritic IPSCs (Fig. 3F), which indicates an increased GABA release probability in the PGC-1α−/− mice. To further verify that the enhanced monosynaptic inhibition was not due to stimulation intensity differences between PGC-1α+/+ and PGC-1α−/− mice, we measured input/output curves of monosynaptic inhibition from somatic and dendritic targeting interneurons. The input/output curves showed enhanced monosynaptic IPSCs across a range of stimulus intensities in PGC-1α−/− slices for both somatic and dendritic inhibition (Fig. 3G,H). Together, these data show that loss of PGC-1α in interneurons causes enhanced inhibitory synaptic transmission as a result of an increase in the probability of GABA release.
Somatic targeting inhibition mainly comes from parvalbumin and cholecystokinin (CCK) basket cells (Berghuis et al., 2004). Monosynaptic IPSCs that are primarily from parvalbumin basket cells can be pharmacologically isolated by recording somatic IPSCs and blocking GABA release from CCK basket cells with the CB1 receptor agonist WINN (1 μm) (Glickfeld et al., 2008). Monosynaptic inhibitory synapses from parvalbumin basket cells have an approximately 3-fold greater IPSC amplitude in PGC-1α−/− mice compared with PGC-1α+/+ mice (Fig. 3I). In addition, there was an approximately 2-fold increase in the amplitude of monosynaptic IPSCs from CCK basket cells, which was measured by blocking parvalbumin inhibitory output with 500 nm DAMGO (Glickfeld et al., 2008). The percentage of the monosynaptic somatic IPSC that is from parvalbumin interneurons is also increased in PGC-1α−/− mice (Fig. 3J). Together, our results show that loss of PGC-1α has widespread effects on inhibition, both somatic and dendritic, including both parvalbumin and CCK cells. Because many dendritic targeting interneurons contain CCK (Bezaire and Soltesz, 2013) and there is a population of parvalbumin-positive dendritic targeting interneurons (Bezaire and Soltesz, 2013), parvalbumin and CCK interneurons could play a role in the enhanced dendritic inhibition, although other subtypes might also contribute.
Loss of PGC-1α causes reduced levels of specific synaptic proteins
Previous work has shown that inhibition is decreased in motor cortex of PGC-1α−/− mice (Dougherty et al., 2014) and that, in addition to reduced parvalbumin (Lucas et al., 2010), specific transcripts influencing synaptic release are reduced in cortex, specifically synaptotagmin 2 and complexin 1 (Lucas et al., 2014). Because loss of PGC-1α causes enhanced inhibition in hippocampus rather than reduced inhibition, it is possible that the transcriptional changes are different in hippocampus from those previously described in cortex. To test this, we used q-RT-PCR, which revealed that transcripts for parvalbumin (t(11) = 8.6, p = 3.2 × 10⁻⁶), synaptotagmin 2 (t(18) = 4.2, p = 0.0006), and complexin 1 (t(19) = 4.4, p = 0.0003) are all significantly reduced in hippocampal homogenates from PGC-1α−/− mice (Fig. 4A). However, alterations in transcript levels do not always correlate with reduce protein expression (Ghazalpour et al., 2011). Therefore, to confirm that the protein level was reduced, we used Western blot analysis and immunohistochemistry. A prior study showed a dramatic reduction in parvalbumin protein expression in PGC-1α−/− hippocampus (Lucas et al., 2010) and Western blot analysis confirmed that protein expression of synaptotagmin 2 (t(6) = 8.9, p = 0.0001) and complexin 1 (t(7) = 8.7, p = 5.2 × 10⁻⁵) was also reduced in hippocampal homogenates from PGC-1α−/− mice (Fig. 4B,C). Immunofluorescence double labeling with antibodies against synaptotagmin 2 and parvalbumin revealed high coexpression in axon terminals throughout the CA1 pyramidal cell layer in PGC-1α+/+ mice (Fig. 4D). Synaptotagmin 2 is highly expressed in parvalbumin-positive puncta in PGC-1α+/+ mice, especially in baskets surrounding pyramidal cell soma. Both synaptotagmin 2 and parvalbumin expression were markedly reduced in PGC-1α−/− mice, but very limited coexpression in axon terminals was still evident. Immunohistochemistry also showed that complexin 1 expression is reduced throughout CA1 in PGC-1α−/− mice (data not shown). These large reductions in synaptotagmin 2 and complexin 1 in hippocampus are consistent with the fact that, within the hippocampus, these transcripts are primarily expressed by GABAergic interneurons (Marquèze et al., 1995; Eastwood et al., 2000).
Figure 4.

PGC-1α is required for the expression of synaptic vesicle fusion proteins in hippocampus. A, q-RT-PCR revealed significant reductions in transcript expression of parvalbumin (PV), synaptotagmin 2 (Syt2), and complexin 1 (Cplx1) in hippocampal homogenates from PGC-1α−/− (n = 6–9 per group) compared with PGC-1α+/+ mice (n = 7–12 per group). B, Western blot analysis confirmed that protein expression of Syt2 and Cplx1 was also reduced in hippocampal homogenates from PGC-1α−/− (n = 7) compared with PGC-1α+/+ mice (n = 7). C, Representative Western blots of data shown in B. Arrowheads indicate bands for Cplx1 and Cplx2. D, Immunofluorescence double-labeling with antibodies against Syt2 (green) and PV (red) revealed high coexpression (yellow) of the two proteins in axon terminals throughout the CA1 pyramidal layer in PGC-1α+/+ mice. Syt2 is highly expressed in rings of PV-positive puncta (arrowheads) surrounding CA1 pyramidal cells. Both Syt2 and PV expression were markedly reduced in PGC-1α−/− mice, but limited coexpression in axon terminals was still evident (arrowhead). Scale bar, 25 μm. n = 3–5 per group for immunofluorescence experiments. ***p < 0.0005, **p < 0.005, two-tailed, independent-samples t tests.
I/E ratio is dynamically regulated in PGC-1α−/− mice
Because short-term plasticity alters both excitatory and inhibitory synapses and can dynamically regulate the I/E ratio (Bartley and Dobrunz, 2015), we next tested what the overall effect of short-term plasticity is on the difference in I/E between PGC-1α−/− and PGC-1α+/+ mice. During paired-pulse stimulation (Fig. 5A), both genotypes showed a decrease in the I/E ratio on the second pulse (closed symbols) compared with the first pulse (open symbols at 0 ms) across a range of intervals. This indicates that the I/E ratio is dependent on stimulus interval in both genotypes, as we had shown previously for wild-type mice (Bartley and Dobrunz, 2015). In addition, the I/E ratio on the second pulse was larger in slices from PGC-1α−/− mice compared with PGC-1α+/+ mice at all interpulse intervals (Fig. 5A). However, the difference between the two genotypes was greater at longer intervals (200–1000 ms) compared with shorter intervals and the effects were smaller on the second pulse at all intervals than on the first pulse. This indicates that the alteration in the I/E ratio in slices from PGC-1α−/− mice is not constant. Instead, the magnitude of the I/E imbalance is modulated by the timing of the stimulus as a result of short-term plasticity.
Figure 5.

Alteration in the I/E ratio is frequency dependent in PGC-1α−/− mice. A, The I/E ratio of the second pulse in response to paired-pulse stimulation is larger in slices from PGC-1α−/− mice compared with PGC-1α+/+ mice across a range of interpulse intervals. However, the magnitude of the difference between PGC-1α−/− mice and PGC-1α+/+ mice is interval dependent, being smaller at shorter intervals and larger at longer intervals (ANOVA, F(15, 87) = 24.26647, p < 0.001, n = 10, 6). The I/E ratio on the first pulse, which has the largest magnitude of difference between PGC-1α−/− mice and PGC-1α+/+ mice, is shown for comparison (open symbols at time 0 ms). Insets, Example traces of compound PSCs at a 200 ms interval from PGC-1α+/+ (black) and PGC-1α−/− mice (red) measured in CA1 pyramidal cells held at −45 mV. Scale bar, 100 ms, 100 pA. B, The paired-pulse ratio of the excitation is unchanged (ANOVA, F(24, 72) = 2.40803, p = 0.13, n = 12, 13). Insets, Example traces of EPSCs from PGC-1α+/+ (black) and PGC-1α−/− mice (red) measured in CA1 pyramidal cells held at −55 mV. Scale bar, 50 ms, 100 pA. C, The paired-pulse ratio of disynaptic inhibition shows paired-pulse facilitation in the PGC-1α+/+ mice but shows paired-pulse depression in PGC-1α−/− (ANOVA, F(38, 114) = 15.45, p < 0.001, n = 22, 17). Insets, Example traces of disynaptic IPSCs from PGC-1α+/+ (black) and PGC-1α−/− mice (red) measured in CA1 pyramidal cells held at 0 mV. Scale bar, 50 ms, 200 pA. D, Inhibitory synapses from putative somatic targeting interneurons have less paired-pulse depression with the loss of PGC-1α (ANOVA, F(5, 42) = 3.42, p < 0.02, n = 9, 6). E, The paired-pulse ratio at a 60 ms interval of monosynaptic inhibition from putative somatic targeting interneurons in PGC-1α−/− slices shows less paired-pulse depression compared with PGC-1α+/+ at stimulation intensities greater than threshold (ANOVA, F(7, 44) = 5.42, p < 0.008, n = 4, 4). F, Inhibitory synapses from dendritic targeting interneurons have no significant change in their paired-pulse ratio with the loss of PGC-1α (ANOVA, F(5, 66) = 0.80, p = 0.55, n = 14, 10). G, There is no difference between genotypes in the paired-pulse ratio at a 60 ms interval of monosynaptic inhibition from putative dendritic targeting interneurons across a range of stimulation intensities (ANOVA, F(7, 44) = 0.93, p = 0.34, n = 4, 4). Paired-pulse ratios are calculated as the amplitude of response 2/amplitude of response 1. *p < 0.05.
To determine the source of this effect, we next examined the paired-pulse responses of excitation and inhibition separately. There was no difference in the amount of paired-pulse facilitation of excitation (measured at −55 mV) between the two genotypes (Fig. 5B); both showed strong paired-pulse facilitation of Schaffer collateral evoked EPSCs. Disynaptic inhibition (measured in CA1 pyramidal cells at 0 mV) also showed robust paired-pulse facilitation in slices from PGC-1α+/+ mice (Fig. 5B), as we have observed previously (Bartley and Dobrunz, 2015). In contrast, disynaptic IPSCs in slices from PGC-1α−/− mice had paired-pulse depression (Fig. 5C), indicating that short-term plasticity of inhibition is different between the two genotypes. We next measured paired-pulse responses of somatic targeting monosynaptic inhibition (in NBQX) and found that monosynaptic IPSCs had paired-pulse depression in slices from PGC-1α+/+ mice (Fig. 5D), consistent with what has been reported previously (Davies et al., 1990; Klyachko and Stevens, 2006; Bartley and Dobrunz, 2015). Somatic monosynaptic IPSCs in slices from PGC-1α−/− mice also had paired-pulse depression (Fig. 5D). At short intervals, however, the paired-pulse ratio of somatic monosynaptic IPSCs was greater in PGC-1α−/− mice compared with PGC-1α+/+ mice (Fig. 5D), consistent with what was previously observed in dentate granule cells (Lucas et al., 2010). The enhanced paired-pulse ratio at the short interval was seen for a range of stimulus intensities above threshold (Fig. 5E). This is most likely caused by the reduction in calcium buffering by parvalbumin (Caillard et al., 2000) rather than indicating a decrease in the initial release probability because the increased mIPSC frequency (Fig. 3A2) and decreased CV (Figs. 3E,F) suggest that the GABA release probability is enhanced in slices from PGC-1α−/− mice. The effect on short-term plasticity of monosynaptic inhibition is specific for somatic synapses; there was no significant difference in the paired-pulse ratio of dendritic monosynaptic IPSCs at any interval (Fig. 5F) or at the short interval across a range of stimulus intensities (Fig. 5G).
We have shown previously that the difference in short-term plasticity between disynaptic IPSCs (paired-pulse facilitation) and monosynaptic IPSCs (paired-pulse depression) is caused by an increase in the recruitment (spiking) of interneurons on the second pulse compared with the first pulse in slices from wild-type mice (Bartley and Dobrunz, 2015). Here, we show that disynaptic IPSCs in slices from PGC-1α−/− mice have paired-pulse depression instead of facilitation, which cannot be accounted for by differences in the properties of the inhibitory synapses themselves. Specifically, the monosynaptic IPSC amplitude on the second pulse of the 60 ms interval is 2-fold larger in the PGC-1α−/− mice (PGC-1α+/+ 48.2 ± 12.2 pA vs PGC-1α−/− 103.7 ± 19.4 pA; Student's t test, p < 0.05). However, the disynaptic IPSC amplitude on the second pulse of the 60 ms interval is not significantly different between the two genotypes (PGC-1α+/+ 238.6 ± 36.8 pA vs PGC-1α−/− 179.0 ± 36.8 pA; Student's t test, p = 0.26). Together, these data suggest that the enhanced interneuron recruitment that normally happens on the second pulse (compared with the first pulse) is impaired in PGC-1α−/− mice. Overall, our data show that the altered dynamics of the I/E ratio in slices from PGC-1α−/− mice are caused by changes in short-term plasticity of disynaptic inhibition, most likely through alterations in interneuron recruitment on the second pulse.
Alterations in the CA1 microcircuit are frequency dependent
We next tested how short-term plasticity affects the CA1 microcircuit in PGC-1α−/− mice using voltage-sensitive dye imaging (Fig. 6A–G) to measure the spatiotemporal spread of activity in CA1 in response to Schaffer collateral stimulation on the second pulse at two intervals, 50 and 500 ms. The voltage-sensitive dye response has returned to baseline levels before the start of the second pulse at these two intervals, preventing any cumulative effects on the signal. Although the spread of activation was greatly reduced in slices from PGC-1α−/− mice on the first pulse (Fig. 2A–D), example images show that the spread of activity in CA1 is similar between PGC-1α−/− and PGC-1α+/+ on the second pulse in a 50 ms paired-pulse interval (Fig. 6A). Group results show that the amplitude (Fig. 6B) and spatial spread (Fig. 6C) of the voltage-sensitive dye signal are not significantly different on the second pulse of the 50 ms interval. This is consistent with the fact that the disynaptic IPSC amplitude is no longer different between the genotypes at the short paired-pulse interval. However, the duration (Fig. 6D) of activation at 50 ms is still diminished in PGC-1α−/− mice. The effect is frequency dependent because, at the 500 ms interval, the spatial spread of activity (Fig. 6F) is also reduced in PGC-1α−/− mice in addition to the duration (Fig. 6G).
Figure 6.
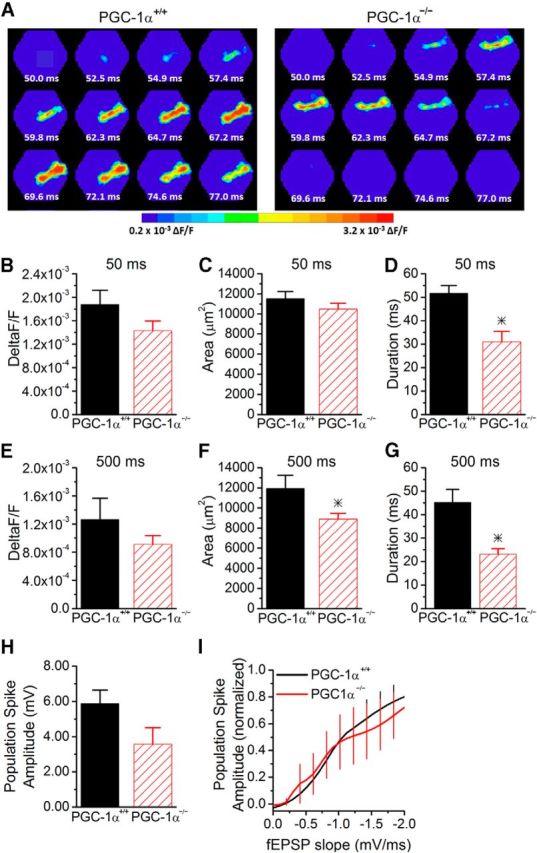
Partial restoration of circuit function at short paired-pulse intervals in PGC-1α−/− mice. A, Example images of the spatiotemporal pattern of voltage-sensitive dye signals evoked in CA1 by Schaffer collateral stimulation in slices from PGC-1α+/+ and PGC-1α−/− mice from the second pulse in a paired-pulse stimulation at a 50 ms interval. B, The maximum amplitude of the voltage-sensitive dye response is similar on the second pulse (n = 12, 7). C, The spread of the response is unchanged (n = 12, 7). D, The duration of the response is reduced at the 50 ms interval on the second pulse in PGC-1α−/− mice (n = 12, 7). E, The maximum amplitude of the voltage-sensitive dye response is not significantly different on the second pulse of a 500 ms interval (n = 11, 7). F, The spread of the response is decreased at the 500 ms interval (n = 11, 7). G, The duration of the response is decreased at the 500 ms interval in the PGC-1α−/− mice (n = 11, 7). H, Population spike amplitudes were measured in stratum pyramidale on the second pulse of paired-pulse stimulation at a 60 ms interval. The maximum population spike generated in the PGC-1α−/− mice (n = 6) is not significantly reduced compared with PGC-1α+/+ mice (n = 9). I, EPSP-spike coupling was measured on the second pulse at a 60 ms interval in response to stimulation of Schaffer collateral axons. The average Boltzmann curve for each group is displayed. In PGC-1α−/− mice, the output from CA1 pyramidal cells is now similar to PGC-1α+/+ mice (ANOVA, F(14, 749) = 1.87, p = 0.09, n = 9, 6). *p < 0.05, Student's t test.
Short-term plasticity caused an increase in the population spike amplitude on the second pulse (compared with the first pulse) at a short paired-pulse interval (60 ms) for both PGC-1α+/+ and PGC-1α−/− mice (compare Figs. 6H, 2F). However, there is a trend for the maximum population spike to still be reduced at this interval in PGC-1α−/− mice compared with PGC-1α+/+ mice (p < 0.1; Fig. 6H). The EPSP-spike coupling curve between genotypes is similar at a short paired-pulse interval (Fig. 6I). This shows that the enhanced I/E balance due to loss of PGC-1α causes a large decrease in synaptically evoked spiking of CA1 pyramidal cells at low frequencies; however, higher frequencies have partial restoration of the synaptically evoked spiking. Therefore, the impairment of hippocampal output is frequency dependent.
Gamma oscillations are enhanced in PGC-1α−/− mice
Transcriptional dysfunction caused by the deletion of PGC-1α increases inhibition from parvalbumin interneurons (Fig. 3I), which are important for regulating gamma oscillations (Bartos et al., 2007). However, the effect on inhibition and the I/E ratio is frequency dependent, making it difficult to predict the effects on gamma oscillations in response to the loss of PGC-1α. To determine if gamma oscillations are altered in PGC-1α−/− mice, we recorded from the CA3 pyramidal layer and bath applied 100 nm kainate, which has been shown to induce gamma oscillations that are regulated by parvalbumin interneurons (Fuchs et al., 2007). We observed an increase in the power of kainate-induced gamma oscillations in slices from PGC-1α−/− mice (Fig. 7). The power from 20 to 80 Hz was increased (Fig. 7C), as was the peak power (Fig. 7D), but there was no difference in the peak frequency (Fig. 7E). This indicates that, even with a partial rescue of circuit function in response to short-term plasticity, the circuit is still impaired.
Figure 7.
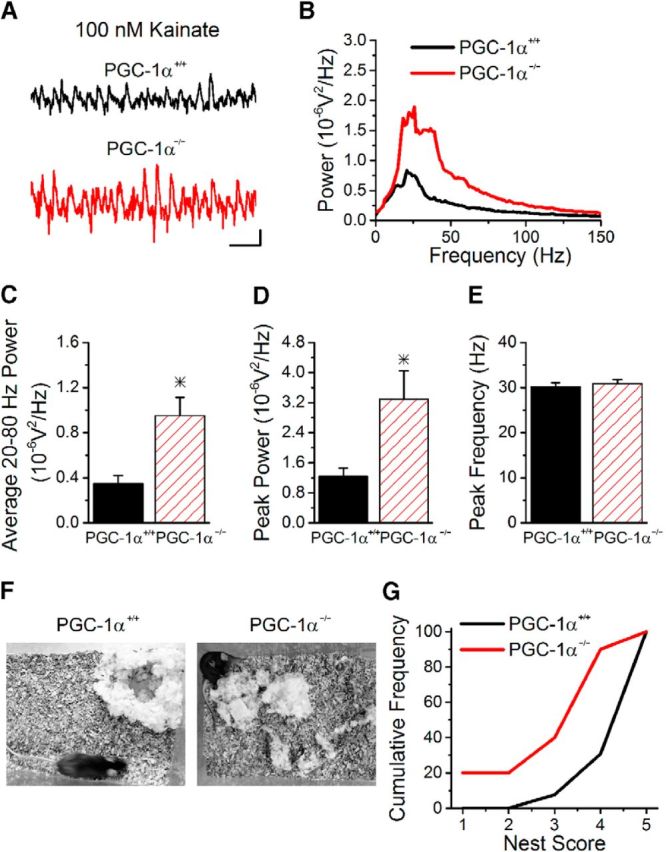
Loss of PGC-1α enhances gamma oscillations and impairs nest building. A, Example traces of oscillations recorded in stratum pyramidale in CA3 in slices from PGC-1α+/+ (top) and PGC-1α−/− (bottom) mice after application of 100 nm kainate. Scale bars, 100 ms, 0.02 mV. B, Group results for the power as a function of frequency (n = 19 slices, 4 mice PGC-1α+/+; n = 18 slices, 4 mice PGC-1α−/−). C, The average power in the gamma range (20–80 Hz) is enhanced in PGC-1α−/− mice. D, The peak power is enhanced in PGC-1α−/− mice. E, However, the peak frequency is not altered between the two genotypes. F, Example images of nests built by PGC-1α+/+ and PGC-1α−/− mice after 18 h. The nest generated by the PGC-1α+/+ mouse scored a 5, whereas the nest built by the PGC-1α−/− mouse scored a 3. G, PGC-1α−/− mice build nests with lower scores compared with PGC-1α+/+ mice (n = 13, 10). *p < 0.05, Student's t test.
PGC-1α−/− mice exhibit nesting dysfunction
The line of global PGC-1α−/− mice used in this study have severe motor deficits (Lucas et al., 2012), making them unsuitable for most hippocampal-dependent learned behavioral tasks. We therefore tested for differences in nest building, which is a hippocampal-dependent nonlearned innate behavior (Deacon et al., 2002). Figure 7F shows example nests built by PGC-1α+/+ and PGC-1α−/− mice. Nest quality was scaled from 1 to 5, with lower numbers indicating impairment (Deacon et al., 2002). PGC-1α−/− mice scored poorly in nest formation compared with PGC-1α+/+ littermates (Fig. 7G), indicating impairment in hippocampal circuit function (Duszczyk et al., 2006; Etherton et al., 2009). The average nest score was reduced (PGC-1α−/− 3.1 ± 0.4 vs PGC-1α+/+ 4.7 ± 0.2; Student's t test, p < 0.05) and some PGC-1α−/− mice failed to build any nests at all (score of 1; Fig. 7G). There was no difference in the average nest score between male and female mice (Student's t test, p > 0.3, data not shown).
Loss of PGC-1α only in parvalbumin-expressing interneurons recapitulates phenotypes observed in the global PGC-1α knock-out
A previous study showed that mice with PGC-1α deleted only from parvalbumin interneurons [parvalbumin-Cre (PV-Cre) mice crossed with floxed PGC-1α (PGC-1αfl/fl) mice] have a deficit in the Barnes maze task (Lucas et al., 2014), indicating impairment of hippocampal-dependent learning. However, the effects of PGC-1α deletion only from parvalbumin cells on the I/E ratio and circuit function in hippocampus have not been determined. Neuroanatomical location of recombination was assessed by crossing PV-Cre mice with a line of reporter mice and confirming localization of reporter fluorescence with parvalbumin immunoreactivity in hippocampus (Fig. 8A). We next measured the extent of PGC-1α regulation of parvalbumin, synaptotagmin 2, and complexin 1 in parvalbumin-positive hippocampal interneurons by comparing transcript expression in hippocampal homogenates from PGC-1αfl/fl:PV-Cre mice with homogenates from PGC-1αWT:PV-Cre mice. Expression of parvalbumin (t(23) = 4.6, p = 5.6 × 10⁻⁵), synaptotagmin 2 (t(23) = 4.0, p = 0.0003), and complexin 1 (t(23) = 7.4, p = 7.7 × 10⁻⁸) were all dramatically decreased in PGC-1αfl/fl:PV-Cre mice (Fig. 8B), similar to global (germline) PGC-1α−/− mice (Fig. 4A). We also found that the amplitude of disynaptic IPSCs (Fig. 8C) and the I/E ratio (Fig. 8D) were enhanced in CA1 pyramidal cells in slices from the PGC-1αfl/fl:PV-Cre mice compared with PGC-1αWT:PV-Cre mice, demonstrating that deletion of PGC-1α only from parvalbumin interneurons causes enhanced inhibition and I/E imbalance. The loss of PGC-1α only in parvalbumin interneurons was sufficient to reduce the basal activation of CA1; the maximum amplitude and the spread of excitation were reduced in voltage sensitive dye experiments, although the duration of the response remained unchanged (Fig. 9A–D). The effect of PGC-1α deletion on CA1 microcircuit function remains frequency dependent because the maximum amplitude and the spread of excitation on the second pulse at a 50 ms interval were similar between both genotypes (Fig. 9E–G). Furthermore, PGC-1αfl/fl:PV-Cre mice have impaired nest building compared with PGC-1αWT:PV-Cre mice (Fig. 9H). The average nest score was reduced (PGC-1αWT:PV-Cre 4.6 ± 0.2 vs PGC-1αfl/fl:PV-Cre 3.7 ± 0.4; Student's t test, p < 0.05). Because PGC-1αfl/fl:PV-Cre mice do not have the motor impairments that occur in the global PGC-1α−/− mice (Lucas et al., 2014), this indicates that the impaired nest building is caused by altered hippocampal circuit function in mice with PGC-1α deletion and not motor dysfunction. Together, these data show that loss of PGC-1α only from parvalbumin interneurons recapitulates the transcriptional dysregulation, enhanced inhibition, circuit dysfunction, and impaired nest building behavior seen in the global PGC-1α−/− mice. The enhanced inhibition in the PGC-1αfl/fl:PV-Cre mice is likely to also contribute to the observed impairment in other hippocampal-dependent behaviors in these mice (Lucas et al., 2014).
Figure 8.

Deletion of PGC-1α only from parvalbumin interneurons recapitulates enhanced inhibition and increased I/E ratio seen in global PGC-1α−/−. A, Efficiency and neuroanatomical specificity of recombination by PV-Cre was assessed with a tdTomato reporter mouse. Reporter signal (red) overlapped substantially with immunoreactivity for PV (green; colocalization appears yellow). Scale bar, 200 μm. B, q-RT-PCR revealed significant reductions in transcript expression of PV, Syt2, and Cplx1 in hippocampal homogenates from PGC-1αfl/fl:PV-Cre (n = 12) compared with PGC-1αWT:PV-Cre mice (n = 13). ***p < 0.0005, two-tailed, independent-samples t tests. C, The peak amplitude of disynaptic inhibition measured in CA1 pyramidal cells held at 0 mV is enhanced in PGC-1αfl/fl:PV-Cre mice (n = 9, 14). D, The I/E ratio measured in CA1 pyramidal cells in response to Shaffer collateral stimulation is enhanced in PGC-1αfl/fl:PV-Cre mice (n = 10, 7). *p < 0.05, Student's t test.
Figure 9.
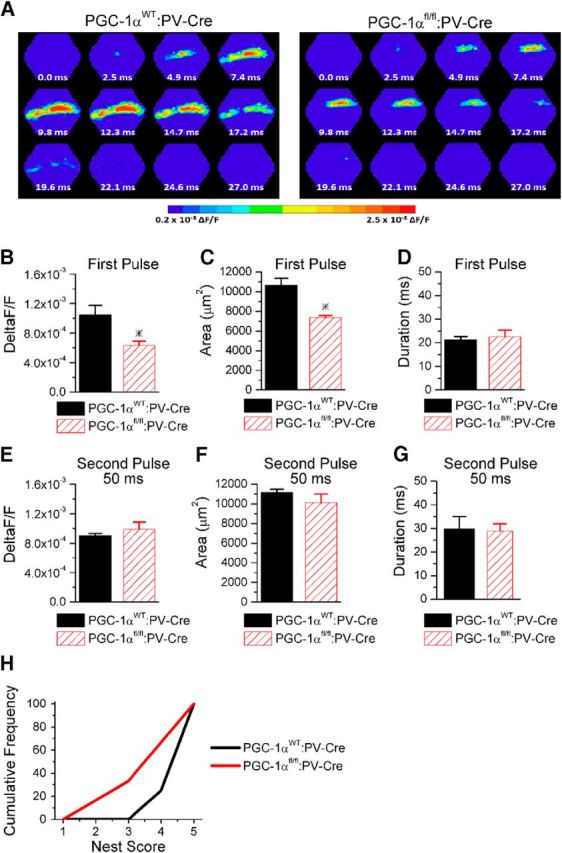
Deletion of PGC-1α only from parvalbumin interneurons recapitulates circuit dysfunction and behavioral impairment seen in global PGC-1α−/−. A, Example images of the spatiotemporal pattern of voltage-sensitive dye signals evoked in CA1 by Shaffer collateral stimulation in slices from PGC-1αWT:PV-Cre mice and PGC-1αfl/fl:PV-Cre mice on the first pulse. B, The maximum amplitude of the voltage-sensitive dye response is reduced on the first pulse (n = 5, 4). C, The spread of the response is reduced (n = 5, 4). D, The duration of the response is unchanged (n = 5, 4). E, The maximum amplitude of the voltage-sensitive dye response is similar on the second pulse at a 50 ms interval (n = 4, 4). F, The spread of the response is unchanged on the second pulse at a 50 ms interval (n = 4, 4). G, The duration of the response is unchanged on the second pulse at a 50 ms interval (n = 4, 4). H, PGC-1αfl/fl:PV-Cre mice (n = 6) build nests with lower scores compared with PGC-1αWT:PV-Cre mice (n = 8). *p < 0.05, Student's t test.
Discussion
Alteration in the I/E balance is emerging as a feature underlying the circuit dysfunction observed across a wide spectrum of neuropsychiatric and neurodevelopmental disorders. Despite this, little is known about how the dynamics of the I/E balance are altered in animal models of disease. Here, we show that transcriptional dysregulation in interneurons causes frequency-dependent increases in the I/E balance in the CA1 region of hippocampus in PGC-1α−/− mice. The enhancement of the basal I/E ratio is caused by increased GABA release from interneurons, whereas differences in short-term plasticity of disynaptic inhibition enable partial restoration of the I/E balance at short paired-pulse intervals. This large hyperinhibition causes circuit dysfunction, seen as frequency-dependent reductions of CA1 activation and output, as well as increased power of hippocampal gamma oscillations. PGC-1α−/− mice also have impaired nest building, an innate hippocampal-dependent behavior. Deletion of PGC-1α from parvalbumin interneurons recapitulates the enhanced inhibition, circuit dysfunction, and nesting impairment seen in the global PGC-1α−/− mice. Although inhibition from other interneurons is also enhanced, this indicates that PGC-1α regulation of parvalbumin interneurons is essential for normal circuit function and behavior.
The enhanced basal I/E ratio in PGC-1α−/− mice is caused by an increase in the amplitude of disynaptic IPSCs. Because monosynaptic inhibition is also increased, this indicates that the hyperinhibition is caused by alterations at inhibitory synapses. Enhanced transmission from inhibitory synapses is also seen in Down syndrome mice (Kleschevnikov et al., 2004) and mice with an autism-linked mutation in neuroligin-3 (Etherton et al., 2011). The enhanced inhibition must be caused by an increase in GABA release, and not by increased responsiveness to GABA, because the mIPSC amplitude was unchanged. Consistent with this, we see an increase in the frequency of both sIPSCs and mIPSCs, indicating either enhanced GABA release probability or an increase in the number of inhibitory synapses. The decreased CV of monosynaptic IPSCs supports the idea that there is an increase in GABA release probability. However, the paired-pulse ratio of somatic monosynaptic inhibition was increased, which usually indicates a decrease in release probability (Dobrunz et al., 1997; Regehr, 2012), although not always (Sippy et al., 2003; Sun et al., 2009; Walters et al., 2014). In this case, the enhanced paired-pulse ratio is most likely caused by reduced parvalbumin expression (Eggermann and Jonas, 2012) because calcium buffering by parvalbumin is critical for regulating short-term plasticity of inhibition from parvalbumin interneurons (Vreugdenhil et al., 2003; Eggermann and Jonas, 2012). The enhanced basal inhibition is not likely to be secondary to the reduced parvalbumin levels because inhibition from CCK cells is also increased and parvalbumin−/− mice do not have increased basal inhibition (Vreugdenhil et al., 2003; Eggermann and Jonas, 2012). The increased GABA release could potentially be caused by the reduction of complexin 1, which has been shown to increase synaptic vesicle exocytosis (Yang et al., 2010; Yang et al., 2013).
Disynaptic inhibition in wild-type slices has robust paired-pulse facilitation, which we have shown previously to be caused by increased recruitment of feedforward interneurons on the second pulse (Bartley and Dobrunz, 2015). This is caused by enhanced excitatory input, as we and others have shown that most CA1 interneurons have paired-pulse facilitation of their Schaffer collateral inputs (Wierenga and Wadman, 2003; Sun and Dobrunz, 2006; Sun et al., 2009). In contrast, disynaptic inhibition has paired-pulse depression in the PGC-1α−/− mice, suggesting that there is less (or no) facilitation of interneuron recruitment on the second pulse compared with the first pulse in these mice. This could be caused by a frequency-dependent decrease in excitatory input onto interneurons, as has been shown in parvalbumin−/− mice (Wöhr et al., 2015). The reduced recruitment could also be caused by enhanced inhibition onto interneurons, especially because parvalbumin interneurons innervate each other (Fukuda and Kosaka, 2000). The paired-pulse depression of disynaptic inhibition in the PGC-1α−/− mice is not caused by vesicle depletion because the paired-pulse ratio of monosynaptic IPSCs is either unchanged (dendritic) or increased (somatic).
The enhanced basal inhibition in PGC-1α−/− mice causes a large increase in the I/E ratio and reduces CA1 activation, as seen with voltage-sensitive dye imaging. The effect is frequency dependent in that the severity of the I/E imbalance and circuit impairment are reduced at shorter paired-pulse intervals and intermediate at longer paired-pulse intervals. Loss of PGC-1α also decreases hippocampal output in a frequency-dependent manner. There is a large reduction in basal EPSP-spike coupling in PGC-1α−/− mice such that spiking of CA1 pyramidal cells in response to single-pulse Schaffer collateral stimulation is essentially prevented, but spiking is partially restored at a short paired-pulse interval. The restoration of CA1 activation and spiking on the second pulse is consistent with the fact that the amplitude of disynaptic inhibition is no longer enhanced on the second pulse at the short interval. Because the strength of inhibition is important for regulating the time window for integration of multiple inputs to produce spiking (Pouille and Scanziani, 2001; Bartley and Dobrunz, 2015), this is also likely to be severely impaired in a frequency-dependent manner. Together, these data show that interneuron dysfunction caused by transcriptional dysregulation leads to impaired CA1 circuit function, an effect that depends upon stimulus frequency (paired-pulse interval).
We also observe increased power of gamma oscillations in PGC-1α−/− mice. Enhanced gamma oscillation power is thought to increase the functional connectivity between brain regions (Popescu et al., 2009), which is impaired in schizophrenia (Kraguljac et al., 2014), whereas increased gamma frequency has been associated with autism (Dickinson et al., 2015). Reduced parvalbumin levels in PGC-1α−/− mice likely underlie the increased gamma power, which is also observed in parvalbumin−/− mice (Vreugdenhil et al., 2003). Although reduced power of gamma oscillations is associated with behavioral impairment (Fuchs et al., 2007), the effect of heightened gamma oscillation power on behavior is not well understood. No hippocampal-dependent learning deficits were reported in parvalbumin−/− mice, which have behavioral deficits related to autism core symptoms (Wöhr et al., 2015). We find that PGC-1α−/− and PGC-1αfl/fl:PV-Cre mice have impaired nest building, indicating a deficit in an innate hippocampal-dependent behavior. Similarly, Down syndrome mice, which also have enhanced hippocampal inhibition, has impaired nest building (Heller et al., 2014). In addition, we showed previously that PGC-1αfl/fl:PV-Cre mice have impaired learning on the Barnes maze task (Lucas et al., 2014). The increased I/E ratio observed here, as well as the impaired long-term potentiation caused by loss of PGC-1α (Lucas et al., 2010), are likely to underlie these hippocampal-dependent behavioral impairments, although it is possible that the enhanced gamma oscillations also contribute.
Interestingly, the effect of PGC-1α in CA1 is different from what has been observed in motor cortex (Dougherty et al., 2014) and dentate gyrus (Lucas et al., 2010), indicating region-specific effects of PGC-1α on inhibition. Similarly, region-specific effects on I/E are also seen in mice with an autism-linked mutation in neuroligin-3 (Etherton et al., 2011). However, we find that transcriptional targets of PGC-1α (parvalbumin, complexin 1, and synaptotagmin 2) that are reduced in cortex of PGC-1α−/− mice and PGC-1αfl/fl:PV-Cre mice (Lucas et al., 2010; Lucas et al., 2014) are also reduced in hippocampus. Hippocampal parvalbumin interneurons have different molecular properties than cortical parvalbumin interneurons (Kawaguchi and Kubota, 1997; Bezaire and Soltesz, 2013), indicating region-specific differences in parvalbumin interneuron subtypes. It is possible that certain populations of parvalbumin interneurons are more vulnerable to a lack of PGC-1α; for example, prefrontal cortical parvalbumin interneurons are preferentially sensitive to NMDAR blockade in development (Wang et al., 2008; Jiang et al., 2013). Furthermore, it has been shown that different transcripts are regulated by PGC-1α, depending on the cell type and the complement of transcription factors present (Houten and Auwerx, 2004). There may be other PGC-1α-dependent transcripts, which have not yet been identified, that are different between hippocampus and cortex and underlie the different regional effects of PGC-1α on inhibition.
A key result from our study is that the extent of the I/E imbalance and circuit dysfunction in PGC-1α−/− mice is not constant, but instead is modulated by input frequency. This is likely to be true in other disorders, although it is usually not tested. Frequency-dependent modulation will make the I/E imbalance more difficult to treat pharmacologically; a reduction in inhibition that is sufficient to restore the I/E balance at low frequency might cause too little inhibition at higher frequencies. Consistent with this, attempts to correct alterations in the I/E balance in patients with neuropsychiatric diseases through pharmacological modulation of inhibition have had limited success (Taylor and Tso, 2015). Many studies showing changes in I/E balance in animal models of disease use only simple measures of excitation and inhibition such as mEPSCs and mIPSCs. Although such measures indicate changes in excitation or inhibition, they are limited in their ability to predict what the overall effect will be on circuit function. Our results highlight the importance of testing for alterations in I/E ratio using evoked transmission, including disynaptic inhibition as well as monosynaptic inhibition and looking at frequency dependence of the imbalance.
Footnotes
This work was supported by National Institutes of Health (Grants R56MH065328 and R01MH098534 to L.E.D. and Grant P30NS047466), the Civitan International Research Center (Emerging Scholars Award to A.F.B.), and the Evelyn F. McKnight Brain Institute. We thank Dr. Roger Clem (Fishberg Department of Neuroscience, Icahn School of Medicine at Mount Sinai, New York, NY) for assisting with image collection.
The authors declare no competing financial interests.
References
- Albertson AJ, Yang J, Hablitz JJ. Decreased hyperpolarization-activated currents in layer 5 pyramidal neurons enhances excitability in focal cortical dysplasia. J Neurophysiol. 2011;106:2189–2200. doi: 10.1152/jn.00164.2011. [DOI] [PMC free article] [PubMed] [Google Scholar]
- Bartley AF, Dobrunz LE. Short-term plasticity regulates the excitation/inhibition ratio and the temporal window for spike integration in CA1 pyramidal cells. Eur J Neurosci. 2015;41:1402–1415. doi: 10.1111/ejn.12898. [DOI] [PMC free article] [PubMed] [Google Scholar]
- Bartos M, Vida I, Jonas P. Synaptic mechanisms of synchronized gamma oscillations in inhibitory interneuron networks. Nat reviews Neuroscience. 2007;8:45–56. doi: 10.1038/nrn2044. [DOI] [PubMed] [Google Scholar]
- Benes FM, Berretta S. GABAergic interneurons: implications for understanding schizophrenia and bipolar disorder. Neuropsychopharmacology. 2001;25:1–27. doi: 10.1016/S0893-133X(01)00225-1. [DOI] [PubMed] [Google Scholar]
- Berghuis P, Dobszay MB, Ibanez RM, Ernfors P, Harkany T. Turning the heterogeneous into homogeneous: studies on selectively isolated GABAergic interneuron subsets. Int J Dev Neurosci. 2004;22:533–543. doi: 10.1016/j.ijdevneu.2004.07.012. [DOI] [PubMed] [Google Scholar]
- Bezaire MJ, Soltesz I. Quantitative assessment of CA1 local circuits: knowledge base for interneuron-pyramidal cell connectivity. Hippocampus. 2013;23:751–785. doi: 10.1002/hipo.22141. [DOI] [PMC free article] [PubMed] [Google Scholar]
- Caillard O, Moreno H, Schwaller B, Llano I, Celio MR, Marty A. Role of the calcium-binding protein parvalbumin in short-term synaptic plasticity. Proc Natl Acad Sci U S A. 2000;97:13372–13377. doi: 10.1073/pnas.230362997. [DOI] [PMC free article] [PubMed] [Google Scholar]
- Calfa G, Hablitz JJ, Pozzo-Miller L. Network hyperexcitability in hippocampal slices from Mecp2 mutant mice revealed by voltage-sensitive dye imaging. J Neurophysiol. 2011;105:1768–1784. doi: 10.1152/jn.00800.2010. [DOI] [PMC free article] [PubMed] [Google Scholar]
- Chen Y, Dong E, Grayson DR. Analysis of the GAD1 promoter: trans-acting factors and DNA methylation converge on the 5′ untranslated region. Neuropharmacology. 2011;60:1075–1087. doi: 10.1016/j.neuropharm.2010.09.017. [DOI] [PubMed] [Google Scholar]
- Chevaleyre V, Castillo PE. Heterosynaptic LTD of hippocampal GABAergic synapses: a novel role of endocannabinoids in regulating excitability. Neuron. 2003;38:461–472. doi: 10.1016/S0896-6273(03)00235-6. [DOI] [PubMed] [Google Scholar]
- Chittajallu R, Pelkey KA, McBain CJ. Neurogliaform cells dynamically regulate somatosensory integration via synapse-specific modulation. Nat Neurosci. 2013;16:13–15. doi: 10.1038/nn.3284. [DOI] [PMC free article] [PubMed] [Google Scholar]
- Colling SB, Wheal HV. Fast sodium action potentials are generated in the distal apical dendrites of rat hippocampal CA1 pyramidal cells. Neurosci Lett. 1994;172:73–96. doi: 10.1016/0304-3940(94)90665-3. [DOI] [PubMed] [Google Scholar]
- Cowell RM, Blake KR, Russell JW. Localization of the transcriptional coactivator PGC-1alpha to GABAergic neurons during maturation of the rat brain. J Comp Neurol. 2007;502:1–18. doi: 10.1002/cne.21211. [DOI] [PubMed] [Google Scholar]
- Dani VS, Chang Q, Maffei A, Turrigiano GG, Jaenisch R, Nelson SB. Reduced cortical activity due to a shift in the balance between excitation and inhibition in a mouse model of Rett syndrome. Proc Natl Acad Sci U S A. 2005;102:12560–12565. doi: 10.1073/pnas.0506071102. [DOI] [PMC free article] [PubMed] [Google Scholar]
- Davies CH, Davies SN, Collingridge GL. Paired-pulse depression of monosynaptic GABA-mediated inhibitory postsynaptic responses in rat hippocampus. J Physiol. 1990;424:513–531. doi: 10.1113/jphysiol.1990.sp018080. [DOI] [PMC free article] [PubMed] [Google Scholar]
- Deacon R. Assessing burrowing, nest construction, and hoarding in mice. J Vis Exp. 2012;59:e2607. doi: 10.3791/2607. [DOI] [PMC free article] [PubMed] [Google Scholar]
- Deacon RM. Assessing nest building in mice. Nat Protoc. 2006;1:1117–1119. doi: 10.1038/nprot.2006.170. [DOI] [PubMed] [Google Scholar]
- Deacon RM, Croucher A, Rawlins JN. Hippocampal cytotoxic lesion effects on species-typical behaviours in mice. Behav Brain Res. 2002;132:203–213. doi: 10.1016/S0166-4328(01)00401-6. [DOI] [PubMed] [Google Scholar]
- De-May CL, Ali AB. Cell type-specific regulation of inhibition via cannabinoid type 1 receptors in rat neocortex. J Neurophysiol. 2013;109:216–224. doi: 10.1152/jn.00272.2012. [DOI] [PMC free article] [PubMed] [Google Scholar]
- Dickinson A, Bruyns-Haylett M, Jones M, Milne E. Increased peak gamma frequency in individuals with higher levels of autistic traits. Eur J Neurosci. 2015;41:1095–1101. doi: 10.1111/ejn.12881. [DOI] [PubMed] [Google Scholar]
- Dobrunz LE, Huang EP, Stevens CF. Very short-term plasticity in hippocampal synapses. Proc Natl Acad Sci U S A. 1997;94:14843–14847. doi: 10.1073/pnas.94.26.14843. [DOI] [PMC free article] [PubMed] [Google Scholar]
- Dougherty SE, Bartley AF, Lucas EK, Hablitz JJ, Dobrunz LE, Cowell RM. Mice lacking the transcriptional coactivator PGC-1alpha exhibit alterations in inhibitory synaptic transmission in the motor cortex. Neuroscience. 2014;271:137–148. doi: 10.1016/j.neuroscience.2014.04.023. [DOI] [PMC free article] [PubMed] [Google Scholar]
- Duszczyk M, Ziembowicz A, Gadamski R, Lazarewicz JW. Behavioral evaluation of ischemic damage to CA1 hippocampal neurons: effects of preconditioning. Acta Neurobiol Exp (Wars) 2006;66:311–319. doi: 10.55782/ane-2006-1620. [DOI] [PubMed] [Google Scholar]
- Dvorzhak A, Semtner M, Faber DS, Grantyn R. Tonic mGluR5/CB1-dependent suppression of inhibition as a pathophysiological hallmark in the striatum of mice carrying a mutant form of huntingtin. J Physiol. 2013;591:1145–1166. doi: 10.1113/jphysiol.2012.241018. [DOI] [PMC free article] [PubMed] [Google Scholar]
- Eastwood SL, Burnet PW, Harrison PJ. Expression of complexin I and II mRNAs and their regulation by antipsychotic drugs in the rat forebrain. Synapse. 2000;36:167–177. doi: 10.1002/(SICI)1098-2396(20000601)36:3<167::AID-SYN2>3.0.CO%3B2-D. [DOI] [PubMed] [Google Scholar]
- Eggermann E, Jonas P. How the ‘slow’ Ca(2+) buffer parvalbumin affects transmitter release in nanodomain-coupling regimes. Nat Neurosci. 2012;15:20–22. doi: 10.1038/nn.3002. [DOI] [PMC free article] [PubMed] [Google Scholar]
- Etherton MR, Blaiss CA, Powell CM, Südhof TC. Mouse neurexin-1alpha deletion causes correlated electrophysiological and behavioral changes consistent with cognitive impairments. Proc Natl Acad Sci U S A. 2009;106:17998–18003. doi: 10.1073/pnas.0910297106. [DOI] [PMC free article] [PubMed] [Google Scholar]
- Etherton M, Foldy C, Sharma M, Tabuchi K, Liu X, Shamloo M, Malenka RC, Südhof TC. Autism-linked neuroligin-3 R451C mutation differentially alters hippocampal and cortical synaptic function. Proc Natl Acad Sci U S A. 2011;108:13764–13769. doi: 10.1073/pnas.1111093108. [DOI] [PMC free article] [PubMed] [Google Scholar]
- Eyles DW, McGrath JJ, Reynolds GP. Neuronal calcium-binding proteins and schizophrenia. Schizophr Res. 2002;57:27–34. doi: 10.1016/S0920-9964(01)00299-7. [DOI] [PubMed] [Google Scholar]
- Fernandez F, Morishita W, Zuniga E, Nguyen J, Blank M, Malenka RC, Garner CC. Pharmacotherapy for cognitive impairment in a mouse model of Down syndrome. Nat Neurosci. 2007;10:411–413. doi: 10.1038/nn1860. [DOI] [PubMed] [Google Scholar]
- Fox MA, Sanes JR. Synaptotagmin I and II are present in distinct subsets of central synapses. J Comp Neurol. 2007;503:280–296. doi: 10.1002/cne.21381. [DOI] [PubMed] [Google Scholar]
- Fuchs EC, Zivkovic AR, Cunningham MO, Middleton S, Lebeau FE, Bannerman DM, Rozov A, Whittington MA, Traub RD, Rawlins JN, Monyer H. Recruitment of parvalbumin-positive interneurons determines hippocampal function and associated behavior. Neuron. 2007;53:591–604. doi: 10.1016/j.neuron.2007.01.031. [DOI] [PubMed] [Google Scholar]
- Fukuda T, Kosaka T. Gap junctions linking the dendritic network of GABAergic interneurons in the hippocampus. J Neurosci. 2000;20:1519–1528. doi: 10.1523/JNEUROSCI.20-04-01519.2000. [DOI] [PMC free article] [PubMed] [Google Scholar]
- Gandal MJ, Nesbitt AM, McCurdy RM, Alter MD. Measuring the maturity of the fast-spiking interneuron transcriptional program in autism, schizophrenia, and bipolar disorder. PLoS One. 2012;7:e41215. doi: 10.1371/journal.pone.0041215. [DOI] [PMC free article] [PubMed] [Google Scholar]
- Ghazalpour A, Bennett B, Petyuk VA, Orozco L, Hagopian R, Mungrue IN, Farber CR, Sinsheimer J, Kang HM, Furlotte N, Park CC, Wen PZ, Brewer H, Weitz K, Camp DG, 2nd, Pan C, Yordanova R, Neuhaus I, Tilford C, Siemers N, et al. Comparative analysis of proteome and transcriptome variation in mouse. PLoS Genet. 2011;7:e1001393. doi: 10.1371/journal.pgen.1001393. [DOI] [PMC free article] [PubMed] [Google Scholar]
- Gibson JR, Bartley AF, Hays SA, Huber KM. Imbalance of neocortical excitation and inhibition and altered UP states reflect network hyperexcitability in the mouse model of fragile X syndrome. J Neurophysiol. 2008;100:2615–2626. doi: 10.1152/jn.90752.2008. [DOI] [PMC free article] [PubMed] [Google Scholar]
- Glickfeld LL, Atallah BV, Scanziani M. Complementary modulation of somatic inhibition by opioids and cannabinoids. J Neurosci. 2008;28:1824–1832. doi: 10.1523/JNEUROSCI.4700-07.2008. [DOI] [PMC free article] [PubMed] [Google Scholar]
- Heller HC, Salehi A, Chuluun B, Das D, Lin B, Moghadam S, Garner CC, Colas D. Nest building is impaired in the Ts65Dn mouse model of Down syndrome and rescued by blocking 5HT2a receptors. Neurobiol Learn Mem. 2014;116:162–171. doi: 10.1016/j.nlm.2014.10.002. [DOI] [PubMed] [Google Scholar]
- Hettema JM, Webb BT, Guo AY, Zhao Z, Maher BS, Chen X, An SS, Sun C, Aggen SH, Kendler KS, Kuo PH, Otowa T, Flint J, van den Oord EJ. Prioritization and association analysis of murine-derived candidate genes in anxiety-spectrum disorders. Biol Psychiatry. 2011;70:888–896. doi: 10.1016/j.biopsych.2011.07.012. [DOI] [PMC free article] [PubMed] [Google Scholar]
- Hippenmeyer S, Vrieseling E, Sigrist M, Portmann T, Laengle C, Ladle DR, Arber S. A developmental switch in the response of DRG neurons to ETS transcription factor signaling. PLoS Biol. 2005;3:e159. doi: 10.1371/journal.pbio.0030159. [DOI] [PMC free article] [PubMed] [Google Scholar]
- Houten SM, Auwerx J. “PGC-1alpha: turbocharging mitochondria.”. Cell. 2004;119:5–7. doi: 10.1016/j.cell.2004.09.016. [DOI] [PubMed] [Google Scholar]
- Isokawa M, Alger BE. Retrograde endocannabinoid regulation of GABAergic inhibition in the rat dentate gyrus granule cell. J Physiol. 2005;567:1001–1010. doi: 10.1113/jphysiol.2005.094219. [DOI] [PMC free article] [PubMed] [Google Scholar]
- Jiang Z, Cowell RM, Nakazawa K. Convergence of genetic and environmental factors on parvalbumin-positive interneurons in schizophrenia. Front Behav Neurosci. 2013;7:116. doi: 10.3389/fnbeh.2013.00116. [DOI] [PMC free article] [PubMed] [Google Scholar]
- Kawaguchi Y, Kubota Y. GABAergic cell subtypes and their synaptic connections in rat frontal cortex. Cereb Cortex. 1997;7:476–486. doi: 10.1093/cercor/7.6.476. [DOI] [PubMed] [Google Scholar]
- Kleschevnikov AM, Belichenko PV, Villar AJ, Epstein CJ, Malenka RC, Mobley WC. Hippocampal long-term potentiation suppressed by increased inhibition in the Ts65Dn mouse, a genetic model of Down syndrome. J Neurosci. 2004;24:8153–8160. doi: 10.1523/JNEUROSCI.1766-04.2004. [DOI] [PMC free article] [PubMed] [Google Scholar]
- Klyachko VA, Stevens CF. Excitatory and feed-forward inhibitory hippocampal synapses work synergistically as an adaptive filter of natural spike trains. PLoS Biol. 2006;4:e207. doi: 10.1371/journal.pbio.0040207. [DOI] [PMC free article] [PubMed] [Google Scholar]
- Knable MB, Barci BM, Webster MJ, Meador-Woodruff J, Torrey EF, Stanley Neuropathology C. Molecular abnormalities of the hippocampus in severe psychiatric illness: postmortem findings from the Stanley Neuropathology Consortium. Mol Psychiatry. 2004;9:609–620. 544. doi: 10.1038/sj.mp.4001471. [DOI] [PubMed] [Google Scholar]
- Kraguljac NV, White DM, Hadley J, Reid MA, Lahti AC. Hippocampal-parietal dysconnectivity and glutamate abnormalities in unmedicated patients with schizophrenia. Hippocampus. 2014;24:1524–1532. doi: 10.1002/hipo.22332. [DOI] [PMC free article] [PubMed] [Google Scholar]
- Levitt P, Eagleson KL, Powell EM. Regulation of neocortical interneuron development and the implications for neurodevelopmental disorders. Trends Neurosci. 2004;27:400–406. doi: 10.1016/j.tins.2004.05.008. [DOI] [PubMed] [Google Scholar]
- Lewis DA, Hashimoto T. Deciphering the disease process of schizophrenia: the contribution of cortical GABA neurons. Int Rev Neurobiol. 2007;78:109–131. doi: 10.1016/S0074-7742(06)78004-7. [DOI] [PubMed] [Google Scholar]
- Lewis DA, Curley AA, Glausier JR, Volk DW. Cortical parvalbumin interneurons and cognitive dysfunction in schizophrenia. Trends Neurosci. 2012;35:57–67. doi: 10.1016/j.tins.2011.10.004. [DOI] [PMC free article] [PubMed] [Google Scholar]
- Lin J, Wu PH, Tarr PT, Lindenberg KS, St-Pierre J, Zhang CY, Mootha VK, Jäger S, Vianna CR, Reznick RM, Cui L, Manieri M, Donovan MX, Wu Z, Cooper MP, Fan MC, Rohas LM, Zavacki AM, Cinti S, Shulman GI, et al. Defects in adaptive energy metabolism with CNS-linked hyperactivity in PGC-1alpha null mice. Cell. 2004;119:121–135. doi: 10.1016/j.cell.2004.09.013. [DOI] [PubMed] [Google Scholar]
- Lucas EK, Markwardt SJ, Gupta S, Meador-Woodruff JH, Lin JD, Overstreet-Wadiche L, Cowell RM. Parvalbumin deficiency and GABAergic dysfunction in mice lacking PGC-1alpha. J Neurosci. 2010;30:7227–7235. doi: 10.1523/JNEUROSCI.0698-10.2010. [DOI] [PMC free article] [PubMed] [Google Scholar]
- Lucas EK, Dougherty SE, McMeekin LJ, Trinh AT, Reid CS, Cowell RM. Developmental alterations in motor coordination and medium spiny neuron markers in mice lacking pgc-1alpha. PLoS One. 2012;7:e42878. doi: 10.1371/journal.pone.0042878. [DOI] [PMC free article] [PubMed] [Google Scholar]
- Lucas EK, Dougherty SE, McMeekin LJ, Reid CS, Dobrunz LE, West AB, Hablitz JJ, Cowell RM. PGC-1alpha provides a transcriptional framework for synchronous neurotransmitter release from parvalbumin-positive interneurons. J Neurosci. 2014;34:14375–14387. doi: 10.1523/JNEUROSCI.1222-14.2014. [DOI] [PMC free article] [PubMed] [Google Scholar]
- Luscher B, Shen Q, Sahir N. The GABAergic deficit hypothesis of major depressive disorder. Mol Psychiatry. 2011;16:383–406. doi: 10.1038/mp.2010.120. [DOI] [PMC free article] [PubMed] [Google Scholar]
- Madisen L, Zwingman TA, Sunkin SM, Oh SW, Zariwala HA, Gu H, Ng LL, Palmiter RD, Hawrylycz MJ, Jones AR, Lein ES, Zeng H. A robust and high-throughput Cre reporting and characterization system for the whole mouse brain. Nat Neurosci. 2010;13:133–140. doi: 10.1038/nn.2467. [DOI] [PMC free article] [PubMed] [Google Scholar]
- Marder CP, Buonomano DV. Differential effects of short- and long-term potentiation on cell firing in the CA1 region of the hippocampus. J Neurosci. 2003;23:112–121. doi: 10.1523/JNEUROSCI.23-01-00112.2003. [DOI] [PMC free article] [PubMed] [Google Scholar]
- Marquèze B, Boudier JA, Mizuta M, Inagaki N, Seino S, Seagar M. Cellular localization of synaptotagmin I, II, and III mRNAs in the central nervous system and pituitary and adrenal glands of the rat. J Neurosci. 1995;15:4906–4917. doi: 10.1523/JNEUROSCI.15-07-04906.1995. [DOI] [PMC free article] [PubMed] [Google Scholar]
- Mendoza E, Galarraga E, Tapia D, Laville A, Hernandez-Echeagaray E, Bargas J. Differential induction of long term synaptic plasticity in inhibitory synapses of the hippocampus. Synapse. 2006;60:533–542. doi: 10.1002/syn.20331. [DOI] [PubMed] [Google Scholar]
- Miles R, Tóth K, Gulyás AI, Hájos N, Freund TF. Differences between somatic and dendritic inhibition in the hippocampus. Neuron. 1996;16:815–823. doi: 10.1016/S0896-6273(00)80101-4. [DOI] [PubMed] [Google Scholar]
- Möhler H. GABAA receptors in central nervous system disease: anxiety, epilepsy, and insomnia. J Recept Signal Transduct Res. 2006;26:731–740. doi: 10.1080/10799890600920035. [DOI] [PubMed] [Google Scholar]
- Olivetti PR, Noebels JL. Interneuron, interrupted: molecular pathogenesis of ARX mutations and X-linked infantile spasms. Curr Opin Neurobiol. 2012;22:859–865. doi: 10.1016/j.conb.2012.04.006. [DOI] [PMC free article] [PubMed] [Google Scholar]
- Pabst S, Hazzard JW, Antonin W, Sudhof TC, Jahn R, Rizo J, Fasshauer D. Selective interaction of complexin with the neuronal SNARE complex. Determination of the binding regions. J Biol Chem. 2000;275:19808–19818. doi: 10.1074/jbc.M002571200. [DOI] [PubMed] [Google Scholar]
- Pedrós I, Petrov D, Allgaier M, Sureda F, Barroso E, Beas-Zarate C, Auladell C, Pallàs M, Vázquez-Carrera M, Casadesús G, Folch J, Camins A. Early alterations in energy metabolism in the hippocampus of APPswe/PS1dE9 mouse model of Alzheimer's disease. Biochim Biophys Acta. 2014;1842:1556–1566. doi: 10.1016/j.bbadis.2014.05.025. [DOI] [PubMed] [Google Scholar]
- Popescu AT, Popa D, Paré D. Coherent gamma oscillations couple the amygdala and striatum during learning. Nat Neurosci. 2009;12:801–807. doi: 10.1038/nn.2305. [DOI] [PMC free article] [PubMed] [Google Scholar]
- Pouille F, Scanziani M. Enforcement of temporal fidelity in pyramidal cells by somatic feed-forward inhibition. Science. 2001;293:1159–1163. doi: 10.1126/science.1060342. [DOI] [PubMed] [Google Scholar]
- Qin W, Haroutunian V, Katsel P, Cardozo CP, Ho L, Buxbaum JD, Pasinetti GM. PGC-1alpha expression decreases in the Alzheimer disease brain as a function of dementia. Arch Neurol. 2009;66:352–361. doi: 10.1001/archneurol.2008.588. [DOI] [PMC free article] [PubMed] [Google Scholar]
- Regehr WG. Short-term presynaptic plasticity. Cold Spring Harb Perspect Biol. 2012;4:a005702. doi: 10.1101/cshperspect.a005702. [DOI] [PMC free article] [PubMed] [Google Scholar]
- Reynolds GP, Abdul-Monim Z, Neill JC, Zhang ZJ. Calcium binding protein markers of GABA deficits in schizophrenia–postmortem studies and animal models. Neurotox Res. 2004;6:57–61. doi: 10.1007/BF03033297. [DOI] [PubMed] [Google Scholar]
- Roux L, Stark E, Sjulson L, Buzsáki G. In vivo optogenetic identification and manipulation of GABAergic interneuron subtypes. Curr Opin Neurobiol. 2014;26:88–95. doi: 10.1016/j.conb.2013.12.013. [DOI] [PMC free article] [PubMed] [Google Scholar]
- Rubenstein JL, Merzenich MM. Model of autism: increased ratio of excitation/inhibition in key neural systems. Genes Brain Behav. 2003;2:255–267. doi: 10.1034/j.1601-183X.2003.00037.x. [DOI] [PMC free article] [PubMed] [Google Scholar]
- Sawada K, Barr AM, Nakamura M, Arima K, Young CE, Dwork AJ, Falkai P, Phillips AG, Honer WG. Hippocampal complexin proteins and cognitive dysfunction in schizophrenia. Arch Gen Psychiatry. 2005;62:263–272. doi: 10.1001/archpsyc.62.3.263. [DOI] [PubMed] [Google Scholar]
- Sheng B, Wang X, Su B, Lee HG, Casadesus G, Perry G, Zhu X. Impaired mitochondrial biogenesis contributes to mitochondrial dysfunction in Alzheimer's disease. J Neurochem. 2012;120:419–429. doi: 10.1111/j.1471-4159.2011.07581.x. [DOI] [PMC free article] [PubMed] [Google Scholar]
- Sibille E, Morris HM, Kota RS, Lewis DA. GABA-related transcripts in the dorsolateral prefrontal cortex in mood disorders. Int J Neuropsychopharmacol. 2011;14:721–734. doi: 10.1017/S1461145710001616. [DOI] [PMC free article] [PubMed] [Google Scholar]
- Sippy T, Cruz-Martín A, Jeromin A, Schweizer FE. Acute changes in short-term plasticity at synapses with elevated levels of neuronal calcium sensor-1. Nat Neurosci. 2003;6:1031–1038. doi: 10.1038/nn1117. [DOI] [PMC free article] [PubMed] [Google Scholar]
- Speed HE, Dobrunz LE. Developmental decrease in short-term facilitation at Schaffer collateral synapses in hippocampus is mGluR1 sensitive. J Neurophysiol. 2008;99:799–813. doi: 10.1152/jn.00625.2007. [DOI] [PubMed] [Google Scholar]
- Sun HY, Dobrunz LE. Presynaptic kainate receptor activation is a novel mechanism for target cell-specific short-term facilitation at Schaffer collateral synapses. J Neurosci. 2006;26:10796–10807. doi: 10.1523/JNEUROSCI.2746-06.2006. [DOI] [PMC free article] [PubMed] [Google Scholar]
- Sun HY, Lyons SA, Dobrunz LE. Mechanisms of target-cell specific short-term plasticity at Schaffer collateral synapses onto interneurones versus pyramidal cells in juvenile rats. J Physiol. 2005;568:815–840. doi: 10.1113/jphysiol.2005.093948. [DOI] [PMC free article] [PubMed] [Google Scholar]
- Sun HY, Bartley AF, Dobrunz LE. Calcium-permeable presynaptic kainate receptors involved in excitatory short-term facilitation onto somatostatin interneurons during natural stimulus patterns. J Neurophysiol. 2009;101:1043–1055. doi: 10.1152/jn.90286.2008. [DOI] [PMC free article] [PubMed] [Google Scholar]
- Taylor SF, Tso IF. GABA abnormalities in schizophrenia: a methodological review of in vivo studies. Schizophr Res. 2015;167:84–90. doi: 10.1016/j.schres.2014.10.011. [DOI] [PMC free article] [PubMed] [Google Scholar]
- Torborg CL, Nakashiba T, Tonegawa S, McBain CJ. Control of CA3 output by feedforward inhibition despite developmental changes in the excitation-inhibition balance. J Neurosci. 2010;30:15628–15637. doi: 10.1523/JNEUROSCI.3099-10.2010. [DOI] [PMC free article] [PubMed] [Google Scholar]
- Vreugdenhil M, Jefferys JG, Celio MR, Schwaller B. Parvalbumin deficiency facilitates repetitive IPSCs and gamma oscillations in the hippocampus. J Neurophysiol. 2003;89:1414–1422. doi: 10.1152/jn.00576.2002. [DOI] [PubMed] [Google Scholar]
- Walters BJ, Hallengren JJ, Theile CS, Ploegh HL, Wilson SM, Dobrunz LE. A catalytic independent function of the deubiquitinating enzyme USP14 regulates hippocampal synaptic short-term plasticity and vesicle number. J Physiol. 2014;592:571–586. doi: 10.1113/jphysiol.2013.266015. [DOI] [PMC free article] [PubMed] [Google Scholar]
- Wang CZ, Yang SF, Xia Y, Johnson KM. Postnatal phencyclidine administration selectively reduces adult cortical parvalbumin-containing interneurons. Neuropsychopharmacology. 2008;33:2442–2455. doi: 10.1038/sj.npp.1301647. [DOI] [PubMed] [Google Scholar]
- Wierenga CJ, Wadman WJ. Excitatory inputs to CA1 interneurons show selective synaptic dynamics. J Neurophysiol. 2003;90:811–821. doi: 10.1152/jn.00865.2002. [DOI] [PubMed] [Google Scholar]
- Wöhr M, Orduz D, Gregory P, Moreno H, Khan U, Vorckel KJ, Wolfer DP, Welzl H, Gall D, Schiffmann SN, Schwaller B. Lack of parvalbumin in mice leads to behavioral deficits relevant to all human autism core symptoms and related neural morphofunctional abnormalities. Transl Psychiatry. 2015;5:e525. doi: 10.1038/tp.2015.19. [DOI] [PMC free article] [PubMed] [Google Scholar]
- Yang X, Kaeser-Woo YJ, Pang ZP, Xu W, Südhof TC. Complexin clamps asynchronous release by blocking a secondary Ca(2+) sensor via its accessory alpha helix. Neuron. 2010;68:907–920. doi: 10.1016/j.neuron.2010.11.001. [DOI] [PMC free article] [PubMed] [Google Scholar]
- Yang X, Cao P, Südhof TC. Deconstructing complexin function in activating and clamping Ca2+-triggered exocytosis by comparing knock-out and knockdown phenotypes. Proc Natl Acad Sci U S A. 2013;110:20777–20782. doi: 10.1073/pnas.1321367110. [DOI] [PMC free article] [PubMed] [Google Scholar]