

Abstract
Legionella pneumophila is a Gram-negative opportunistic human pathogen that causes a severe pneumonia known as Legionnaires' disease. Notably, in the human host, the organism is believed to replicate solely within an intracellular compartment, predominantly within pulmonary macrophages. Consequently, successful therapy is predicated on antimicrobials penetrating into this intracellular growth niche. However, standard antimicrobial susceptibility testing methods test solely for extracellular growth inhibition. Here, we make use of a high-throughput assay to characterize intracellular growth inhibition activity of known antimicrobials. For select antimicrobials, high-resolution dose-response analysis was then performed to characterize and compare activity levels in both macrophage infection and axenic growth assays. Results support the superiority of several classes of nonpolar antimicrobials in abrogating intracellular growth. Importantly, our assay results show excellent correlations with prior clinical observations of antimicrobial efficacy. Furthermore, we also show the applicability of high-throughput automation to two- and three-dimensional synergy testing. High-resolution isocontour isobolograms provide in vitro support for specific combination antimicrobial therapy. Taken together, findings suggest that high-throughput screening technology may be successfully applied to identify and characterize antimicrobials that target bacterial pathogens that make use of an intracellular growth niche.
INTRODUCTION
Legionella pneumophila is a Gram-negative pathogen that causes a severe pneumonia in humans known as Legionnaires' disease (1). Legionella bacteria grow inside protozoa and freshwater biofilms. They adventitiously infect humans when aerosolized and inhaled by susceptible hosts. The pneumonia may be severe and result in permanent lung damage or death.
Interestingly, the same molecular machinery which allows L. pneumophila to grow inside diverse protozoa also allows it to grow intracellularly within pulmonary macrophages (2). Growth within pulmonary macrophages is a prerequisite for and the cause of human pneumonia. Indeed, L. pneumophila is not known to grow extracellularly in the human body as high sodium concentrations found in extracellular compartments have been shown to inhibit bacterial replication (3). No evidence for extracellular growth has been found during examination of human biopsy or autopsy specimens (4).
A reasonable prediction therefore would be that antimicrobials that efficiently access intracellular compartments would prove most efficacious in treating L. pneumophila. Not surprisingly, over 40 years of clinical experience treating Legionnaires' disease support this assumption. Specifically, antimicrobials that show high intracellular penetration, such as quinolones and later-generation macrolides, are effective treatments (5). In contrast, polar antibiotics such as β-lactam agents and aminoglycosides are not. These observations contrast with in vitro, axenic (extracellular) antimicrobial susceptibility data where both polar and nonpolar antibiotics generally demonstrate efficacy (6).
Traditionally, susceptibility testing involves growth of organisms in medium in the presence of serial double dilutions of the antimicrobial. The lowest 2-fold dilution of antimicrobial that inhibits growth is called the MIC. The MIC is used to predict clinical susceptibility or resistance of an organism based on antimicrobial pharmacokinetic and pharmacodynamic properties. For many antimicrobial-organism combinations, MIC breakpoints for categorizing organism susceptibility and resistance have been defined by consensus standards (e.g., those of the Clinical and Laboratory Standards Institute [CLSI] and the European Committee on Antimicrobial Susceptibility Testing [EUCAST]). However, no formal guidelines exist for Legionella. Nevertheless, susceptibility cutoffs may practically be extrapolated based on guidelines for other Gram-negative organisms. Yet, as mentioned previously, effects on extracellular organisms (traditional antimicrobial susceptibility testing) may not reliably predict efficacy against intracellular organisms.
Therefore, performing meaningful susceptibility testing on pathogens that make use of an intracellular growth niche, such as L. pneumophila, requires use of more complex testing systems, i.e., testing effects on intracellular growth. A number of studies have examined the growth-inhibitory effects on L. pneumophila grown in primary macrophages or macrophage cell lines (reviewed by Pedro-Botet and Yu [7]). Experimentally, intracellular L. pneumophila growth assays are technically laborious, requiring plating of serial dilutions of macrophage lysates at different time points to quantify antimicrobial effects on intracellular bacterial numbers. Therefore, prior studies have generally tested a small number of antimicrobials at a limited range of antimicrobial concentrations and explored antimicrobial synergy in an abbreviated fashion if at all.
Here, we describe the use of high-throughput technology to screen for the intracellular inhibitory effects of a large numbers of antimicrobials. Based on initial findings, we apply additional automation to perform detailed examination of both intracellular and extracellular effects of select antimicrobials both alone and in two-dimensional and three-dimensional synergy tests.
MATERIALS AND METHODS
Macrophage infection and bacterial culture.
The J774A.1 macrophage cell line (American Type Culture Collection, Manassas, VA) was grown in RPMI 1640 medium (Cellgro, Corning/Mediatech, Manassas, VA) containing 9% iron-supplemented calf serum (Atlanta Biologicals, Flowery Branch, GA) and 100 μg/ml thymidine. One day prior to intracellular growth experiments, J774A.1 cells were replated, in the same medium lacking phenol red, on white Corning 3570, 384-well microplates (Corning Life Sciences, Inc., Tewksbury, MA) to achieve approximately 90% confluence. This plating density corresponds to 5 × 10⁴ cells per well or 1.92 × 10⁶ cells per 384-well dish.
The Legionella pneumophila serogroup 1 screening strain, Lp02::flaA::lux, used in experiments was constructed in Bill Dietrich's laboratory (8) and provided to us by Andrew Olive (Harvard Medical School, Boston, MA). This strain is a streptomycin-resistant, thymidine auxotroph (resulting from mutational inactivation of the thymidylate synthase gene) (9). It was further modified to constitutively express a bacterial lux operon and through deletion of the flagellin gene (8, 10). Flagellin is translocated in small amounts into the macrophage cytoplasm by the bacterial type IV secretion system and induces pyroptosis of host cells (11). Use of a flagellin mutant therefore prevents early macrophage cell death, which would otherwise reduce intracellular growth and statistical robustness of the intracellular growth assay. Prior to experiments, bacteria were passaged for 1 day on buffered charcoal yeast extract agar supplemented with α-ketoglutarate and thymidine as previously described (10). Bacterial patches were then resuspended in phosphate-buffered saline (PBS) and diluted in tissue culture medium to infect J774A.1 cells at a ratio of approximately one bacterium per macrophage (5 × 10⁴ bacteria per well) in a 50-μl well volume. Alternatively, for axenic growth testing, also performed in the same 384-well format, bacteria were diluted to the same final concentration per 50-μl well volume in N-(2-acetamido)-2-aminoethanesulfonic acid (ACES)-buffered yeast extract medium supplemented with 1.3 mM ferric ammonium citrate, 2 mM dipotassium phosphate, 5.4 mM potassium α-ketoglutarate, 9.1 mM sodium pyruvate, 3.3 mM l-cysteine, and 100 μg/ml thymidine and adjusted to pH 6.9 with potassium hydroxide. Axenic medium was either used immediately or frozen for longer-term use. Aged, nonfrozen medium led to variable growth efficiencies and therefore was avoided (data not shown).
Primary screening.
As previously described (10), compounds from the ICCB-Longwood Screening Facility (Harvard Medical School, Boston, MA) known bioactive collection were added to macrophages using a pin transfer robot, followed by immediate addition of bacteria and SYTOX Green to a 125 nM final concentration. To reduce false positives, each antimicrobial test well was screened in duplicate. Only the result from the test well with the least significant z score was tabulated. For the primary screen, after 2 days of incubation, a log2-fold reduction of bacterial luminescence was determined in comparison to values in the control wells in the same screening plates in which macrophages were infected in the absence of antimicrobial. The z-scores for luminescence, cytotoxicity, and cytopreservation were determined as described in the legend of Table S1 in the supplemental material. Luminescence and fluorescence for all experiments were measured using an EnVision Multi-Label Reader (PerkinElmer, Waltham, MA).
Dose-response testing.
Levofloxacin, doxycycline, tetracycline, amikacin, gentamicin, kanamycin, erythromycin, roxithromycin, ceftriaxone, meropenem, chloramphenicol, florfenicol, and rifampin were purchased from Sigma-Aldrich (St. Louis, MO). Ciprofloxacin, flumequine, gatifloxacin, moxifloxacin, pefloxacin, minocycline, tigecycline, azithromycin, clarithromycin, josamycin, clindamycin, and fusidic acid were purchased from Thermo Fisher Scientific (Pittsburgh, PA). Compounds were dissolved in dimethyl sulfoxide (DMSO) prior to use. An HP D300 high-performance digital dispensing system (Hewlett-Packard, Palo Alto, CA) was used to dispense 2-fold or ⎷2-fold serial dilutions of antimicrobials, alone or in combination, into 384-well plates containing macrophages or axenic growth medium, which were then infected or inoculated with bacteria. DMSO itself (up to 0.8%) had no obvious effect on assay performance (data not shown). Microplates used for macrophage and axenic growth experiments were incubated in parallel at 37°C in 5% CO2 in a humidified atmosphere for 48 h prior to readout. Quantitation of bacterial growth in axenic culture was also based on luminescent readout.
Dose-response curves were plotted, and 50% inhibitory concentrations (IC50s) were calculated in Prism, version 6 (GraphPad Software, Inc., San Diego, CA), based on nonlinear, four-parameter regression analysis. The lowest concentration of antimicrobial tested that led to ≥99% growth inhibition relative to that of uninfected controls was considered the MIC value in dose-response analysis.
Synergy testing.
Two-dimensional synergy tests were generally based on  2-fold serial dilution rather than standard doubling dilution matrices to decrease the inherent error in MIC analysis. Isocontour-based isobolograms were generated using the ListContourPlot function in Wolfram Mathematica, version 10 (Champaign, IL), with x, y, and f input corresponding to the concentrations of the first antimicrobial (x), second antimicrobial (y), and luminescence (f) normalized to values of the control wells (set to 100%) in which no antibiotic was added.
The sum of the fractional inhibitory concentrations (FIC) of each compound in combinations that led to >99% intracellular growth inhibition was also calculated as described previously (13). Specifically, FICa equals the concentration of antimicrobial a divided by the MIC of compound a alone. FICb equals the concentration of antimicrobial b divided by the MIC of compound b alone. The sum of the fractional inhibition (ΣFIC) then equals FICa + FICb. For concave isobolograms, the lowest determined ΣFIC was used to test for synergy. If a combination demonstrated a convex isobologram, bowing out from the straight line connecting the MICs of each individual antimicrobial, then the greatest ΣFIC among data points marking the 99% inhibition boundary was used to test for antagonism. Based on recent conservative recommendations for doubling dilution schemes (14), ΣFIC values were interpreted as follows: ≤0.5 indicates synergy, 0.5 to ≤4.0 indicates no interaction, and >4 indicates antagonism. Results shown are representative of at least two different experiments, except for florfenicol and ceftriaxone combination testing, which was done once.
For graphical three-dimensional (3D) synergy analysis, the isocontour surface overlying all data points with less than 99% inhibition was drawn with the Mathematica function, ListPlot3D. Colored shading was used only to convey three-dimensionality on a two-dimensional surface. Three-dimensional FIC analysis was performed similarly to two-dimensional analysis, now summing the fractional inhibitory concentrations of three antimicrobials that in combination led to >99% intracellular inhibition. 3D synergy was considered to occur when ΣFIC was ≤0.5 and the 3D ΣFIC was less than any of the ΣFIC values for pairwise combinations of antimicrobials in the same analysis. 3D synergy was performed only using doubling dilution matrices because of the large number of conditions tested (512 per experiment, in triplicate).
RESULTS
Previously we described a high-throughput screening approach and pilot experiments with known bioactive libraries to identify inhibitors of Legionella pneumophila intracellular growth in J774A.1 macrophages (10). In this assay, intracellular growth could be followed based upon constitutive expression of a bacterial lux operon in the L. pneumophila test strain. Since L. pneumophila does not grow in tissue culture medium, an increase in light output reflects intracellular replication. Prior studies confirm a direct correlation among relative light unit (RLU) output, genome copies, and CFU determinations for intracellular growth (10). Furthermore, as L. pneumophila grows intracellularly, it will eventually kill the host cells. Through inclusion of the impermeable DNA-binding dye, SYTOX Green, in tissue culture medium, we are also able simultaneously to monitor this eukaryotic cell death in real time. Specifically, SYTOX Green enters into nonviable eukaryotic cells that have lost membrane integrity. On binding nuclear DNA, this dye exhibits a large increase in fluorescence, allowing nonviable eukaryotic cells to be easily quantified.
Therefore, intracellular L. pneumophila growth leads to increased luminescence and fluorescence (eukaryotic cell death). Active antimicrobials, in turn, are identified through their reduction of both luminescence and fluorescence signal. Notably, intracellular growth inhibition can also occur through destruction of host cells rather than through direct antibacterial activity. However, such adventitious inhibition of intracellular growth is readily identified by a profile showing low luminescence and high fluorescence.
We now extended our analysis to approximately 8,500 known bioactives, among which were 238 known antimicrobials (Table 1; see also Table S1 in the supplemental material). This allowed us to broadly characterize effects of antimicrobials currently or previously marketed for human and veterinary use against intracellular growth of L. pneumophila. Screening for each test compound was performed in duplicate test plates to reduce false positives, as previously described (10). The correlation between duplicate known antimicrobial test wells proved excellent (Fig. 1), with an R2 of 0.94, supporting highly robust, reproducible assay performance in the 384-well, high-throughput format.
TABLE 1.
Survey of intracellular antimicrobial activity against L. pneumophila by class and/or target
| Class | Compound(s) by activity level (no. of times tested)a |
||||
|---|---|---|---|---|---|
| Strong | Moderate | Weak | Detectable | Inactive | |
| Quinolone | Clinafloxacin,*ciprofloxacin (4),* enoxacin (3),* enrofloxacin (3),* fleroxacin,* flumequine (3),* gatifloxacin (4),* gemifloxacin (2),* levofloxacin (4),* lomefloxacin (5),* moxifloxacin (3),* nadifloxacin (2),* nalidixic acid,*# norfloxacin (4),* ofloxacin (5),* oxolinic acid (4),* pazufloxacin (2),*# pefloxacin (4),* prulifloxacin (3),* sarafloxacin (3),* sparfloxacin,* tosufloxacin (2),* trovafloxacin* | Orbifloxacin, nalidixic acid# | Cinoxacin (4), clinafloxacin, cloxyquin (2), difloxacin, nalidixic acid,# pazufloxacin,# pipemidic acid (2), piromidic acid (2), prulifloxacin | ||
| Macrolide | Azithromycin (5),* clarithromycin (4),* erythromycin(EryPed),*# kitasamycin,* roxithromycin (4),* telithromycin (2),* josamycin (2)* | Methacycline,# troleandomycin,# tylosin (3) | Erythromycin ethyl succinate# | Erythromycin,# troleandomycin# | Desmethyl azithromycin, dirithromycin (3), erythromycin (6),# oleandomycin (3), spiramycin (3), methacycline (2),# tilmicosin, troleandomycin (2)# |
| Tetracycline | Minocycline (5),* doxycycline (5),*# demeclocycline (2),# oxytetracycline (3)# | Demeclocycline (2),# methacycline,# oxytetracycline (4)# | Doxycycline,# tetracycline# | Meclocycline (2),# tetracycline,# oxytetracycline (3)# | Chlortetracycline (3), demeclocycline,# lymecycline, meclocycline,# methacycline (2),# rolitetracycline (2), tetracycline (3),# tigecyclined |
| Aminoglycoside | Amikacin# | Apramycin,# gentamicin# | Amikacin (2),# apramycin (3),# bekanamycin (2), dihydrostreptomycin (3), dibekacin, gentamicin (3),# kanamycin (3), kasugamycin (2), neomycin (4), netilmicin, paromomycin (4), ribostamycin (2), sisomicin (3), spectinomycin (5), streptomycin (4),b dihydrostreptomycin (3),b tobramycin (3) | ||
| Folate inhibitor | Ormetoprim, sulfadimethoxine,# sulfamonomethoxine,# sulfaphenazole# | Sulfachloropyridazine (2),# sulfadiazine (2),# sulfadimethoxine (3),# sulfadoxine (2),# sulfamerazine (2),# sulfameter (2),# sulfamethazine,# sulfamethizole (3), sulfamethoxazole (3), sulfamethoxypyridazine (2),# sulfamonomethoxine (2),# sulfaphenazole (2),# sulfaquinoxaline sodium (2), sulfathiazole (3), sulfisoxazole (2),# trimethoprim (5)c | Acedapsone, dapsone (3), mafenide (3), succinylsulfathiazole (3), sulfabenzamide (3), sulfacarbamide, sulfacetamide (4), sulfachloropyridazine,# sulfadiazine (2),# sulfadoxine (2),# sulfaguanidine (3), sulfamerazine (1),# sulfameter,# sulfamethazine (2),# sulfamethoxypyridazine (1),# sulfanilamide (3), sulfanilate (1), sulfanitran (2), sulfapyridine (3), sulfisoxazole (2)# | ||
| RNA polymerase inhibitor | Actinomycin D, rifabutin (3),* rifampin (5),* rifamycin sv*, rifapentine (2),* rifaximin (2)* | ||||
| Penicillin | Amoxicillin (4), ampicillin (5), azlocillin (3), bacampicillin (2), benzylpenicillin (2), benzathine penicillin, carbenicillin (2), cloxacillin (3), dicloxacillin (4), 6-(2-ethoxy-1-naphthamido)-penicillin, flucloxacillin, hetacillin (2), amdinocillin, metampicillin (2), methacillin (2), moxalactam (2), nafcillin (3), oxacillin (3), penicillin G (Pfizerpen) (2), penicillin V (4), phenethicillin (2), piperacillin (5), pivampicillin, pivmecillinam, talampicillin, ticarcillin (2) | ||||
| Cephalosporin | Cefoperazone,# cefotaxime,# cefoxitin,# ceftazidime,# ceftriaxone (2)# | Cefaclor (3), cefadroxil (3), cefalonium, cefamandole (4), cefatrizine, cefazolin (4), cefdinir (2), cefditoren (2), cefepime (2), cefixime (2), cefmenoxime, cefmetazole (4), cefonicid, cefoperazone (3),# ceforanide, cefotaxime (5),# cefotetan, cefotiam, cefoxitin (2),# cefpiramide, cefpodoxime (2), cefprozil (2), cefsulodin (3), ceftazidime (2),# ceftibuten (2), ceftiofur, ceftriaxone (2),# cefuroxime (5), cephalexin (4), cephaloridine, cephalosporanic acid, cephalosporin c (2), cephalothin (4), cephapirin (2), cepharanthine, cephradine (3) | |||
| Monobactam | Aztreonam (3) | ||||
| Carbapenem | Imipenem (3), meropenem (3) | ||||
| β-Lactamase inhibitor | Sulbactam, tazobactam | ||||
| Ribosome | Chloramphenicol (8),* florfenicol (3),* fusidic acid (2),*# thiostrepton# | Fusidic acid (2)# | Clindamycin (2),# linezolid#, thiostrepton# | Linezolid (2),# thiamphenicol (2)# | Lincomycin (3), clindamycin (3),# thiamphenicol# |
| Tb specific | 4′- Aminosalicylic acid, phenyl aminosalicylate, capreomycin (2), clofazimine (3), cycloserine (6), ethambutol (4), ethionamide (3), isoniazid (5), prothionamide (2), pyrazinamide (5), thiolactomycin | ||||
| Antimicrobial peptide, ionophore | Alamethicin,e colistin (4)e, gramicidin,e monensin (2),#,e polymyxin B (2)e | ||||
| Anticancer | Mitomycin C (4)* | Doxorubicin (3),# daunorubicin (2),# fluorouracil (5) | Bleomycin (2), doxorubicin (2),# daunorubicin (2),# epirubicin | Daunorubicin (2),# doxorubicin (3)# | |
| Antiviral with known antibacterial activityf | AZT (5), gemcitabine (2) | ||||
| Other | Carbadox,# triclosan (2),# hinokitiol | Mupirocin, novobiocin,# triclosan (2)# | Carbadox,# chloroxine,# decoyinine, nitrofurantoin (2),# novobiocin# | Carbadox,# furazolidone,# nitrofurantoin,# novobiocin,# vancomycin# | Actinonin, bacitracin (3), chlorhexidine,# chloroxine (2),# chloroxylenol (2), daptomycin (3), fosfomycin (3), furazolidone (2),# ikarugamycin,e lasalocid (2), metronidazole (4), nifuroxazide, nifursol, nifurtimox, nitrofurantoin,# nitrofurazone (2), monensin (2),# novobiocin,# ornidazole (2), ramoplanin, teicoplanin, tinidazole (4), vancomycin (3),# viomycin |
Numbers in parentheses indicate the number of times compounds were represented and tested in bioactive libraries. Activity is defined as follows: inactive, no significant reduction in luminescence (z score of <3) (10); detectable, <4-fold reduction in luminescence (z score of >3); weak, ≥4-fold reduction in luminescence; moderate, ≥16-fold and <64-fold reduction in luminescence; strong, ≥64 fold reduction in luminescence. Very strong activity (≥256-fold reduction up to complete suppression of luminescence) is indicated by an asterisk (*). The number sign (#) indicates disparate fold reduction values between replicates of the same compound from different libraries. Therefore, antimicrobials are listed in multiple categories. When replicates fall on either side of strong and very strong activity, the designation represents the average fold reduction for all examples of the indicated compound. AZT, zidovudine.
Screening strain has an rpsL mutation and is inherently streptomycin resistant.
Screening strain has a thyA mutation and is inherently trimethoprim resistant.
Tigecycline is subject to oxidative inactivation. Negative screening results are therefore unreliable, as confirmed during the follow-up analysis summarized in Table 2 with freshly made antibiotic solution.
Inactive and/or host cell toxic.
FIG 1.
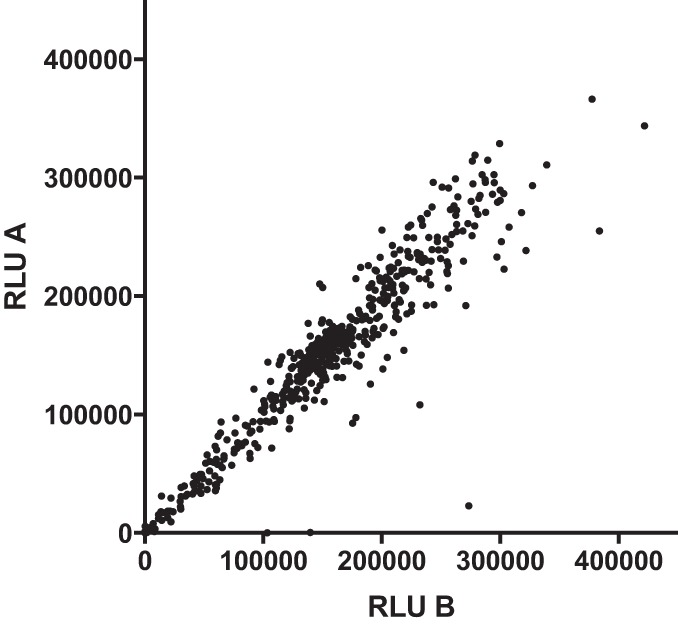
Correlation between replicate antimicrobial screening wells. Each antimicrobial test compound from screening libraries was tested in duplicate in two separate screening plates. Plotted are the relative light units (RLU) on day 2 after macrophage infection for the first replicate versus the second replicate for each antimicrobial test compound listed in Table S1 in the supplemental material.
Although generally only one or two concentrations of each antimicrobial were tested based on inclusion at preset concentrations in known bioactive libraries, concentrations were often in the range of MIC breakpoint susceptibility thresholds used to determine efficacy against Gram-negative organisms (see Table S1 in the supplemental material). Moreover, we could also assess fractional inhibition. Therefore, we predicted that the efficacy of antimicrobials could be established from primary screening data.
Table 1 shows a summary of data for the 238 antimicrobials identified within the known bioactive library screening set. Based on the geometric nature of bacterial growth, we parsed inhibitory effects in log2-fold scale increments. Specifically, compounds were broadly categorized as having detectable, weak, moderate, strong, or very strong activity based on observation of statistically detectable (z score of >3), ≥4-fold, ≥16-fold, ≥64-fold, or ≥256-fold suppression of intracellular growth, respectively.
Notably, several general themes can be observed based on data in Table 1 and in Table S1 in the supplemental material. Quinolone- and rifampin-class antibiotics were almost universally highly active, generally completely eliminating both bacterial growth and bacterial replication-associated macrophage cell death. Later-generation macrolides were generally highly active, in contrast to relatively poor activity of erythromycin. Minocycline and doxycycline appeared especially active among tetracyclines. Chloramphenicol and florfenicol were also potent. In contrast, polar antibiotics such as β-lactams and aminoglycosides were inactive. Interestingly, several chemotherapeutics demonstrated selectivity for L. pneumophila. For example, mitomycin C showed very strong activity against L. pneumophila, presumably based on its DNA cross-linking capability, at a concentration that did not induce overt eukaryotic cell toxicity. Similarly, actinomycin D (an RNA polymerase inhibitor) and several topoisomerase-based chemotherapeutics also demonstrated various levels of activity. Hinokitiol, a natural antimicrobial product used in topical form and previously shown active against axenically grown L. pneumophila, was also a potent inhibitor of L. pneumophila intracellular growth (15–17). Folate pathway antagonists (such as trimethoprim and sulfamethoxazole) generally showed poor to no activity. However, this result should be interpreted with caution as the thyA (thymidylate synthetase) mutation in the L. pneumophila screening strain background confers trimethoprim resistance (18), and thymidine supplementation necessary for its growth likely undermines folate pathway blockade.
Based on screening results, we next examined intracellular and axenic growth inhibition in detail for representative antimicrobials. For these experiments, we took advantage of HP D300 instrumentation, which facilitates large-scale serial dilution experiments. Table 2 shows IC50 and IC99 data for parallel intracellular and axenic growth experiments, respectively. The MIC is standardly defined as the concentration of antimicrobial that inhibits visible growth in test wells. As we used a nonvisual assay for inhibition, we considered the MIC equivalent to the IC99 for our analysis. Figure 2 shows corresponding dose-response curves for selected antimicrobials.
TABLE 2.
Inhibitory characteristics of antimicrobials
| Antimicrobial | Growth inhibition profile (μg/ml)a |
Breakpoint (μg/ml) | Fractional potencym | |||
|---|---|---|---|---|---|---|
| Intracellular |
Axenic |
|||||
| IC50 (95% CI) | MIC | IC50 (95% CI) | MIC | |||
| Ciprofloxacin | 0.011 (0.010–0.012) | 0.030 | 0.0033 (0.0027–0.0040) | 0.016 | 1b,i | 33 |
| Levofloxacin | 0.005 (0.005–0.006) | 0.016 | 0.0039 (0.0037–0.0042) | 0.016 | 2b | 125 |
| Gatifloxacin | 0.0040 (0.0037–0.0043) | 0.016 | 0.0040 (0.0038–0.0043) | 0.016 | 2b | 125 |
| Moxifloxacin | 0.0052 (0.0048–0.0055) | 0.016 | 0.0073 (0.0068–0.0078) | 0.016 | 0.5c,i | 31 |
| Pefloxacin | ∼0.017j | 0.030 | 0.013 (0.012- 0.015) | 0.060 | NA | |
| Flumequine | 0.12 (0.11–0.14) | 0.25 | 0.034 (0.031–0.037) | 0.120 | NA | |
| Rifampin | 0.002(0.002–0.003) | 0.008 | 0.00015 (0.00015–0.00016) | 0.00048 | 1c,h | 125 |
| Minocycline | ∼0.03j | 0.128 | 0.047 (0.041–0.054) | 4 | 4b | 16 |
| Doxycycline | 0.090 (0.076–0.11) | 0.250 | 0.013 (0.011- 0.015) | 0.250 | 4b | 8 |
| Tigecycline | ∼0.12j | 0.480f | 0.71 (0.580.86) | 16 | 2g | 4.2 |
| Tetracycline | 0.11 (0.86–1.4) | 4.0 | 3.5 (0.72–17.0) | >16 | 4b | 1 |
| Erythromycin | 0.37 (0.31- 0.43) | 2.0 | 0.041 (0.036–0.047) | 0.480 | 1c | 0.5 |
| Azithromycin | ∼ 0.063j | 0.25 | 0.010 (0.0091–0.012) | 0.128 | 1c | 4 |
| Josamycin | 0.069 (0.067–0.71) | 0.25 | 0.073 (0.069–0.077) | 0.480 | 2e | 8 |
| Roxithromycin | 0.064 (0.061–0.066) | 0.25 | 0.0045 (0.0041–0.0050) | 0.128 | ≤1d | 4 |
| Clarithromycin | 0.021 (0.019–0.024) | 0.128 | 0.0030 (0.0029–0.0031) | 0.032 | 1d | 8 |
| Chloramphenicol | ∼ 0.25j | 1 | 0.042 (0.038- 0.045) | 1 | 8b | 8 |
| Florfenicol | 0.21 | 0.5 | ND | ND | 2f | 4 |
| Clindamycin | ∼ 1j | 8 | 0.83 (0.72- 0.095) | 8 | 0.5c | 0.06 |
| Fusidic acid | ∼ 1j | 4 | 0.0055 (0.0048–0.0063) | 0.128 | 1d | 0.25 |
| Meropenem | 1.7 (1.2–2.3) | >16, | 0.047 (0.042–0.052) | 0.250 | 1b | <0.06 |
| Ceftriaxone | 0.39 (0.31–0.50) | >16 | 0.015 (0.013- 0.017) | 0.480 | 1b | <0.06 |
| Amikacin | 4.5 (1.2–17.2) | >8 | 1.1(0.89–1.4) | 4 | 16b | ≤1 |
| Gentamicin | ∼4k | >8 | ∼4k | 8 | 4b | ≤0.25 |
| Kanamycin | NAl | >8 | NAl | >8 | 16b | <1 |
The MIC is defined as the lowest concentration that confers greater than 99% reduction (IC99) in luminescent signal in all replicates. CI, confidence interval; ND, not done; NA, not applicable.
Susceptibility breakpoints are based on the Enterobacteriaceae CLSI standard (58).
Susceptibility breakpoints are based on the S. aureus CLSI standard (58).
Susceptibility breakpoints are based on the S. aureus EUCAST standard (59).
Susceptibility breakpoints are based on reference 60.
Susceptibility breakpoints are based on reference 36.
Susceptibility breakpoints are based on U.S. FDA criteria (61).
The EUCAST S. aureus rifampin breakpoint is 0.06 (59).
The EUCAST breakpoints for ciprofloxacin and moxifloxacin are the same at 0.5μg/ml.
Best-fit parameters do not allow unambiguous determination of the IC50. Confidence intervals are therefore not given.
Approximate IC50 determined visually from dose-response graph as four parameter nonlinear regression interpolation was noninformative.
Without activity at all concentrations tested.
Fractional potency is the susceptibility breakpoint divided by the MIC for intracellular growth.
FIG 2.

Dose-response antimicrobial activity against intracellular and axenic L. pneumophila. Serial 2-fold dilutions of select antimicrobials were tested for effect on intracellular and axenic growth, respectively. (A) Effects of antimicrobials mostly commonly used for clinical therapy. (B) Comparison of selected macrolides. (C) Comparison of selected tetracyclines, β-lactams, and additional antimicrobials with activity detected in the primary screen. Data points shown are the averages and standard deviations of three separate test wells per condition.
Growth parameters allowed us to assign relative potencies for antibiotics within given classes. Overall, quinolones showed extremely low MIC and IC50 values in both macrophage infection and axenic growth assays. Notably, levofloxacin, moxifloxacin, and gatifloxacin showed greater intracellular activity than ciprofloxacin (Fig. 2A) and other quinolones tested (Table 2). Among macrolides, azithromycin, josamycin, clarithromycin, and roxithromycin had significantly lower intracellular MICs than erythromycin. In contrast, the effects of macrolides on axenic growth were similar. Among tetracyclines, minocycline showed the lowest intracellular MIC, followed by doxycycline, tigecycline, and then tetracycline. Minocycline's and especially tigecycline's axenic activities were relatively less pronounced. Although the β-lactam antibiotics, meropenem and ceftriaxone, showed excellent axenic potency, intracellular growth inhibition was poor.
Interestingly, we noted that many antimicrobials modestly stimulated luminescence at subinhibitory concentrations (i.e., above levels of the negative control, in which no antimicrobials were added) (Fig. 2). The stimulation was either less pronounced or absent in axenic growth experiments. In general, steeper dose-response slopes were observed in intracellular than in axenic growth inhibition studies, though this effect may also be partially explained by the subinhibitory stimulation of luminescence in the former. Based on comparisons with CFU determinations, this effect likely represents stimulation of lux operon expression rather than an increase in bacterial replication (data not shown).
The intracellular effects of combinations of the individually most potent antimicrobials were next examined in experiments in which serial dilutions of two antimicrobials were tested alone and in combination. Combinatorial effects are often represented as an isobologram that connects the lowest concentrations of antimicrobial combinations that inhibit growth. However, as we had both quantitative and qualitative data for each antibiotic combination, we chose to plot isobologram contours connecting points of equal percent intracellular growth inhibition (selected contour plots are shown in Fig. 3A to F). Table 3 shows the corresponding combinatorial fractional inhibitory concentrations (FIC) for all antimicrobial combinations tested. Results from isocontour plots were visually consistent with FIC analysis. Notably, pairwise combinations of azithromycin, rifampin, and minocycline demonstrated concave isobologram contours and FIC values consistent with synergy (Fig. 3 and Table 3). In contrast, levofloxacin in combination with azithromycin, minocycline, or rifampin demonstrated straight or slightly convex isobologram contours and FIC values indicative of noninteraction (Fig. 3, Table 3, and data not shown). Chloramphenicol showed noninteraction with minocycline, rifampin, azithromycin, or levofloxacin (Table 3 and data not shown). However, it did show borderline synergy with rifampin that straddled the 0.5 FIC cutoff in different experiments. As in single antimicrobial dose-response analysis, subinhibitory concentration stimulation (i.e., isocontour values greater than the 100% negative control) was also observed, most prominently with combinations including the protein synthesis inhibitors, minocycline and azithromycin.
FIG 3.

Isobolograms of minocycline versus azithromycin (A), rifampin versus minocycline (B), rifampin versus azithromycin (C), rifampin versus chloramphenicol (D), levofloxacin versus azithromycin (E), and rifampin versus levofloxacin (F). Isocontours were drawn using Mathematica based on regions of 1, 5, 10, 20, 30, 40, 50, 60, 70, 80, 90, and 100% growth relative to growth in the untreated control. The 99% inhibition contour (1% growth, combinatorial MIC) is the contour line farthest to the right in each plot. Color shading between isocontours was added for clarity. Subinhibitory stimulation of luminescence led to isocontours greater than 100% in some plots. Data points used to generate isocontours were based on the means of three separate test wells per antimicrobial combination.
TABLE 3.
Minimal fractional inhibitory concentration (FIC) summations for pairwise and triple antimicrobial combinations
| Drug combination | FIC sum | Interpretation |
|---|---|---|
| Rifampin + azithromycina | 0.47 | Synergy |
| Minocycline + azithromycina | 0.43 | Synergy |
| Rifampin + minocyclinea | 0.41 | Synergy |
| Chloramphenicol + azithromycin | 0.53 | No interaction |
| Chloramphenicol + rifampina | 0.60 | No interaction |
| Chloramphenicol + minocycline | 0.75 | No interaction |
| Florfenicol + rifampina | 0.68 | No interaction |
| Levofloxacin + minocyclinea | 0.95 | No interaction |
| Levofloxacin + azithromycina | 1.6 | No interaction |
| Levofloxacin + rifampina | 1.36 | No interaction |
| Levofloxacin + chloramphenicol | 2.0 | No interaction |
| Ceftriaxone + azithromycina,b | 0.49 | Synergy |
| Ceftriaxone + levofloxacina,b | 0.88 | No interaction |
| Azithromycin + rifampin + minocycline | 0.325 | Synergy |
| Axis planesc | ||
| Azithromycin × minocycline | 0.383 | |
| Azithromycin × rifampin | 0.375 | |
| Minocycline × rifampin | 0.375 |
FIC data are based on finer √2-fold serial dilution rather on than standard doubling dilution matrices.
FIC data for ceftriaxone combinations shown are for axenic rather than intracellular growth inhibition. Ceftriaxone did not sufficiently suppress intracellular growth at all concentrations tested, thus precluding intracellular FIC analysis.
FIC values for the axis planes are calculated from within the three-dimensional data set. Two-dimensional synergy FIC values for the same antimicrobial combinations shown earlier in the table are from separate experiments.
Based on synergy found in pairwise combinations of rifampin, azithromycin, and minocycline, we asked whether three-way synergy among these antimicrobials might also be present. In three-dimensional (3D) isobologram plots, indifference is indicated by a planar surface connecting the MIC values found for the three antimicrobials individually. However, in 3D testing of rifampin, azithromycin, and minocycline, a high degree of surface concavity was observed instead (Fig. 4), suggesting synergy (19). Two-dimensional synergy along the axis planes for pairwise combinations of the three antimicrobials was also evident as expected. Of note, the 3D ΣFIC value was <0.5 and also less than the ΣFIC for axis planes (pairwise combinations) in the same experiment, supporting the incremental effect from the triple-antimicrobial combination (Table 3). Indeed, very low concentrations of azithromycin, minocycline, and rifampin (16, 8, and 1 ng/ml or 8, 16, and 1 ng/ml, respectively; FIC of 0.325) were required for >99% growth inhibition when these antimicrobials were used in three-way combination. This contrasted with the much larger concentrations (120, 120, and 8 ng/ml, respectively) needed to achieve comparable inhibition when each was used individually in the same experiment. Therefore, 3D FIC data also support multidimensional synergy.
FIG 4.
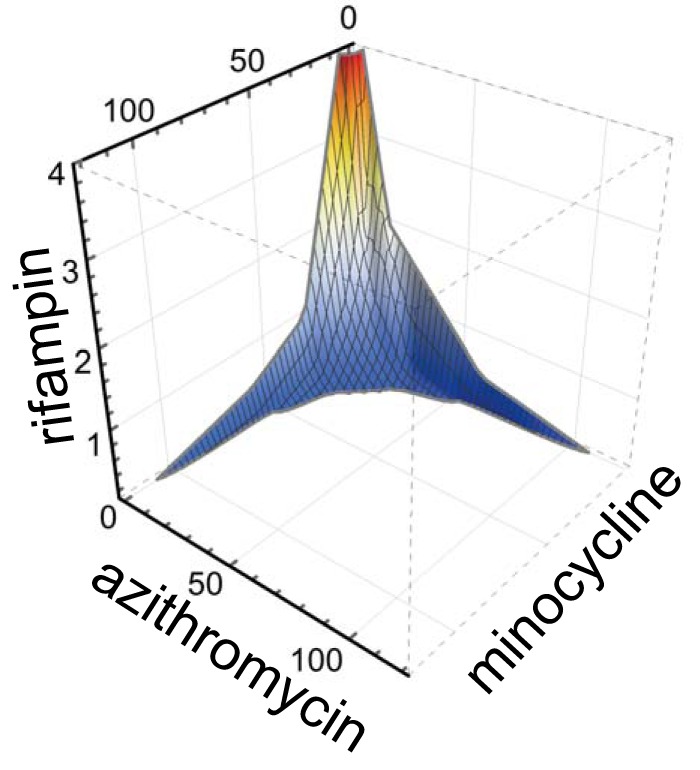
Three-dimensional synergy. The combinatorial effects of azithromycin, minocycline, and rifampin were tested against intracellular growth of L. pneumophila. The plotted surface contour overlies data points for antimicrobial combinations with <99% intracellular growth inhibition relative to that of the uninfected control wells. A high degree of surface concavity suggests three-dimensional synergy. Concentrations along axes are in nanograms/milliliter. A representative experiment is shown; the data set used for graph generation was based on 512 antimicrobial combinations tested in triplicate.
DISCUSSION
Here, we demonstrate use of a high-throughput screening technology to investigate the effects of 238 antimicrobials against intracellular Legionella pneumophila. During primary screening we were able to both identify and quantify effects of antimicrobials. Accordingly, based on the primary screening data set, we identified select antimicrobials for more in-depth dose-response analysis. Here again, we took advantage of high-throughput screening technology, applying HP D300 automation to perform high-resolution doubling and subdoubling dilution experiments, comparing effects on both intracellular and axenic growth.
Notably, effectiveness against intracellular but not axenic (extracellular) growth was remarkably consistent with cumulative observations of clinical efficacy (reviewed in reference 5). Specifically, we observed potent intracellular activity of quinolones and later-generation macrolides (7, 20), now recommended as first-line therapies for Legionella. Among the quinolone class, we noted a left-shifted intracellular dose-response curve for levofloxacin compared to the curve for ciprofloxacin (Fig. 2A) although axenic growth was similarly inhibited by both antimicrobials. Prior studies have documented clinical failure with ciprofloxacin, suggesting the potential clinical superiority of levofloxacin (21, 22), which is consistent with our in vitro findings.
Among macrolides, azithromycin, roxithromycin, josamycin, and clarithromycin showed similar potent effects on intracellular growth. In contrast, erythromycin showed relatively poor intracellular activity, despite a reasonable axenic effect. Results are consistent with prior observations of poorer clinical outcomes associated with erythromycin (23), a macrolide no longer recommended for Legionella therapy.
In our primary screen we also examined a very large number of β-lactams, none of which demonstrated any activity, despite the potency of two tested β-lactams (ceftriaxone and meropenem) under axenic growth conditions. Results from intracellular growth assays were again consistent with clinical observations. Notably, β-lactams have been associated with a high frequency of treatment failure and are not recommended for L. pneumophila treatment (5, 24).
Among tetracycline-class antibiotics, we noted the most left-shifted intracellular dose-response curve for minocycline. Results were consistent with robust effects of minocycline observed previously in a guinea pig infection model (25). Of note, doxycycline is a designated alternative therapy for L. pneumophila in the treatment guidelines of the Infectious Disease Society of America (26) based on limited clinical observations (27). However, in vitro findings suggest that minocycline might have greater potency. These observations will need to be further explored and validated in vivo, taking into account the pharmacokinetics, pharmacodynamics, and safety profiles of the two agents. In contrast to minocycline and doxycycline, tetracycline and tigecycline demonstrated suboptimal intracellular activity (Tables 1 and 2; see also Table S1 in the supplemental material). Previously, tigecycline was noted to inhibit axenic growth and human monocyte-derived macrophage infection (28). However, macrophages used for the latter studies appeared relatively nonpermissive for intracellular growth, thereby potentially accentuating antimicrobial effects. In a guinea pig model, tigecycline led to clinical cure in a substantial fraction of animals; however, 12-day postinfection lung CFU counts were 4 logs higher than those in azithromycin-treated controls (29), also suggesting lower efficacy.
Interestingly, fusidic acid, an elongation factor G turnover inhibitor, showed remarkably potent activity, however, under axenic conditions only. Its clinical use, motivated by axenic MIC testing, was described previously with a presumed curative effect when used in combination with erythromycin (30). However, lack of significant intracellular activity suggests that fusidic acid is unlikely to provide clinical benefit.
Chloramphenicol showed reasonable intracellular activity, as previously suggested in single-concentration experiments (31). However, poor penetrance into lungs in the guinea pig model (32), a trend to poorer outcome for patients in the original Legionnaires' outbreak (5), its association with idiosyncratic bone marrow aplasia, and otherwise very limited clinical experience (33, 34) indicated that it should not be used therapeutically. Interestingly, florfenicol appeared to have similar in vitro activity based on our studies (Tables 1 and 2; see also Table S1 in the supplemental material). However, florfenicol, currently approved only for veterinary use (35), is not associated with bone marrow failure, is immune to inactivation by chloramphenicol acetyltransferase (36), the most prevalent mechanism of chloramphenicol resistance, and achieves excellent penetration into bronchial secretions (37). Therefore, it is potentially worthy of further study for treatment of human pneumonia.
Prior limited in vitro examination of clindamycin demonstrated partial intracellular inhibition of L. pneumophila, albeit without endpoint determination of MIC values (38). Our dose-response analysis suggests poor efficacy, with an MIC significantly above typical susceptibility breakpoint cutoffs (Table 2). There is limited clinical experience with use of clindamycin for L. pneumophila, with anecdotal success (38), however, based on our results, perhaps largely unrelated to antimicrobial efficacy.
Overall, our findings were consistent with those obtained using traditional measures for intracellular growth, where assessed (reviewed in reference 7). However, because of the technical complexity, prior analysis was often abbreviated and performed near, and at some multiples of, the axenic MIC (39–42). This was particularly true for synergy experiments. In contrast, our approach, aided by robotics, was to perform full single and multidimensional dose-response analyses.
Our combinatorial analysis demonstrated synergy for pairwise combinations of azithromycin, minocycline, and rifampin. In contrast, noninteraction was found when levofloxacin was combined with these other agents. Our results were consistent with recent quantitative PCR (qPCR)-based intracellular growth inhibition testing demonstrating synergy for rifampin-macrolide and indifference for erythromycin (macrolide)-levofloxacin and rifampin-levofloxacin combinations, albeit this prior qPCR analysis was confined to a single MIC90 cutoff (43). However, our results differed from those finding axenic synergy for ciprofloxacin-azithromycin (44). It is possible that use of different quinolones or growth conditions account for these discrepant observations. Of note, antagonism was not observed for combinations that might be used for community-acquired pneumonia therapy, specifically, ceftriaxone-azithromycin and ceftriaxone-levofloxacin (26).
To the best of our knowledge, triple-synergy testing results have not previously been reported for L. pneumophila. Here, we found that triple combinations of azithromycin, minocycline, and rifampin were highly synergistic (Fig. 4) to the extent that approximately 10-fold-lower concentrations of each antimicrobial were required in combination than when each was used individually to inhibit intracellular growth. Presumably, triple combinations may thereby provide therapeutic benefit through enhancement of time- and/or concentration-dependent killing in areas of L. pneumophila lung consolidation and abscess formation where antibiotic penetrance may be poor. Our findings therefore provide a rationale for further investigation of triple combinations of these three agents or pairwise combinations among them for treatment of severe Legionnaires' disease.
Several potential limitations of our study should be noted. First, we examined effects on a single Legionella strain. Therefore, results may not necessarily be extrapolated to other Legionella strains and species although prior comparisons suggest relative homogeneity of responses to antimicrobials within the Legionella genus (7). However, our goal was not to perform a comprehensive examination of strains but rather to develop a screening strategy to examine the potential of a large number of antimicrobials. As such, after an initial screen, more traditional methods could then be applied to examine the activity of select antimicrobials identified in the initial screen against any number of strains. In addition, to allow generalization of this screening procedure to other bacterial pathogens, we have recently developed lux operon reporter transposons (Y.-S. Kang and J. Kirby, unpublished data) that allow facile marking of Gram-negative strains of interest (45). Notably, the transposon constructs contain non-antibiotic-based selectable markers that will not interfere with susceptibility testing.
Second, our primary and secondary analysis relied on technology that requires stock antimicrobials in library plates destined for robotic (10) or HP D300 transfer to be dissolved in DMSO. This limited the stock concentrations and therefore determination of clinically relevant upper bounds of dose-response curves for a very small number of hydrophilic compounds, specifically aminoglycosides. Of note, Hewlett Packard has recently introduced new D300 technology that will allow aqueous compound solutions to be similarly dispensed, potentially addressing this issue in secondary analysis.
Third, high-throughput screening technology may be prone to false-negative results with unstable antimicrobials as screening libraries may have undergone several freeze-thaw cycles prior to use. For example, tigecycline was previously noted to require special precautions against oxidative inactivation to preserve activity (46). This instability likely accounts for negative primary screening results (Table 1) (screening concentration of 12 μg/ml), despite an intracellular MIC of 0.48 μg/ml determined in follow-up intracellular dose-response experiments (Table 2) using freshly made antimicrobial solution.
Fourth, it is possible that results might have differed if other host cells were used. However, we believe that J774A.1 macrophages provide a reasonable and advantageous model for the intracellular growth compartment. Notably, the cell biology of intracellular infection appears remarkably similar whether in cell lines such as J774A.1, primary mammalian cells, or protozoa. These observations suggest that J774A.1 provides a representative model for intracellular growth compartments that need to be accessed by antimicrobials (47). In addition, the use of a transformed continuous cell line itself provides benefit as we presume that a protective apoptotic host cell response, that might otherwise compromise the intracellular growth niche (48), is likely suppressed during the process of transformation.
Fifth, use of a thymidine auxotroph screening strain and thymidine supplementation required for its growth may have led to unanticipated effects on antimicrobial activity. To test this, we complemented our screening strain with a thymidylate synthase-expressing plasmid, pKB5 (18), thereby reestablishing thymidine prototrophy. We compared dose-response curves for complemented (no thymidine supplementation) and noncomplemented (thymidine supplementation provided) strains. For compounds tested (azithromycin, erythromycin, minocycline, ciprofloxacin, moxifloxacin, tetracycline, rifampin, and tigecycline and eight novel antimicrobial hits from our larger screening effort), we observed essentially identical dose-response curves (data not shown), suggesting that thymidine auxotrophy and thymidine supplementation are unlikely to have a pervasive effect on screening results. These findings notwithstanding, the choice of screening strain background should be carefully considered when studies with other pathogens are initiated.
Sixth, our screening strategy was designed to detect intracellular growth inhibitors and at the same time to identify potential false positives that limit replication through damage to host cells. Such hits would have low luminescence and high fluorescence (10). However, it is possible that some hits demonstrating this pattern may instead inhibit bacterial replication directly, while still allowing bacterial toxic effects on host cells to be manifest. These hits might provide further insight into pathogenesis and could be identified in secondary screening assays by the absence of toxicity toward uninfected host cells.
Seventh, it may not be appropriate to extrapolate in vitro effectiveness of synergy combinations to a clinical setting. There may be drug-drug interactions or pharmacological considerations that preclude combinatorial use. However, in vitro synergy results can suggest a starting point for further investigation.
With these limitations in mind, we do believe that our model system has several advantages in addition to automation. First, our assay read-out for bacterial growth is a real-time, nondestructive assay. Second, we can also detect real-time effects on eukaryotic cell toxicity that might adventitiously lower intracellular growth. Third, real-time analysis allows multiple types of additional experiments to be performed simply. For example, reversibility of antimicrobial effects can be modeled in single test wells, by simple removal of antibiotics through medium exchange at predetermined time points (49). Lastly, D300 automation makes possible facile triple-synergy examination to the point that it could reasonably be applied in a clinical laboratory setting in an actionable time frame. Extended multidimensional synergy studies may in the future suggest combination strategies similar to highly active antiretroviral therapy to optimize maximum therapeutic effect and potentially allow more rapid sterilization of infection.
The examination of known antimicrobials against L. pneumophila was part of a large screening effort to identify novel antimicrobials that target either the host cell or bacteria to limit intracellular growth. One question in evaluation of our approach was to determine how well primary screening results predict therapeutic efficacy of known antimicrobials. Presumably, reliability in predicting such effects would portend favorably for identifying new antimicrobials. Through our analysis, we show that our screening assay did reliably predict effectiveness of antimicrobials known to be active clinically against Legionella (50). Primary screening data were also reasonably predictive of potency observed in dose-response studies, suggesting that primary screening potency could be used to prioritize compounds for further study.
In addition, our screening strategy for identifying antimicrobials that penetrate efficiently into intracellular compartments and inhibit growth of L. pneumophila likely has broader relevance. Specifically, a subset of novel antimicrobials identified will likely also inhibit other bacterial pathogens of medical importance that reside at least transiently in an intracellular niche. Among many examples, there is mounting evidence that Staphylococcus aureus (51) persists in an intracellular niche, which may underlie its vexing ability to recrudesce at late times after treatment. It is our hope that compounds identified through our screening strategy will be more likely to kill pathogens that make residence both inside and outside eukaryotic cells.
Supplementary Material
ACKNOWLEDGMENTS
This work was supported by the National Institute of Allergy and Infectious Diseases of the National Institutes of Health under award number R01AI099122 to J.E.K. We thank Jennifer Smith, David Wrobel, Su Chiang, Doug Flood, Sean Johnston, Jennifer Nale, Stewart Rudnicki, Paul Yan, and the National Screening Laboratory for the New England Regional Centers of Excellence in Biodefense and Emerging Infectious Diseases (supported by U54AI057159) for their assistance.
The content is solely the responsibility of the authors and does not necessarily represent the official views of the National Institutes of Health.
We also thank Jennifer Tsang for helpful comments on the manuscript.
Footnotes
Supplemental material for this article may be found at http://dx.doi.org/10.1128/AAC.01248-15.
REFERENCES
- 1.Kirby JE. 2015. Legionella and Bartonella. Reference module in biomedical sciences; Elsevier, New York, NY. doi: 10.1016/B978-0-12-801238-3.02296-0. [DOI] [Google Scholar]
- 2.Vogel JP, Isberg RR. 1999. Cell biology of Legionella pneumophila. Curr Opin Microbiol 2:30–34. doi: 10.1016/S1369-5274(99)80005-8. [DOI] [PubMed] [Google Scholar]
- 3.Catrenich CE, Johnson W. 1989. Characterization of the selective inhibition of growth of virulent Legionella pneumophila by supplemented Mueller-Hinton medium. Infect Immun 57:1862–1864. [DOI] [PMC free article] [PubMed] [Google Scholar]
- 4.Gerber JE, Casey CA, Martin P, Winn WC Jr. 1981. Legionnaires' disease in Vermont, 1972–1976. Am J Clin Pathol 76:816–818. [DOI] [PubMed] [Google Scholar]
- 5.Edelstein PH. 1995. Antimicrobial chemotherapy for Legionnaires' disease: a review. Clin Infect Dis 21(Suppl 3):S265–S276. doi: 10.1093/clind/21.Supplement_3.S265. [DOI] [PubMed] [Google Scholar]
- 6.Edelstein PH, Meyer RD. 1980. Susceptibility of Legionella pneumophila to twenty antimicrobial agents. Antimicrob Agents Chemother 18:403–408. doi: 10.1128/AAC.18.3.403. [DOI] [PMC free article] [PubMed] [Google Scholar]
- 7.Pedro-Botet L, Yu VL. 2006. Legionella: macrolides or quinolones? Clin Microbiol Infect 12(Suppl 3):25–30. [DOI] [PubMed] [Google Scholar]
- 8.Coers J, Vance RE, Fontana MF, Dietrich WF. 2007. Restriction of Legionella pneumophila growth in macrophages requires the concerted action of cytokine and Naip5/Ipaf signalling pathways. Cell Microbiol 9:2344–2357. doi: 10.1111/j.1462-5822.2007.00963.x. [DOI] [PubMed] [Google Scholar]
- 9.Rao C, Benhabib H, Ensminger AW. 2013. Phylogenetic reconstruction of the Legionella pneumophila Philadelphia-1 laboratory strains through comparative genomics. PLoS One 8:e64129. doi: 10.1371/journal.pone.0064129. [DOI] [PMC free article] [PubMed] [Google Scholar]
- 10.Chiaraviglio L, Kirby JE. 2014. Evaluation of impermeant, DNA-binding dye fluorescence as a real-time readout of eukaryotic cell toxicity in a high throughput screening format. Assay Drug Dev Technol 12:219–228. doi: 10.1089/adt.2014.577. [DOI] [PMC free article] [PubMed] [Google Scholar]
- 11.Ren T, Zamboni DS, Roy CR, Dietrich WF, Vance RE. 2006. Flagellin-deficient Legionella mutants evade caspase-1- and Naip5-mediated macrophage immunity. PLoS Pathog 2:e18. doi: 10.1371/journal.ppat.0020018. [DOI] [PMC free article] [PubMed] [Google Scholar]
- 12.Reference deleted. [Google Scholar]
- 13.Elion GB, Singer S, Hitchings GH. 1954. Antagonists of Nucleic acid derivatives. VIII. Synergism in combinations of biochemically related antimetabolites. J Biol Chem 208:477–488. [PubMed] [Google Scholar]
- 14.Odds FC. 2003. Synergy, antagonism, and what the chequerboard puts between them. J Antimicrob Chemother 52:1. doi: 10.1093/jac/dkg301. [DOI] [PubMed] [Google Scholar]
- 15.Yamano H, Yamazaki T, Sato K, Shiga S, Hagiwara T, Ouchi K, Kishimoto T. 2005. In vitro inhibitory effects of hinokitiol on proliferation of Chlamydia trachomatis. Antimicrob Agents Chemother 49:2519–2521. doi: 10.1128/AAC.49.6.2519-2521.2005. [DOI] [PMC free article] [PubMed] [Google Scholar]
- 16.Shih YH, Chang KW, Hsia SM, Yu CC, Fuh LJ, Chi TY, Shieh TM. 2013. In vitro antimicrobial and anticancer potential of hinokitiol against oral pathogens and oral cancer cell lines. Microbiol Res 168:254–262. doi: 10.1016/j.micres.2012.12.007. [DOI] [PubMed] [Google Scholar]
- 17.Morita Y, Matsumura E, Okabe T, Fukui T, Shibata M, Sugiura M, Ohe T, Tsujibo H, Ishida N, Inamori Y. 2004. Biological activity of alpha-thujaplicin, the isomer of hinokitiol. Biol Pharm Bull 27:899–902. doi: 10.1248/bpb.27.899. [DOI] [PubMed] [Google Scholar]
- 18.Berger KH, Isberg RR. 1993. Two distinct defects in intracellular growth complemented by a single genetic locus in Legionella pneumophila. Mol Microbiol 7:7–19. doi: 10.1111/j.1365-2958.1993.tb01092.x. [DOI] [PubMed] [Google Scholar]
- 19.Berenbaum MC. 1978. A method for testing for synergy with any number of agents. J Infect Dis 137:122–130. doi: 10.1093/infdis/137.2.122. [DOI] [PubMed] [Google Scholar]
- 20.Mills GD, Oehley MR, Arrol B. 2005. Effectiveness of beta lactam antibiotics compared with antibiotics active against atypical pathogens in non-severe community acquired pneumonia: meta-analysis. BMJ 330:456. doi: 10.1136/bmj.38334.591586.82. [DOI] [PMC free article] [PubMed] [Google Scholar]
- 21.Unertl KE, Lenhart FP, Forst H, Vogler G, Wilm V, Ehret W, Ruckdeschel G. 1989. Ciprofloxacin in the treatment of legionellosis in critically ill patients including those cases unresponsive to erythromycin. Am J Med 87:128S–131S. doi: 10.1016/0002-9343(89)90041-7. [DOI] [PubMed] [Google Scholar]
- 22.Kurz RW, Graninger W, Egger TP, Pichler H, Tragl KH. 1988. Failure of treatment of Legionella pneumonia with ciprofloxacin. J Antimicrob Chemother 22:389–391. doi: 10.1093/jac/22.3.389. [DOI] [PubMed] [Google Scholar]
- 23.Miller AC. 1981. Erythromycin in Legionnaires' disease: a re-appraisal. J Antimicrob Chemother 7:217–222. doi: 10.1093/jac/7.3.217. [DOI] [PubMed] [Google Scholar]
- 24.Hohl P, Buser U, Frei R. 1992. Fatal Legionella pneumophila pneumonia: treatment failure despite early sequential oral-parenteral amoxicillin-clavulanic acid therapy. Infection 20:99–100. doi: 10.1007/BF01711076. [DOI] [PubMed] [Google Scholar]
- 25.Yoshida S, Mizuguchi Y, Ohta H, Ogawa M. 1985. Effects of tetracyclines on experimental Legionella pneumophila infection in guinea-pigs. J Antimicrob Chemother 16:199–204. doi: 10.1093/jac/16.2.199. [DOI] [PubMed] [Google Scholar]
- 26.Mandell LA, Wunderink RG, Anzueto A, Bartlett JG, Campbell GD, Dean NC, Dowell SF, File TM Jr, Musher DM, Niederman MS, Torres A, Whitney CG, Infectious Diseases Society of America, American Thoracic Society. 2007. Infectious Diseases Society of America/American Thoracic Society consensus guidelines on the management of community-acquired pneumonia in adults. Clin Infect Dis 44(Suppl 2):S27–S72. doi: 10.1086/511159. [DOI] [PMC free article] [PubMed] [Google Scholar]
- 27.Ragnar Norrby S. 1997. Atypical pneumonia in the Nordic countries: aetiology and clinical results of a trial comparing fleroxacin and doxycycline. Nordic Atypical Pneumonia Study Group. J Antimicrob Chemother 39:499–508. [DOI] [PubMed] [Google Scholar]
- 28.Bopp LH, Baltch AL, Ritz WJ, Michelsen PB, Smith RP. 2011. Activities of tigecycline and comparators against Legionella pneumophila and Legionella micdadei extracellularly and in human monocyte-derived macrophages. Diagn Microbiol Infect Dis 69:86–93. doi: 10.1016/j.diagmicrobio.2010.08.023. [DOI] [PubMed] [Google Scholar]
- 29.Edelstein PH, Weiss WJ, Edelstein MA. 2003. Activities of tigecycline (GAR-936) against Legionella pneumophila in vitro and in guinea pigs with L. pneumophila pneumonia. Antimicrob Agents Chemother 47:533–540. doi: 10.1128/AAC.47.2.533-540.2003. [DOI] [PMC free article] [PubMed] [Google Scholar]
- 30.Friis-Moller A, Rechnitzer C, Nielsen L, Madsen S. 1985. Treatment of Legionella lung abscess in a renal transplant recipient with erythromycin and fusidic acid. Eur J Clin Microbiol 4:513–515. doi: 10.1007/BF02014439. [DOI] [PubMed] [Google Scholar]
- 31.Yoshida S, Mizuguchi Y. 1984. Antibiotic susceptibility of Legionella pneumophila Philadelphia-1 in cultured guinea-pig peritoneal macrophages. J Gen Microbiol 130:901–906. [DOI] [PubMed] [Google Scholar]
- 32.Gibson DH, Fitzgeorge RB. 1983. Persistence in serum and lungs of guinea pigs of erythromycin, gentamicin, chloramphenicol and rifampicin and their in-vitro activities against Legionella pneumophila. J Antimicrob Chemother 12:235–244. doi: 10.1093/jac/12.3.235. [DOI] [PubMed] [Google Scholar]
- 33.Lattimer GL, Rhodes LV III. 1978. Legionnaires' disease. Clinical findings and one-year follow-up. JAMA 240:1169–1171. [DOI] [PubMed] [Google Scholar]
- 34.Ryerson GG, Lauwasser ME, Block AJ, Barnett BE, Shands JW Jr. 1978. Legionnaires' disease. A sporadic case. Chest 73:113–115. [DOI] [PubMed] [Google Scholar]
- 35.Cook AL, St Claire M, Sams R. 2004. Use of florfenicol in non-human primates. J Med Primatol 33:127–133. doi: 10.1111/j.1600-0684.2004.00063.x. [DOI] [PubMed] [Google Scholar]
- 36.Schwarz S, Kehrenberg C, Doublet B, Cloeckaert A. 2004. Molecular basis of bacterial resistance to chloramphenicol and florfenicol. FEMS Microbiol Rev 28:519–542. doi: 10.1016/j.femsre.2004.04.001. [DOI] [PubMed] [Google Scholar]
- 37.Ramadan A, Abd El-Aty AM. 2011. Pharmacokinetics and distribution of florfenicol in bronchial secretions of healthy and Pasteurella multocida infected calves. Pharm Anal Acta 2:2153–2435. [Google Scholar]
- 38.Buggy BP, Saravolatz LD. 1995. Treatment of Legionella pneumophila lung abscess with clindamycin. Clin Infect Dis 20:1158–1162. doi: 10.1093/clinids/20.5.1158. [DOI] [PubMed] [Google Scholar]
- 39.Stout JE, Sens K, Mietzner S, Obman A, Yu VL. 2005. Comparative activity of quinolones, macrolides and ketolides against Legionella species using in vitro broth dilution and intracellular susceptibility testing. Int J Antimicrob Agents 25:302–307. doi: 10.1016/j.ijantimicag.2004.08.019. [DOI] [PubMed] [Google Scholar]
- 40.Stout JE, Arnold B, Yu VL. 1998. Activity of azithromycin, clarithromycin, roxithromycin, dirithromycin, quinupristin/dalfopristin and erythromycin against Legionella species by intracellular susceptibility testing in HL-60 cells. J Antimicrob Chemother 41:289–291. doi: 10.1093/jac/41.2.289. [DOI] [PubMed] [Google Scholar]
- 41.Stout JE, Arnold B, Yu VL. 1998. Comparative activity of ciprofloxacin, ofloxacin, levofloxacin, and erythromycin against Legionella species by broth microdilution and intracellular susceptibility testing in HL-60 cells. Diagn Microbiol Infect Dis 30:37–43. doi: 10.1016/S0732-8893(97)00174-0. [DOI] [PubMed] [Google Scholar]
- 42.Baltch AL, Smith RP, Franke MA, Michelsen PB. 1998. Antibacterial effects of levofloxacin, erythromycin, and rifampin in a human monocyte system against Legionella pneumophila. Antimicrob Agents Chemother 42:3153–3156. [DOI] [PMC free article] [PubMed] [Google Scholar]
- 43.Descours G, Ginevra C, Ader F, Forey F, Lina G, Etienne J, Jarraud S. 2011. Rifampicin-macrolide synergy against Legionella pneumophila serogroup 1 in human macrophages using a quantitative real-time PCR assay. Int J Antimicrob Agents 38:188–189. doi: 10.1016/j.ijantimicag.2011.05.001. [DOI] [PubMed] [Google Scholar]
- 44.Martin SJ, Pendland SL, Chen C, Schreckenberger P, Danziger LH. 1996. In vitro synergy testing of macrolide-quinolone combinations against 41 clinical isolates of Legionella. Antimicrob Agents Chemother 40:1419–1421. [DOI] [PMC free article] [PubMed] [Google Scholar]
- 45.Kirby JR. 2007. In vivo mutagenesis using EZ-Tn5. Methods Enzymol 421:17–21. doi: 10.1016/S0076-6879(06)21003-6. [DOI] [PubMed] [Google Scholar]
- 46.Bradford PA, Petersen PJ, Young M, Jones CH, Tischler M, O'Connell J. 2005. Tigecycline MIC testing by broth dilution requires use of fresh medium or addition of the biocatalytic oxygen-reducing reagent oxyrase to standardize the test method. Antimicrob Agents Chemother 49:3903–3909. doi: 10.1128/AAC.49.9.3903-3909.2005. [DOI] [PMC free article] [PubMed] [Google Scholar]
- 47.Chiaraviglio L, Brown DA, Kirby JE. 2008. Infection of cultured human endothelial cells by Legionella pneumophila. PLoS One 3:e2012. doi: 10.1371/journal.pone.0002012. [DOI] [PMC free article] [PubMed] [Google Scholar]
- 48.Casson CN, Shin S. 2013. Inflammasome-mediated cell death in response to bacterial pathogens that access the host cell cytosol: lessons from Legionella pneumophila. Front Cell Infect Microbiol 3:111. doi: 10.3389/fcimb.2013.00111. [DOI] [PMC free article] [PubMed] [Google Scholar]
- 49.Horwitz MA, Silverstein SC. 1983. Intracellular multiplication of Legionnaires' disease bacteria (Legionella pneumophila) in human monocytes is reversibly inhibited by erythromycin and rifampin. J Clin Invest 71:15–26. doi: 10.1172/JCI110744. [DOI] [PMC free article] [PubMed] [Google Scholar]
- 50.Carryn S, Chanteux H, Seral C, Mingeot-Leclercq MP, Van Bambeke F, Tulkens PM. 2003. Intracellular pharmacodynamics of antibiotics. Infect Dis Clin North Am 17:615–634. doi: 10.1016/S0891-5520(03)00066-7. [DOI] [PubMed] [Google Scholar]
- 51.Garzoni C, Kelley WL. 2009. Staphylococcus aureus: new evidence for intracellular persistence. Trends Microbiol 17:59–65. doi: 10.1016/j.tim.2008.11.005. [DOI] [PubMed] [Google Scholar]
- 52.Jordheim LP, Ben Larbi S, Fendrich O, Ducrot C, Bergeron E, Dumontet C, Freney J, Doleans-Jordheim A. 2012. Gemcitabine is active against clinical multiresistant Staphylococcus aureus strains and is synergistic with gentamicin. Int J Antimicrob Agents 39:444–447. doi: 10.1016/j.ijantimicag.2012.01.019. [DOI] [PubMed] [Google Scholar]
- 53.Sandrini MP, Shannon O, Clausen AR, Bjorck L, Piskur J. 2007. Deoxyribonucleoside kinases activate nucleoside antibiotics in severely pathogenic bacteria. Antimicrob Agents Chemother 51:2726–2732. doi: 10.1128/AAC.00081-07. [DOI] [PMC free article] [PubMed] [Google Scholar]
- 54.Sandrini MP, Clausen AR, On SL, Aarestrup FM, Munch-Petersen B, Piskur J. 2007. Nucleoside analogues are activated by bacterial deoxyribonucleoside kinases in a species-specific manner. J Antimicrob Chemother 60:510–520. doi: 10.1093/jac/dkm240. [DOI] [PubMed] [Google Scholar]
- 55.Sun R, Wang L. 2013. Inhibition of Mycoplasma pneumoniae growth by FDA-approved anticancer and antiviral nucleoside and nucleobase analogs. BMC Microbiol 13:184. doi: 10.1186/1471-2180-13-184. [DOI] [PMC free article] [PubMed] [Google Scholar]
- 56.Sperber SJ, Feibusch EL, Damiani A, Weinstein MP. 1993. In vitro activities of nucleoside analog antiviral agents against salmonellae. Antimicrob Agents Chemother 37:106–110. doi: 10.1128/AAC.37.1.106. [DOI] [PMC free article] [PubMed] [Google Scholar]
- 57.Doleans-Jordheim A, Bergeron E, Bereyziat F, Ben-Larbi S, Dumitrescu O, Mazoyer MA, Morfin F, Dumontet C, Freney J, Jordheim LP. 2011. Zidovudine (AZT) has a bactericidal effect on enterobacteria and induces genetic modifications in resistant strains. Eur J Clin Microbiol Infect Dis 30:1249–1256. doi: 10.1007/s10096-011-1220-3. [DOI] [PubMed] [Google Scholar]
- 58.CLSI. 2015. Performance standards for antimicrobial susceptibility testing: twenty-fifth informational supplement. CLSI document M100-25. Clinical and Laboratory Standards Institute, Wayne, PA. [Google Scholar]
- 59.EUCAST. 2015. The European Committee on Antimicrobial Susceptibility Testing. Breakpoint tables for interpretation of MICs and zone diameters. Version 5.0, 2015. European Society of Clinical Microbiology and Infectious Diseases, Basel, Switzerland. [Google Scholar]
- 60.Karthein J, Spohr M, Traub WH. 1986. Josamycin: interpretation of inhibition zones with the Bauer-Kirby agar disk diffusion test as compared with erythromycin. Chemotherapy 32:336–343. doi: 10.1159/000238432. [DOI] [PubMed] [Google Scholar]
- 61.Wyeth Pharmaceuticals, Inc. 2008. Tygacil (tigecycline) for injection. Package insert. NDA 21-821/S-016. Wyeth Pharmaceuticals, Inc, Madison, NJ: http://www.accessdata.fda.gov/drugsatfda_docs/label/2009/021821s016lbl.pdf. [Google Scholar]
Associated Data
This section collects any data citations, data availability statements, or supplementary materials included in this article.