Abstract
Fosfomycin, a phosphonic class antibiotic with a broad spectrum of antibacterial activity, has been used outside the United States since the early 1970s for the treatment of a variety of infections. In the United States, an oral (tromethamine salt) formulation is used for uncomplicated urinary tract infections. Recently, there has been interest in the use of an intravenous solution (ZTI-01) for the treatment of a broad range of infections associated with multidrug-resistant bacteria. In this era of multidrug-resistant bacteria with few treatment options, it is critical to understand the pharmacokinetic-pharmacodynamic (PK-PD) determinants for fosfomycin efficacy. Since such data are limited, a one-compartment in vitro infection model was used to determine the PK-PD index associated with efficacy and the magnitude of this measure necessary for various levels of effect. One challenge isolate (Escherichia coli ATCC 25922, for which the fosfomycin agar MIC is 0.5 mg/liter and the broth microdilution MIC is 1 mg/liter) was evaluated in the dose fractionation studies, and two additional clinical E. coli isolates were evaluated in the dose-ranging studies. Mutation frequency studies indicated the presence of an inherently fosfomycin resistant E. coli subpopulation (agar MIC = 32 to 64 mg/liter) within the standard starting inoculum of a susceptibility test. Due to the presence of this resistant subpopulation, we identified the percentage of the dosing interval that drug concentrations were above the inherent resistance inhibitory concentration found at baseline to be the PK-PD index associated with efficacy (r2 = 0.777). The magnitudes of this PK-PD index associated with net bacterial stasis and 1- and 2-log10 CFU/ml reductions from baseline at 24 h were 11.9, 20.9, and 32.8, respectively. These data provide useful information for modernizing and optimizing ZTI-01 dosing regimens for further study.
INTRODUCTION
In 1969, Hendlin and colleagues reported the discovery of phosphonomycin (later renamed fosfomycin) in a Streptomyces fradiae culture (1). Fosfomycin antibacterial activity is dependent upon its entry into the cell through the l-alpha-glycerophosphate transport and hexose monophosphate systems, which are glucose-6-phosphate dependent (2). Once it is inside the bacterial cell, fosfomycin inhibits peptidoglycan synthesis by the inactivation of UDP-N-acetylglucosamine-3-enolpyruvyltransferase (MurA) (3). Through this mechanism of action, fosfomycin has a broad spectrum of in vitro activity against a variety of clinically important Gram-positive pathogens, including methicillin-resistant Staphylococcus aureus, and Gram-negative pathogens, including extended-spectrum-β-lactamase (ESBL)-producing members of the family Enterobacteriaceae and carbapenem-resistant Enterobacteriaceae (CRE) (4, 5).
While oral fosfomycin has long been utilized as single-dose therapy for uncomplicated urinary tract infections (6), there has been considerable recent interest in the use of this agent in both intravenous (IV) and oral formulations for the treatment of infections associated with multidrug-resistant bacteria. Fosfomycin's in vitro activity against Enterobacteriaceae, including those producing ESBL enzymes, provides the impetus for this interest. In one review, Falagas and colleagues found that 1,604 of 1,657 (96.8%) ESBL-producing Escherichia coli isolates were fosfomycin susceptible (MIC ≤ 64 mg/liter) (4) per Clinical and Laboratory Standards Institute (CLSI) susceptibility test interpretive criteria (7). Moreover, when the results of two small studies were combined, the authors noted a high percentage of positive clinical response (93.8%) in fosfomycin-treated patients with complicated or uncomplicated lower urinary tract infections caused by ESBL-producing Escherichia coli (4, 8, 9).
Given that there are few treatment options available in this era of multidrug-resistant bacteria, it is critical to understand the pharmacokinetic-pharmacodynamic (PK‑PD) determinants of efficacy for potential antimicrobial agents. Despite 40 years of clinical use, such data are limited for fosfomycin (10). Thus, to characterize the PK-PD of fosfomycin against E. coli, studies using a one-compartment in vitro infection model in which fosfomycin was administered as an IV formulation (ZTI-01) were undertaken. The objectives of these studies were twofold. The first objective was to identify the PK-PD index that best predicts the efficacy of fosfomycin against E. coli. The second objective was to determine the magnitudes of the fosfomycin PK-PD index associated with net bacterial stasis and 1- and 2-log10 CFU/ml reductions in bacteria over 24 h.
MATERIALS AND METHODS
Bacteria and antimicrobial agent.
A panel of three E. coli isolates was utilized for the in vitro studies described herein. The panel consisted of one wild-type reference strain, ATCC 25922 (American Type Culture Collection, Manassas, VA), and two clinical isolates, E. coli 2692 and 13319 (JMI Laboratories, North Liberty, IA). ZTI-01 (fosfomycin disodium) IV solution was provided by Zavante Therapeutics, Inc. (San Diego, CA).
Media and in vitro susceptibility studies.
Susceptibility studies were performed with cation-adjusted Mueller-Hinton broth and agar (Becton, Dickinson and Company, Franklin Lakes, NJ) with and without supplementation with 25 mg/liter of glucose-6-phosphate (Sigma-Aldrich Corporation, St. Louis, MO) and were completed in triplicate. The susceptibility studies with 25 mg/liter glucose-6-phosphate were performed in accordance with guidelines from the Clinical and Laboratory Standards Institute (CLSI) (9). Modal MIC values were reported.
Mutation frequency studies.
The frequency of mutation to drug resistance was estimated in duplicate for each isolate by plating 4 ml of a log-phase growth suspension onto agar containing 5 and 256 times the baseline fosfomycin agar MIC with or without 25 mg/liter of glucose-6-phosphate. The bacterial concentration within the suspension was determined by quantitative culture. The ratio of the growth on the drug-containing plates to the starting inoculum provided an estimate of the drug resistance frequency within the total population. In studies with each isolate, a subset of colonies was taken from the drug-containing plates and MIC values were determined in order to confirm decreased fosfomycin susceptibility. The MIC values of the resistant isolates were determined using the agar dilution method described by CLSI (11).
One-compartment in vitro model and sample processing.
The one-compartment in vitro infection model utilized in these studies has been extensively applied to understand the PK-PD principles displayed by several antimicrobials and inhibitors (12). The model consists of a central infection compartment containing growth medium, the challenge isolate, and magnetic stir bars to ensure the homogeneity of the drug concentrations within the compartment. The central infection compartment was attached to a stir plate, and the entire unit was placed within a temperature- and humidity-controlled incubator set at 35°C. Drug-free Mueller-Hinton broth medium supplemented with 25 mg/liter glucose-6-phosphate was pumped into the central infection compartment via a computer-controlled peristaltic pump, while growth medium was simultaneously removed through an exit port and captured in a waste container. The challenge isolate was aseptically inoculated directly into the central infection compartment, and the peristaltic rate of diffusion was set at a flow rate which allowed the simulation of the human concentration-time profile of fosfomycin. The test compound was infused via computer-controlled syringe pumps which allowed the simulation of the desired half-life, dosing frequency, and concentrations. Specimens for CFU enumeration and drug concentration assay were collected from the central infection compartment using a sterile syringe and needle through a rubber septum at predetermined time points.
In these experiments, the initial inoculum of 1.0 × 10⁶ CFU/ml of each isolate was prepared from a culture grown overnight on Trypticase soy agar supplemented with 5% sheep blood (Sigma-Aldrich Corporation, St. Louis, MO). Isolates were taken from the overnight cultures, grown to mid-logarithmic phase in a flask of Mueller-Hinton broth supplemented with 25 mg/liter of glucose-6-phosphate, and set in a water shaker bath operating at 125 rotations per minute and 35°C. The bacterial concentration within the flask of Mueller-Hinton broth was determined by measurement of the optical density utilizing a previously confirmed growth curve.
Bacteria were then exposed to changing fosfomycin concentrations which simulated human free-drug concentration-time profiles for a range of ZTI-01 doses (described below) administered every 6 h (q6h), using a 2-h half-life (13). Given that fosfomycin is not bound to plasma proteins, total- and free-drug concentrations were considered equivalent (13). One-milliliter specimens were collected for determination of the numbers of CFU at 0, 2, 4, 8, 12, and 24 h. Each sample was centrifuged, washed, and resuspended in sterile normal saline twice to prevent drug carryover. The bacterial suspensions were then cultured onto Trypticase soy agar supplemented with 5% sheep blood, as well as Mueller-Hinton agar supplemented with 3× the fosfomycin agar MIC plus 25 mg/liter of glucose-6-phosphate. Plated samples were incubated at 35°C for 24 h. One-milliliter specimens for drug assay were collected at various time points throughout the 24-h experiment and then immediately frozen at −80°C until assayed for drug concentration.
Single-isolate dose-ranging study.
A dose-ranging study was conducted using E. coli ATCC 25922 in order to examine the fosfomycin dose-response relationship. In these studies, a range of fosfomycin doses, 0.125 to 8 g, were administered q6h over a 24-h period within the one-compartment model.
Dose fractionation studies.
The ZTI-01 dosing regimens selected for the dose fractionation studies were guided by the results of the single-isolate dose-ranging studies. The dosing regimens selected were associated with a wide range of effects from treatment failure (in which the growth matched that of the no-treatment control at 24 h) to those associated with a nearly maximal effect. The total daily fosfomycin exposure, as measured by the free-drug area under the concentration-time curve from 0 to 24 h (AUC0–24), was held constant but was fractionated into doses given q6h, q8h, and q12h, as well as a continuous infusion. The dose fractionation studies were performed in duplicate.
Pharmacokinetic-pharmacodynamic analysis of data from dose fractionation studies.
Data from the dose fractionation studies were evaluated using Hill-type models and nonlinear least-squares regression. The data were weighted using the inverse of the estimated measurement variance. The relationships between the change from baseline in the log10 CFU/ml at 24 h and three PK-PD indices were evaluated. These included the ratio of the free-drug AUC0-24 to the pathogen MIC (AUC0-24:MIC ratio), the ratio of the maximal free-drug concentration to the pathogen MIC (Cmax:MIC ratio), and the percentage of the dosing interval that the free-drug concentrations remained above the MIC (%T>MIC). In addition to the nominal MIC value, the MIC value which was determined in the absence of glucose-6-phosphate and which approximates the susceptibility of the bacterial subpopulation with reduced fosfomycin susceptibility was considered. The relationships between change from baseline in log10 CFU/ml at 24 h and a secondary set of PK‑PD indices calculated using this measure, hereafter referred to as resistance inhibitory concentration (RIC), were evaluated.
Multiple-isolate dose-ranging studies.
A series of dose-ranging studies was completed to determine the magnitude of the PK-PD index associated with net bacterial stasis and 1- and 2-log10 CFU/ml reductions from baseline at 24 h. Duplicate studies were completed using two clinical isolates with known resistance mechanisms, E. coli 2692 (NDM-1, TEM-1, CTX-M) and 13319 (CTX-M-15). The concentrations of ZTI-01 used in the dosing regimens ranged from 0.25 to 8 g, and doses were administered q8h. Data from the dose fractionation and dose-ranging studies were evaluated using a Hill-type model and nonlinear least-squares regression. The data were weighted using the inverse of the estimated measurement variance. The relationship between the change from baseline in the log10 number of CFU/ml at 24 h and the PK-PD index most predictive of efficacy based on the PK-PD analysis of data from the dose fractionation studies was evaluated.
Bioanalytical method.
Fosfomycin concentrations were determined by biological assay. Two hundred microliters of E. coli ATCC 25922, grown to log phase and diluted in Mueller-Hinton broth supplemented with 25 mg/liter of glucose-6-phosphate, was inoculated onto each plate at a concentration of 1.0 × 10⁶ CFU/ml. A volume of 15 μl was taken from each sample and deposited into 4.8-mm-diameter wells in the inoculated plates, and the plates were incubated at 35°C for 18 h. The fosfomycin standard curve was logarithmic over concentrations ranging from 10 to 500 mg/liter, with the lower quantification limit determined to be 10 mg/liter.
RESULTS
In vitro susceptibility testing.
The MIC values for fosfomycin were determined to be 1 mg/liter for all challenge isolates when the MICs were determined using the agar and broth methods with agar and broth supplemented with 25 mg/liter of glucose-6-phosphate. These values were well within the performance standards reported by CLSI (11). The MIC values increased 5- to 6-fold when susceptibility studies were carried out in the absence of glucose-6-phosphate (Table 1).
TABLE 1.
Susceptibility results for the three Escherichia coli isolates by fosfomycin broth microdilution and agar dilution methodologies with and without glucose 6-phosphate
| Escherichia coli isolate | Resistance mechanism | Fosfomycin MIC (mg/liter) |
|||
|---|---|---|---|---|---|
| With 25 mg/liter g-6-Pa |
Without 25 mg/liter g-6-P |
||||
| Broth microdilution | Agar dilutionb | Broth microdilution | Agar dilutionc | ||
| ATCC 25922 | Wild type | 0.5 | 1 | 16 | 32 |
| 13319 | CTX-M-15 | 1 | 1 | 32 | 32 |
| 2692 | NDM-1, TEM-1, CTX-M | 1 | 1 | 32 | 64 |
g-6-P, glucose-6-phosphate.
Methodology recommended by CLSI guidelines (13).
The RIC was utilized for these data.
Mutation frequency studies.
The average density of the drug-resistant subpopulation was determined for all isolates at 5 times and 256 times the baseline fosfomycin MIC in the presence of 25 mg/liter of glucose-6-phosphate. The results of this evaluation are shown in Table 2. The isolates taken from plates containing drug at 5 times the MIC had MIC values of 32 or 64 mg/liter regardless of the presence of glucose-6-phosphate (Table 2).
TABLE 2.
Mutation frequency results and susceptibility results for plates containing fosfomycin concentrations at 5 times the MIC for the three challenge isolates
| Escherichia coli isolate | Avg mutation frequencya |
MICb (mg/liter) |
||
|---|---|---|---|---|
| 5× MIC | 256× MIC | With 25 mg/liter g-6-P | Without 25 mg/liter g-6-P | |
| ATCC 25922 | 3.5 × 10⁵ | >1.2 × 10⁹ | 32–64 | 32–64 |
| 13319 | 4.5 × 10⁶ | >8.9 × 10⁸ | 32–64 | 32–64 |
| 2692 | 8.1 × 10⁵ | >1.6 × 10⁹ | 32–64 | 32–64 |
The average mutation frequency was calculated to be 1 CFU of resistant bacteria in the indicated number of CFU/ml.
MICs of isolates from plates containing drug concentrations at 5 times the MIC were determined using the agar susceptibility methodology. g-6-P, glucose-6-phosphate.
Pharmacokinetic studies.
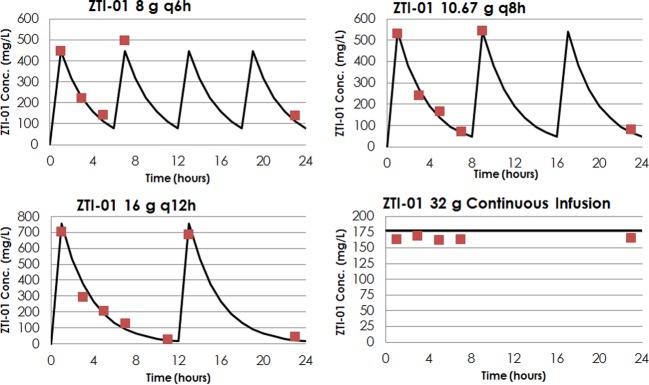
As shown in Fig. 1, there was good agreement between the observed and targeted fosfomycin concentrations for all dosing regimens evaluated (r2 = 0.98). To illustrate this good agreement, Figure 2 shows targeted free-drug fosfomycin concentration-time profiles overlaid with the mean observed fosfomycin concentrations for the ZTI-01 dosing regimens with a total daily dose of 32 g evaluated in the dose fractionation studies.
FIG 1.
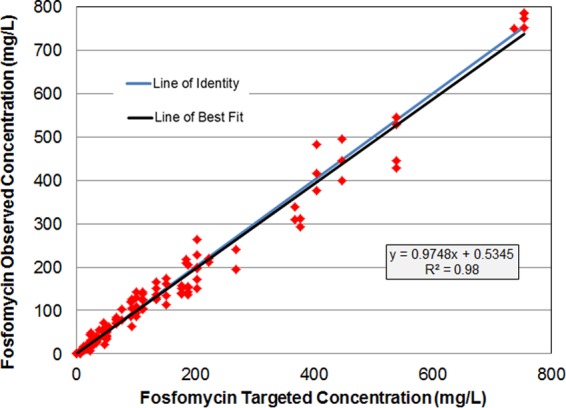
Relationship between observed and targeted free-drug fosfomycin concentrations across all studies.
FIG 2.
The targeted free-drug fosfomycin concentration-time profiles (solid lines) overlaid with the mean observed free-drug fosfomycin concentrations (red squares) for the ZTI‑01 dosing regimens with a total daily dose of 32 g evaluated in the dose fractionation studies.
Single-isolate dose-ranging study.
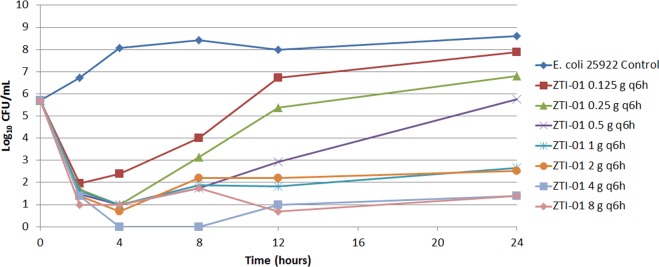
The results of the dose-ranging study are presented in Fig. 3. Bacteria in the no-treatment control arm grew well and reached a bacterial density of greater than 1.0 × 10⁸ CFU/ml by 4 h (Fig. 3). The range of ZTI-01 doses demonstrated a full spectrum of drug effect. That is, ZTI-01 dosing regimens associated with the lowest fosfomycin exposures resulted in bacterial densities approaching the density of the growth control by 24 h, while those providing higher drug exposures resulted in either net bacterial stasis or ≥4-log10 CFU/ml reductions from baseline at 24 h.
FIG 3.
Dose-ranging study results showing the effects of a range of ZTI-01 doses administered q6h on the log10 CFU/ml over 24 h for the E. coli ATCC 25922 total population.
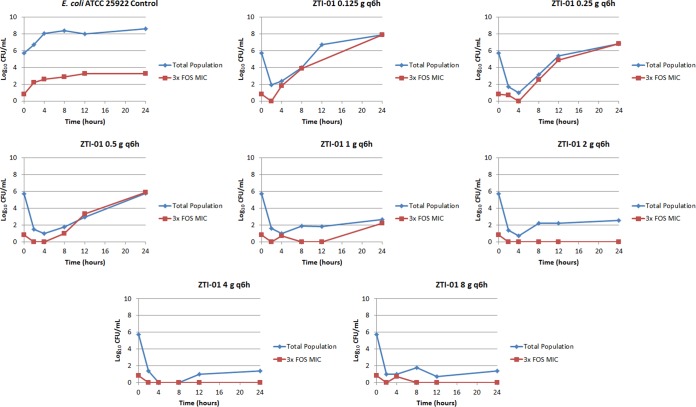
Figure 4 shows the change in the density of the total population and the inherently drug-resistant bacterial subpopulation for each regimen in the dose-ranging studies. Note that in the control regimen, the total bacterial population contained 1 log10 CFU/ml of the drug-resistant subpopulation at baseline, and the drug-resistant subpopulation increased in parallel with the growth of the total population to approximately 3.5 log10 CFU/ml at 24 h. While the fosfomycin exposures associated with the two least-intensive ZTI-01 dosing regimens (0.125 and 0.25 g q6h) resulted in a rapid reduction in the total bacterial population, the inherently drug-resistant subpopulation rapidly replaced the entire population, and by 24 h the bacterial density was similar to that of the growth control. A similar bacterial growth dynamic was observed with the 0.5-g q6h dosing regimen, except that at 24 h the total bacterial population, which was drug resistant, was similar in magnitude to that at baseline. As expected, the fosfomycin exposures associated with the most intensive ZTI-01 dosing regimens (1, 2, 4, and 8 g q6h) resulted in rapid reductions in the bacterial density of the total bacterial population without significant amplification of the drug-resistant subpopulation. Figure 5 shows the relationship between the log10 CFU/ml of the inherently fosfomycin resistant bacterial subpopulation at 24 h and dose, which resemble a hormetic or inverted-U function.
FIG 4.
Dose-ranging study results. The individual panels show the log10 CFU/ml over 24 h for the total population and drug-resistant subpopulation for each ZTI-01 dosing regimen.
FIG 5.
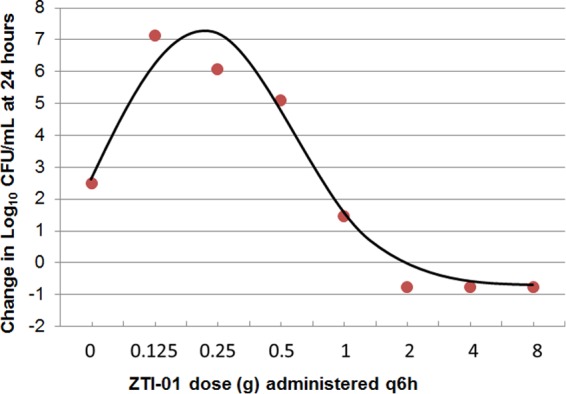
Relationship between ZTI-01 dosing regimens administered q6h and change from baseline in log10 CFU/ml for the drug-resistant subpopulation at 24 h based on data from the dose-ranging study.
The data generated based on the dose-ranging studies were deemed sufficient to identify ZTI-01 dosing regimens for evaluation in the dose fractionation studies. ZTI-01 total daily doses of 2, 8, and 32 g were chosen for evaluation in the dose fractionation studies.
Dose fractionation studies.
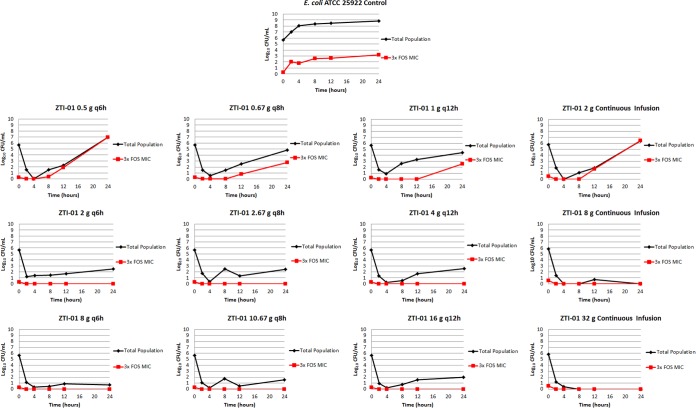
The results of the dose fractionation studies are presented in Fig. 6. The bacteria in the no-treatment control arm grew well and reached a bacterial density of greater than 1.0 × 10⁸ CFU/ml by 12 h. Note that in the control regimen, the total bacterial population contained less than 1 log10 CFU/ml of the drug-resistant subpopulation at the zero hour time point, and the drug-resistant subpopulation increased in parallel with the growth of the total population to approximately 3.5 log10 CFU/ml at 24 h.
FIG 6.
Dose fractionation study results showing the log10 CFU/ml over 24 h for the total population and the drug-resistant subpopulation for each ZTI-01 dosing regimen.
The 2-g total daily ZTI-01 dose administered either as a continuous infusion or as 0.5, 0.67, and 1 g q6h, q8h, or q12h, respectively, failed to prevent the amplification of the inherently resistant bacterial subpopulation and resulted in a static effect at the 24-h time point for all treatment regimens regardless of the dosing interval. The 8- and 32-g total daily ZTI-01 doses resulted in rapid reductions in the density of the total bacterial population without a significant amplification of the drug-resistant subpopulation. Of interest, efficacy was maximized when the 8- and 32-g total daily ZTI-01 doses were administered as a continuous infusion, as evidenced by the sterility achieved in the in vitro model at 24 h.
Pharmacokinetic-pharmacodynamic analysis.
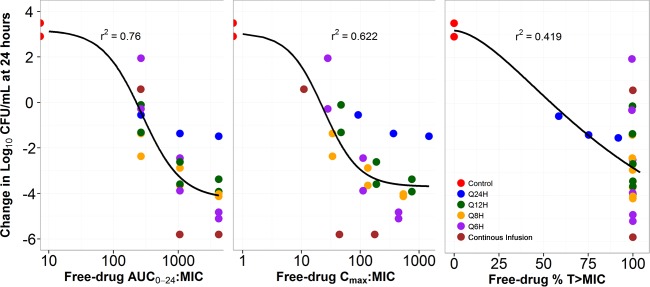
The relationships between free-drug AUC0–24:MIC ratio, Cmax:MIC ratio, and %T>MIC and the change from baseline log10 CFU/ml at 24 h are presented in Fig. 7. As evidenced by the dispersion of the data around the fitted function and by the r2 value, the free-drug AUC0–24:MIC ratio was the PK-PD index that was the most predictive of efficacy. However, given that the majority of free-drug %T>MIC values were 100, the PK-PD relationship based on this index could not be adequately explored. Because of the 8-log10 CFU/ml range in response at a free-drug %T>MIC of 100, the nominal MIC value that was used to calculate free-drug %T>MIC did not appear to be predictive of response. It was hypothesized that the MIC value predictive of response was that of the drug-resistant subpopulation (i.e., the RIC) rather than the nominal MIC value.
FIG 7.
Relationships between free-drug fosfomycin AUC0–24:MIC ratio, Cmax:MIC ratio, and %T>MIC and change from baseline in log10 CFU/ml of E. coli ATCC 25922 at 24 h based on data from a one-compartment in vitro infection model.
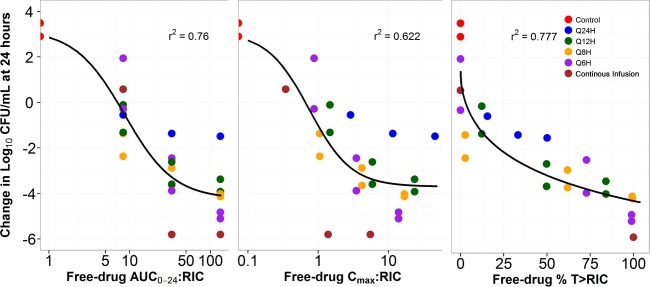
Thus, in addition to the nominal MIC value, RIC was the second variable considered in the PK-PD analysis. Relationships between the free-drug AUC0–24:RIC ratio, Cmax:RIC ratio, and the percentage of the dosing interval that free-drug concentrations remain above the RIC (%T>RIC) and the change from baseline in log10 CFU/ml at 24 h are presented in Fig. 8. As evidenced by the dispersion of the data around the fitted function and by the r2 value, free-drug %T>RIC was the PK-PD index that was the most predictive of efficacy.
FIG 8.
Relationships between free-drug fosfomycin AUC0–24:RIC ratio, Cmax:RIC ratio, and %T>RIC and change from baseline in log10 CFU/ml of E. coli 25922 at 24 h based on data from a one-compartment in vitro infection model.
Multiple-isolate dose-ranging studies.
The results of the multiple-isolate dose-ranging studies which are presented in Fig. 9 show the relationship between the change from baseline in the log10 CFU/ml of the total population, including the inherently drug-resistant bacterial subpopulation for each isolate and the free-drug %T>RIC. As evidenced by the r2 value of 0.83, the two clinical isolates were comodeled reasonably well with the wild-type (ATCC 25922) strain. The magnitudes of free-drug %T>RIC required for net bacterial stasis as well as 1- and 2-log10 CFU/ml reductions from baseline at 24 h were determined to be 11.9, 20.9, and 32.8, respectively.
FIG 9.
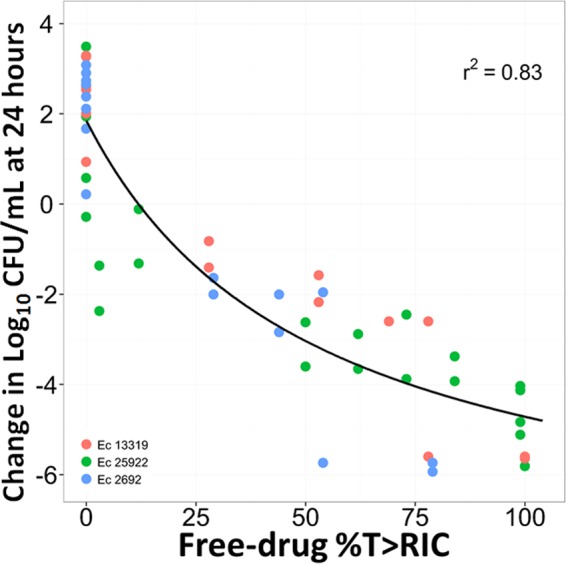
Relationship between free-drug fosfomycin %T>RIC and change from baseline in log10 CFU/ml at 24 h based on data from the multiple-isolate dose-ranging studies for E. coli isolates 25922, 13319, and 1692.
As shown in Fig. 10, a hormetic or inverted-U-shaped function described the relationships between the ZTI-01 dose and the change in resistant populations for the two clinical isolates at 5 and 256 times the MIC . The 5-times-the-MIC population represented a larger bacterial burden over the 0.25- through 1-g dosing regimens than that observed with the 256-times-the-MIC population. ZTI-01 dosing regimens of ≥2 g prevented the amplification of the drug-resistant subpopulations for both isolates over the 24-h period. MIC values of the isolates taken from the 5-times-the-MIC drug-containing plates ranged from 32 to 128 mg/liter, while those sampled from the 256-times-the-MIC plates ranged from 256 to >512 mg/liter.
FIG 10.
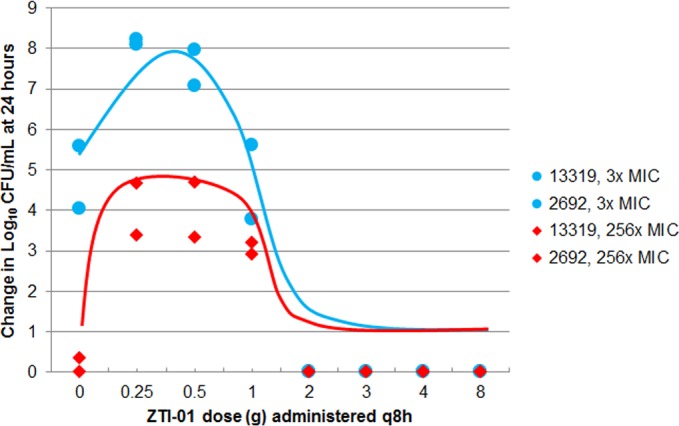
Relationships between change from baseline in log10 CFU/ml at 24 h of resistant isolates observed in the multiple-isolate dose-ranging studies and ZTI-01 dosing regimen.
DISCUSSION
The objectives of the studies described herein using a one-compartment in vitro infection model to evaluate the PK-PD of fosfomycin administered as ZTI-01 for E. coli were twofold. The first objective was to identify the PK-PD index for fosfomycin that best predicts efficacy against E. coli. The second objective was to determine the magnitudes of the above-described PK-PD index associated with net bacterial stasis and 1- and 2-log10 CFU/ml reductions from baseline at 24 h.
We successfully identified %T>RIC, a new PK-PD index that was most closely associated with fosfomycin efficacy. The magnitudes of free-drug %T>RIC associated with net bacterial stasis and 1- and 2-log10 CFU/ml reductions from baseline at 24 h were 11.9, 20.9, and 32.8 respectively. It is important to recognize why %T>RIC rather than %T>MIC was identified as the PK-PD index associated with fosfomycin efficacy. Figure 7 shows the relationships between the free-drug AUC0–24:MIC ratio, the Cmax:MIC ratio, and %T>MIC and the change from baseline in the log10 CFU/ml at 24 h for different ZTI-01 dosing regimens which were identical in terms of total daily dose. As evidenced by the relationship for free-drug %T>MIC, the vast majority of dosing regimens had free-drug %T>MIC equal to 100 but the change from baseline in bacterial density at 24 h varied dramatically, spanning an 8-log10 CFU/ml range. Thus, these results demonstrated that %T>MIC is not the PK-PD index that best describes fosfomycin efficacy.
One reason for the failure of %T>MIC to describe the PK-PD of fosfomycin is the presence of an inherently fosfomycin resistant E. coli subpopulation (agar MIC = 32 to 64 mg/liter) within the standard starting inoculum of the susceptibility test and the failure of this testing methodology to detect this subpopulation. The standard starting inoculum for the susceptibility test is 5 × 10⁵ CFU/ml. However, the volume of the microtiter well is 100 to 200 μl and thus contains only 50,000 to 100,000 CFU. Given that the inherently fosfomycin-resistant subpopulation has a frequency of at least 1 in 350,000 CFU, the bacterial burden in the microtiter well for the susceptibility test is too low to allow for detection of a fosfomycin-resistant E. coli subpopulation. Thus, for fosfomycin, the nominal MIC based on the standard susceptibility test method appears to be an insensitive measure of the drug concentration required to inhibit a clinically relevant bacterial inoculum.
One way to overcome the poor sensitivity of the susceptibility test method is to increase the inoculum size and the volume of the test system. Relative to the standard susceptibility test method, the one-compartment in vitro PK-PD infection model is a much more sensitive tool for measurement of the drug concentration required to inhibit a clinically relevant bacterial inoculum owing to its ability to accommodate a larger inoculum and the larger volume (125 ml) of the test system. For this reason, dose fractionation studies were conducted using a one-compartment in vitro PK-PD infection model to identify the PK-PD index most closely associated with fosfomycin efficacy.
Figure 8 shows the relationship between each PK-PD measure indexed relative to the MIC of the drug-resistant bacterial subpopulation (i.e., the RIC) for the same E. coli strain for which each PK-PD index was evaluated. Note the relatively stronger relationship for %T>RIC and the change from baseline in log10 CFU/ml compared to those for the AUC0–24:RIC ratio and the Cmax:RIC ratio, as evidenced by the r2 value and the dispersion of the data about the fitted functions for each PK-PD index.
One important implication of the results of these analyses is that there is an opportunity to adjust the technical details of the disc diffusion or broth dilution test methods to detect and quantitate the drug-resistant subpopulation. The availability of such a test may provide a diagnostic tool that can be used to discriminate the relevant MIC and thereby identify patients likely to respond to ZTI-01 therapy. Such studies are currently being planned.
There are two important caveats to consider when evaluating the study results described herein. First, we do not understand the biological fitness of the isolates selected from the drug-containing plates. Animal studies with these isolates would be required to evaluate their biological fitness. Second, the duration of the study with the in vitro PK-PD models described herein was 24 h. Studies of longer duration with in vitro PK-PD models, such as a hollow-fiber infection model, will be required to evaluate resistance amplification prevention over clinically relevant treatment durations.
In conclusion, we successfully identified %T>RIC as the PK‑PD index most closely associated with fosfomycin efficacy. The magnitudes of free-drug %T>RIC required for net bacterial stasis and 1- and 2-log10 CFU/ml reductions from baseline were 11.9, 20.9, and 32.8, respectively. These data demonstrate the need to adjust technical details of the disc diffusion or broth dilution test methods to detect and quantitate the drug-resistant subpopulation. If such a test can be developed, it would provide a diagnostic tool that can be used to identify patients likely to respond to fosfomycin therapy with ZTI-01 efficacy.
ACKNOWLEDGMENTS
We thank Kim A. Charpentier from the Institute for Clinical Pharmacodynamics (Latham, NY, USA) for manuscript assistance and technical support.
The Institute for Clinical Pharmacodynamics (B.D.V., J.M., O.O.O., S.M.B., A.F., and P.G.A.) has received research support from Achaogen, Astellas, AstraZeneca, Basilea Pharmaceutica, Bayer HealthCare, Bristol-Meyers Squibb, Cempra Pharmaceuticals, Cerexa, Cubist Pharmaceuticals, Durata Pharmaceuticals, Fedora Pharmaceuticals, Forest Research Institute, Furiex Pharmaceuticals, GlaxoSmithKline, Meiji Seika Pharma, Nabriva Therapeutics, Nimbus, Pfizer, PolyMedix, Rib-X, Roche Bioscience, Rock Therapeutics, Tetraphase Pharmaceuticals, and The Medicines Company.
REFERENCES
- 1.Hendlin D, Stapley EO, Jackson M, Wallick H, Miller AK, Wolf FJ, Miller TW, Chaiet L, Kahan FM, Foltz EL, Woodruff HB, Mata JM, Hernandez S, Mochales S. 1969. Phosphonomycin, a new antibiotic produced by strains of Streptomyces. Science 166:122–123. doi: 10.1126/science.166.3901.122. [DOI] [PubMed] [Google Scholar]
- 2.Kahan FM, Kahan JS, Cassidy PJ, Kropp H. 1974. The mechanism of action of fosfomycin (phosphonomycin). Ann N Y Acad Sci 235:364–386. doi: 10.1111/j.1749-6632.1974.tb43277.x. [DOI] [PubMed] [Google Scholar]
- 3.Brown ED, Vivas EI, Walsh CT, Kolter R. 1995. MurA (MurZ), the enzyme that catalyzes the first committed step in peptidoglycan biosynthesis, is essential in Escherichia coli. J Bacteriol 177:4194–4197. [DOI] [PMC free article] [PubMed] [Google Scholar]
- 4.Falagas ME, Kastoris AC, Lapaskelis AM, Karageogopoulos DE. 2010. Fosfomycin for the treatment of multidrug-resistant, including extended-spectrum β-lactamase producing, Enterobacteriaceae infections: a systematic review. Lancet Infect Dis 10:43–50. doi: 10.1016/S1473-3099(09)70325-1. [DOI] [PubMed] [Google Scholar]
- 5.Michalopoulos AS, Livaditis IG, Gougoutas V. 2011. The revival of fosfomycin. Int J Infect Dis 15:e732–e739. doi: 10.1016/j.ijid.2011.07.007. [DOI] [PubMed] [Google Scholar]
- 6.Patel SS, Balfour JA, Bryson HM. 1997. Fosfomycin tromethamine: a review of its antibacterial activity, pharmacokinetic properties and therapeutic efficacy as a single-dose oral treatment for acute uncomplicated lower urinary tract infections. Drugs 53:637–656. doi: 10.2165/00003495-199753040-00007. [DOI] [PubMed] [Google Scholar]
- 7.Clinical and Laboratory Standards Institute. 2012. Methods for dilution antimicrobial susceptibility tests for bacteria that grow aerobically. Approved standard, 9th ed CLSI document M07-A9 Clinical and Laboratory Standards Institute, Wayne, PA. [Google Scholar]
- 8.Rodriguez-Bano J, Alcala JC, Cisneros JM, Grill F, Oliver A, Horcajada JP, Tortola T, Mirelis B, Navarro G, Cuenca M, Esteve M, Pena C, Llanos AC, Canton R, Pascual A. 2008. Community infections caused by extended-spectrum beta-lactamase-producing Escherichia coli. Arch Intern Med 168:1897–1902. doi: 10.1001/archinte.168.17.1897. [DOI] [PubMed] [Google Scholar]
- 9.Pullukcu H, Tasbakan M, Sipahi OR, Yamazhan T, Aydemir S, Ulusoy S. 2007. Fosfomycin in the treatment of extended spectrum beta-lactamase-producing Escherichia coli-related lower urinary tract infections. Int J Antimicrob Agents 29:62–65. doi: 10.1016/j.ijantimicag.2006.08.039. [DOI] [PubMed] [Google Scholar]
- 10.Docobo-Pérez F, Drusano GL, Johnson A, Goodwin J, Whalley S, Ramos-Martin V, Ballestero-Tellez M, Rodriguez-Martinez JM, Conejo MC, van Guilder M, Rodriguez-Baño J, Pascual A, Hope WW. 2015. Pharmacodynamics of fosfomycin: insights into clinical use for antimicrobial resistance. Antimicrob. Agents Chemother 59:5602–5610. doi: 10.1128/AAC.00752-15.12. [DOI] [PMC free article] [PubMed] [Google Scholar]
- 11.Clinical and Laboratory Standards Institute. 2012. Performance standards for antimicrobial susceptibility testing. Standard M100-S22. 22nd supplement Clinical and Laboratory Standards Institute, Wayne, PA. [Google Scholar]
- 12.Garrison MW, Vance-Bryan K, Larson TA, Toscano JP, Rotschafer JC. 1990. Assessment of effects of protein binding on daptomycin and vancomycin killing of Staphylococcus aureus by using an in vitro pharmacodynamic model. Antimicrob Agents Chemother 34:1925–1931. doi: 10.1128/AAC.34.10.1925. [DOI] [PMC free article] [PubMed] [Google Scholar]
- 13.Laboratorios ERN. 1997. Fosfocina intravenosa package insert. Laboratorios ERN, Madrid, Spain. [Google Scholar]


