

Abstract
Pyrazinamide (PZA) is a first-line antitubercular drug for which the mode of action remains unresolved. Mycobacterium tuberculosis lacks measurable susceptibility to PZA under standard laboratory growth conditions. However, susceptibility to this drug can be induced by cultivation of the bacilli in an acidified growth medium. Previous reports suggested that the active form of PZA, pyrazinoic acid (POA), operates as a proton ionophore that confers cytoplasmic acidification when M. tuberculosis is exposed to an acidic environment. In this study, we demonstrate that overexpression of the PZA-activating enzyme PncA can confer PZA susceptibility to M. tuberculosis under neutral and even alkaline growth conditions. Furthermore, we find that wild-type M. tuberculosis displays increased susceptibility to POA relative to PZA in neutral and alkaline media. Utilizing a strain of M. tuberculosis that expresses a pH-sensitive green fluorescent protein (GFP), we find that unlike the bona fide ionophores monensin and carbonyl cyanide 3-chlorophenylhydrazone, PZA and POA do not induce rapid uncoupling or cytoplasmic acidification under conditions that promote susceptibility. Thus, based on these observations, we conclude that the antitubercular action of POA is independent of environmental pH and intrabacterial acidification.
INTRODUCTION
The first-line antitubercular drug pyrazinamide (PZA) is an essential component of tuberculosis (TB) short-course therapy. The inclusion of PZA in this regimen has yielded a significant reduction in relapse rates and has shortened treatment durations from 9 to 6 months (1). However, the increasing global burden of multidrug-resistant and extensively drug-resistant TB threatens the durability of antitubercular therapy (2). Acquisition of a better understanding of the requirements for PZA susceptibility in Mycobacterium tuberculosis will facilitate the optimization of treatment regimens. Furthermore, elucidating the mode of PZA action will guide the discovery of mechanistically related novel compounds to improve TB therapy and circumvent drug resistance.
PZA is a prodrug whose antimycobacterial activity necessitates hydrolysis to pyrazinoic acid (POA) by the M. tuberculosis nicotinamidase/pyrazinamidase PncA (3, 4). PncA is a component of the NAD+ salvage pathway in M. tuberculosis, which is nonessential for growth as the bacilli express a de novo NAD+ biosynthesis pathway (5, 6). Loss-of-function mutations in pncA confer no discernible fitness defect and represent the primary molecular mechanism for PZA resistance in clinical and laboratory isolates of M. tuberculosis (3). As recently reviewed by Zhang and colleagues (7), additional PZA resistance mechanisms have been suggested from in vitro studies, including enhanced POA efflux, structural alterations in the ribosomal protein RpsA (8), and alterations in the pantothenate/coenzyme A biosynthetic pathway (9–11). The overall contribution of the latter putative resistance mechanisms has yet to be confirmed in a clinical setting or in mammalian models of TB infection.
While PZA exerts a sterilizing bactericidal effect against M. tuberculosis in humans and in animal models of infection (12–15), it shows no notable activity against bacilli under standard laboratory growth conditions (16). In vitro, PZA-mediated bacteriostasis of M. tuberculosis can be induced by incubation under conditions of mild acidity (17) and coincubation with efflux pump inhibitors (18). Furthermore, the bactericidal activity of PZA can be induced under acidic incubation conditions by nutrient limitation (19, 20), anaerobiosis (21), and exposure to compounds that interfere with energy metabolism (22). It is conceivable that a common feature of these conditions is that they all promote cytoplasmic accumulation of POA, yet this model has not been experimentally evaluated.
Several models have been proposed to explain the mechanistic basis for the antitubercular action of PZA (8, 10, 22, 23). Of these, POA-mediated proton shuttling leading to cytoplasmic acidification of the bacilli remains the most widely accepted model for PZA action (7, 22, 24). In this model, PZA passively diffuses across the mycobacterial wall and inner membrane, where it is hydrolyzed to POA by the cytoplasmic amidase PncA. Negatively charged POA (pKa of 2.9) is then eliminated from the cytoplasm by an unidentified mechanism. Once in the mildly acidic extracellular milieu (typically pH ∼6 for PZA susceptibility assays [25]), a small proportion of extracellular POA becomes protonated and passively diffuses back into the cytoplasm. In the slightly alkaline cytoplasm (pH 7.4) (26), POA becomes deprotonated, completing the cycle. Through repeated rounds of cycling, POA drives equilibration of the extracellular and intracellular pH, resulting in cytoplasmic acidification and pleiotropic impairment of cellular metabolism.
Recent reports have revealed that the acid dependence of PZA action can be diminished through coincubation with efflux pump inhibitors (18, 27) or by overexpression of PncA (28). Nonetheless, proton shuttling resulting in cytoplasmic acidification remains a plausible but untested model for PZA action. Thus, in this study, we chose to more thoroughly examine the link between pH and PZA susceptibility. In the context of pncA overexpression, we establish that PZA susceptibility is independent of environmental pH. Moreover, by monitoring intrabacterial pH using an intravital fluorescent reporter, we find that POA does not display robust proton ionophore (protonophore) activity. Thus, we conclude that inhibition of M. tuberculosis growth by PZA or POA can be uncoupled from extracellular and intracellular pH and is not likely attributable to proton shuttling and cytoplasmic acidification.
MATERIALS AND METHODS
Bacterial strains and culture conditions.
M. tuberculosis strains H37Ra and H37Rv were gifts from W. R. Jacobs, Jr., Albert Einstein College of Medicine. Strains were grown in Middlebrook 7H9 medium (Difco) supplemented with 10% (vol/vol) oleic acid-albumin-dextrose-catalase (OADC) (Difco), 0.2% (vol/vol) glycerol, 0.05% (vol/vol) tyloxapol, and 50 μg/ml kanamycin and 150 μg/ml hygromycin as necessary. For nutrient-limited PZA survival assays, M. tuberculosis H37Ra cells were incubated in phosphate-buffered saline (PBS) (pH 7.0) containing 0.05% (vol/vol) tyloxapol.
Construction of pncA overexpression vectors.
M. tuberculosis pncA was amplified from pTIC6a::pncA (28) by PCR with primers 5′-CATCCCGGCGTTGATCTGTG-3′ and 5′-TAATCGCGGCCTCGAGCAAG-3′, digested with HindIII and NheI, and ligated into the mycobacterial replicative and integrative expression vectors pUMN002 and pUMN007, respectively. Recombinant plasmids were propagated in DH5α cells and maintained with kanamycin selection. M. tuberculosis strain H37Ra was transformed with the pncA expression plasmids by electroporation and selected on supplemented 7H10 agar containing kanamycin.
Antimicrobial susceptibility assays.
Antimicrobial susceptibility was determined by measuring the optical density at 600 nm (OD600) of the respective cultures. Susceptibility testing was performed by using supplemented 7H9 medium at pH 5.8. The MIC90 for antimicrobial compounds was defined as the minimum concentration required for inhibition of at least 90% of growth relative to the growth of the no-antimicrobial control. Exponentially growing cultures of M. tuberculosis were diluted to an OD600 of 0.01 in 5 ml of supplemented 7H9 medium in 30-ml square Nalgene bottles. Antimicrobial compounds were added to the final concentrations indicated in the figure legends. Cultures were incubated at 37°C with shaking on a rotary platform at 100 rpm for 14 days. After incubation, 20-μl aliquots of the no-antimicrobial control cultures and cultures incubated with antimycobacterial compounds at the MIC90 were removed and spotted onto pH paper to determine the culture pH.
Survival kinetics and dose response.
Exponentially growing cultures of M. tuberculosis H37Ra were centrifuged and resuspended in PBS (pH 7.0) containing tyloxapol (0.05%). Cultures were starved for 2 days an then diluted to an OD600 of 0.01 in 5 ml of PBS with tyloxapol (0.05%) in 30-ml square Nalgene bottles. PZA was added at the specified concentrations. For acid survival, exponentially growing cultures of M. tuberculosis were diluted to an OD600 of 0.01 in 5 ml of supplemented 7H9 medium at pH 5.8 in 30-ml square Nalgene bottles. At the indicated time points, culture aliquots were plated for CFU enumeration. For dose-response determinations, starved cultures were diluted to an OD600 of 0.01 in PBS (pH 7.0) containing tyloxapol (0.05%) and the specified PZA concentrations. Cell suspensions were incubated for 3 weeks, and viability was monitored by plating for CFU.
Pyrazinamidase assays.
Pyrazinamidase activity was determined as previously described (28). Briefly, mid-exponential-phase cultures of M. tuberculosis grown in supplemented 7H9 medium (pH 6.8) were treated with 2 mM PZA and incubated at 37°C with shaking. At various time points, 1 ml of culture was removed and centrifuged (13,000 × g for 10 min), and 100 μl of 200 mM fresh ferrous ammonium sulfate (Sigma-Aldrich) was added. Samples were incubated at 4°C for 24 h and then centrifuged (13,000 × g for 5 min), and the OD468 was measured. A millimolar extinction coefficient of 0.68 was used to determine the POA concentration (28).
Quantitative reverse transcription-PCR.
For quantification of pncA expression, quantitative reverse transcription-PCR (qRT-PCR) was performed. Briefly, mid-exponential-phase M. tuberculosis cells were harvested via centrifugation. Cell pellets were resuspended in 500 μl TRIzol (Invitrogen) containing 1% polyacryl carrier (Molecular Research Center), and RNA was extracted by bead beating with 0.1-mm zirconia beads. The remaining DNA was removed by treatment with a Turbo DNA-free kit (Ambion). Gene-specific primers for qRT-PCR were designed with Primer3 software (http://bioinfo.ut.ee/primer3). qRT-PCR was performed with the QuantiFast SYBR green RT-PCR kit (Qiagen). qRT-PCR mixtures were prepared with 2× QuantiFast SYBR green RT-PCR master mix, 10 μM primers, 0.1 μl QuantiFast RT mix, and 1 ng RNA and were run on a LightCycler480 instrument under the following cycle conditions: 50°C for 10 min; 95°C for 5 min; and 35 cycles of 95°C for 10 s, 60°C for 10 s, and 72°C for 20 s, with fluorescence quantification for each cycle. A melting curve cycle of 95°C for 15 s, 60°C for 15 s, and 95°C with a 2% ramp rate was used to determine product specificity. To test for contaminating DNA, control qRT-PCR without reverse transcriptase was performed.
Intrabacterial pH determination.
pH-sensitive green fluorescent protein (pH-GFP) was a gift from Sabine Ehrt, Weill Cornell Medical College. H37Ra/pUMN007 and H37Ra/pUMN007::pncA were transformed with pH-GFP and selected on supplemented 7H10 medium containing 150 μg/ml hygromycin and 50 μg/ml kanamycin as needed. Transformants were propagated in supplemented 7H9 medium containing hygromycin and kanamycin as necessary. Intrabacterial pH was determined as previously reported (26), with modifications. Briefly, mid-exponential-phase H37Ra cells expressing pH-GFP were transferred to acidified or neutral medium by centrifugation (3,000 rpm for 10 min) and resuspended to a final OD600 of 0.1 in 5 ml supplemented 7H9 medium at pH 5.8 or pH 7.0 in 30-ml square Nalgene bottles. Antimycobacterial compounds and ionophores were added to the final concentrations indicated in the text. At the specified time points, 200 μl of culture was transferred to a black-walled 96-well plate, and fluorescence was assessed by excitation of samples at 395 nm and 475 nm and recording emission at 510 nm by using a Molecular Devices SpectraMax M2 plate reader. Ratios of emissions obtained from excitations at 395 to those obtained at 475 nm were correlated to pH by using a standard curve that was generated by placing 20 μl of total protein extract of H37Ra cells expressing pH-GFP into 200 mM sodium phosphate–100 mM citrate buffer at pH intervals of 5.5 to 8.5 in pH 0.5 increments. A sigmoidal Hill equation was fit to the ratios of excitation at 395 nm/excitation at 475 nm by using GraphPad Prism 6 for pH calculation.
Membrane potential determination.
Membrane potential was assessed as previously described (29), with modifications. Briefly, mid-exponential-phase M. tuberculosis H37Ra cells grown in supplemented 7H9 medium were transferred to acidic or neutral medium by centrifugation (3,000 rpm for 10 min) and resuspended to a final OD600 of 0.1 in 5 ml supplemented 7H9 medium at pH 5.8 or pH 7.0 in 30-ml square Nalgene bottles. Antimycobacterial compounds and ionophores were added to the final concentrations indicated in the text and incubated at 37°C. At 30 min, 180 μl was removed, 20 μl of 150 μM 3,3-diethyloxicarbocianide chloride [DiOC2(3)] was added, and the mixture was incubated at room temperature for 30 min. Cells were then washed, resuspended in supplemented 7H9 medium, transferred to a black-walled 96-well plate, and analyzed in a Molecular Devices SpectraMax M2 plate reader, and fluorescence was assessed by excitation of samples at 488 nm and recording the emissions at 530 nm and 610 nm. Ratios of the emission at 610 nm/emission at 530 nm were calculated.
RESULTS
pncA overexpression confers susceptibility to PZA at neutral and alkaline pH.
To further evaluate the association between environmental pH and PZA susceptibility in M. tuberculosis, we overexpressed pncA from a constitutive mycobacterial promoter (30). Overexpression of pncA by 100-fold was confirmed by using qRT-PCR, which was further corroborated by PncA activity assays confirming a 100-fold increase in the rate of cell-mediated conversion of PZA to POA (Table 1). Consistent with previously reported results (28, 31), M. tuberculosis H37Rv overexpressing pncA demonstrated PZA hypersusceptibility in acidic growth medium (Table 1). In addition, pncA overexpression also conferred PZA susceptibility under neutral and alkaline growth conditions (Table 1). This PZA susceptibility phenotype is in contrast to that of M. tuberculosis with wild-type pncA expression levels, which demonstrated PZA susceptibility in acidic medium and resistance to >13 mM PZA in neutral and alkaline media (Table 1). In addition, we found that wild-type M. tuberculosis showed increased susceptibility to POA, relative to PZA, in both neutral and alkaline media (Table 1). Considering that these PZA and POA susceptibility studies were conducted with 7H9 medium, which has a weak buffering capacity, we evaluated culture pH at the conclusion of susceptibility testing. There was no notable change in pH for growth-inhibited pH 5.8 or pH 7.0 cultures. However, the pH of alkaline cultures containing PZA or POA at the MIC90 decreased slightly to pH 7.5.
TABLE 1.
M. tuberculosis PZA susceptibility is independent of environmental pH
| Strain | MIC90a (mM) |
Mean PZA turnover rate (nmol/min/ml of cells [OD600]) ± SD | |||||
|---|---|---|---|---|---|---|---|
| PZA at pH: |
POA at pH: |
||||||
| 5.8 | 7.0 | 8.0 | 5.8 | 7.0 | 8.0 | ||
| H37Ra/pUMN002 | 0.4 | >13 | >13 | 1.6 | 3.2 | >6.4 | 0.099 ± 0.001 |
| H37Ra/pUMN002::pncA | 0.4 | 1.6 | 1.6 | 1.6 | 3.2 | >6.4 | 11 ± 1 |
| H37Rv/pUMN002 | 0.8 | >13 | >13 | 1.6 | 3.2 | 6.4 | NDb |
| H37Rv/pUMN002::pncA | 0.05 | 1.6 | 3.2 | 1.6 | 3.2 | 6.4 | ND |
MIC90 is the minimum concentration that inhibited ≥90% of growth relative to the growth of the no-drug control over 2 weeks of incubation.
ND, not determined.
pncA expression is not acid inducible and demonstrates no significant strain disparity.
Considering that overexpression of pncA can confer PZA susceptibility at neutral and alkaline pH, we performed qRT-PCR to determine if pncA expression is acid responsive. Exponential-phase cultures of M. tuberculosis were subcultured in acidified supplemented 7H9 medium (pH 5.8) for 24 h, at which point RNA was extracted and qRT-PCR was performed. There was no significant change in pncA expression levels under conditions of acid incubation in either M. tuberculosis strain H37Ra or strain H37Rv (Fig. 1).
FIG 1.
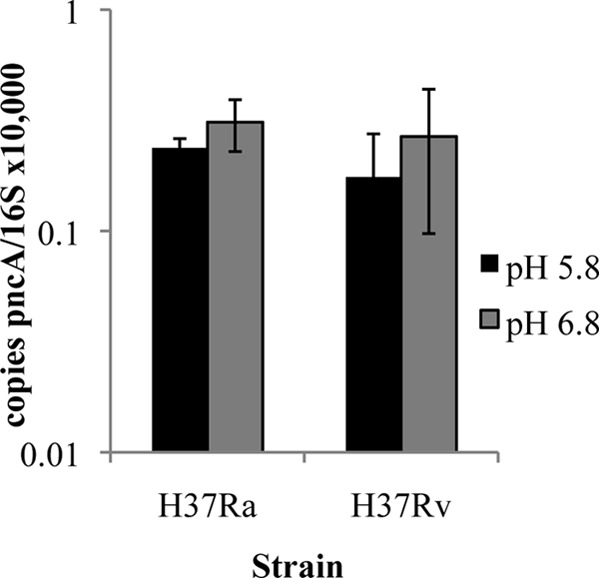
qRT-PCR analysis of pncA expression in acidified medium. Mid-exponential-phase M. tuberculosis H37Ra or H37Rv cells were transferred to acidified or neutral supplemented 7H9 medium for 24 h, after which RNA was extracted. Expression of pncA was quantified by qRT-PCR. The pncA expression level was normalized to the 16S rRNA level. Data are the means ± standard deviations of data from 3 independent experiments.
PZA is bactericidal for M. tuberculosis in nutrient-limited, neutral-pH medium.
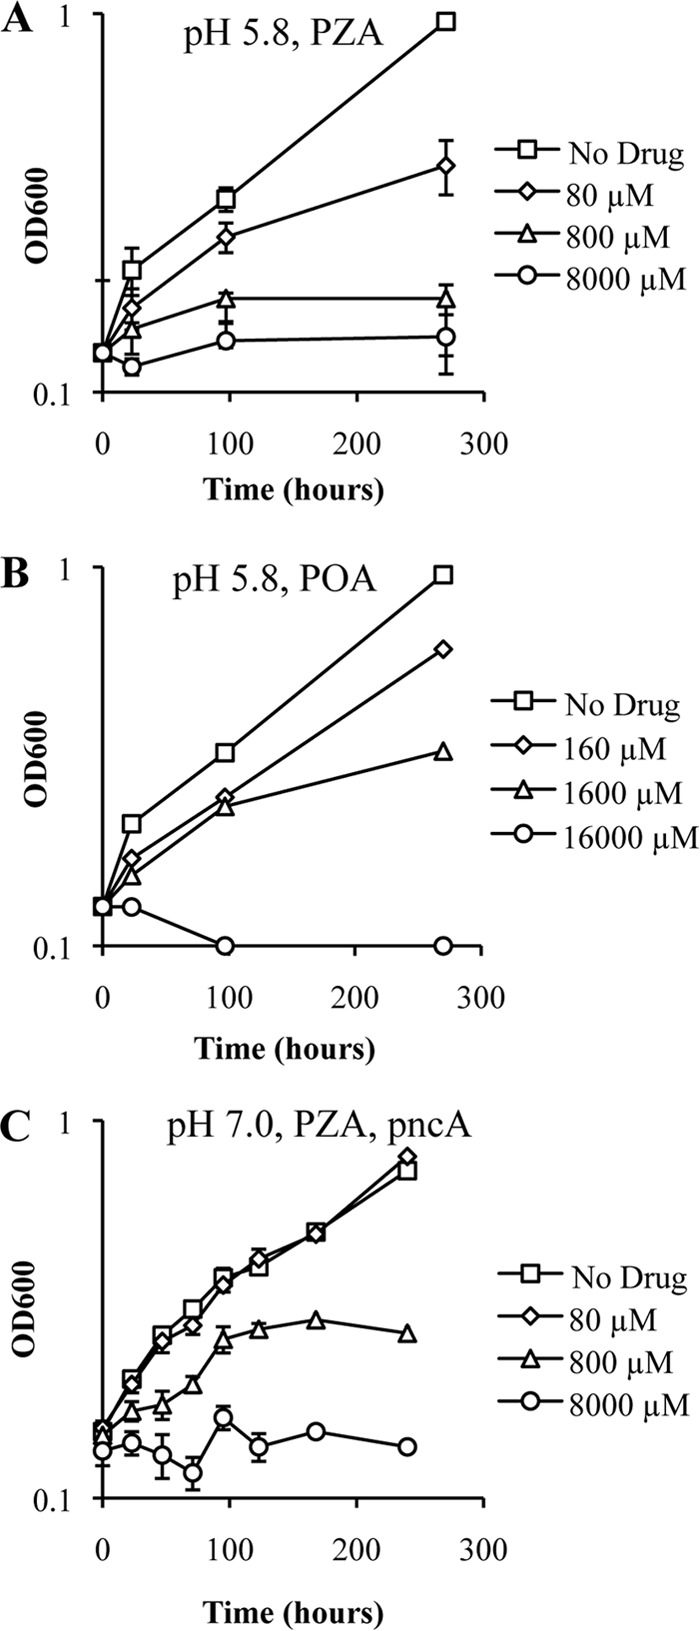
Consistent with previously reported findings (19, 20), we observed that PZA produces a bactericidal effect against nutrient-limited M. tuberculosis cells. However, while previous reports described the bactericidal activity of PZA under nutrient-limited acidic conditions, we find that this bactericidal activity can occur at neutral pH (Fig. 2A and B). Under nutrient-limiting, neutral-pH conditions, physiologically relevant PZA concentrations became bactericidal against M. tuberculosis after 5 days of incubation (Fig. 2A), while there was no discernible bactericidal activity in nutrient-replete acidic medium (Fig. 2C). Additionally, the bactericidal activity of PZA at neutral pH demonstrates dose-dependent activity with a minimum bactericidal concentration of 1.6 mM (Fig. 2B).
FIG 2.

Survival kinetics and dose response of nutrient-limited and -replete M. tuberculosis cells treated with PZA. M. tuberculosis strain H37Ra cells were inoculated in PBS (pH 7.0) containing tyloxapol (0.05%) (A and B) or in 7H9 medium containing OADC (10%), glycerol (0.2%), and tyloxapol (0.05%) at pH 5.8 (C). Cells were treated with dimethyl sulfoxide (DMSO) (diamonds) or PZA (squares) at the indicated concentrations. Survival kinetics were determined by plating for CFU at the indicated time points (A and C). For the PZA dose response under nutrient limitation conditions, bacilli were incubated for 3 weeks in the presence of the indicated concentrations of PZA, after which cells were plated for CFU enumeration (B). Data shown are the means ± standard deviations of data from 3 independent experiments.
Effects of PZA and POA on M. tuberculosis cytoplasmic acidification.
To address the longstanding question of whether POA functions as a protonophore, we utilized a pH-sensitive green fluorescent protein (pH-GFP) (26, 32) that enabled us to monitor the intrabacterial pH of live M. tuberculosis cells. Our rationale was that POA should function in a fashion similar to that of the characterized protonophore carbonyl cyanide 3-chlorophenylhydrazine (CCCP) (33). Growing M. tuberculosis cells were treated with CCCP, the sodium ionophore monensin (34), POA (Fig. 3A), and PZA (Fig. 3B) at the MIC and concentrations 10-fold above and below the MIC. CCCP and monensin induced rapid and dose-dependent acidification of the cytoplasm (Fig. 4A and B). Indeed, mild cytoplasmic acidification was observed at concentrations 10-fold below the MIC for these ionophores. In stark contrast, POA did not induce measurable cytoplasmic acidification over 2 h of incubation when included at the MIC (Fig. 4C). However, slight acidification was observed when POA was present at a concentration 10-fold above the MIC (Fig. 4C). Similar to results obtained with POA, no significant cytoplasmic acidification was observed with PZA, even at the highest concentration tested (Fig. 4D). When M. tuberculosis was exposed to PZA and POA over several days, there was slow and subtle acidification of the cytoplasm (Fig. 4E and F). To determine if this slow acidification was associated with PZA-mediated inhibition of M. tuberculosis growth or a secondary consequence of PZA action, we monitored the intrabacterial pH of PZA-treated M. tuberculosis cells overexpressing pncA at neutral pH. PZA treatment resulted in growth inhibition (Fig. 3C), with mild cytoplasmic acidification only at the highest concentrations of PZA examined (Fig. 4G). Significantly, lower PZA concentrations that fully inhibited growth did not induce cytoplasmic acidification (Fig. 4G).
FIG 3.
Growth kinetics of M. tuberculosis treated with PZA or POA at pH 5.8 and 7.0. The growth of M. tuberculosis strain H37Ra (A and B) or H37Ra/pUMN007::pncA (C) in 7H9 medium containing OADC (10%), glycerol (0.2%), and tyloxapol (0.05%) at pH 5.8 (A and B) or pH 7.0 (C) is shown. The cultures were treated with no drug (squares) or with either PZA (A and C) or POA (B) at concentrations 10-fold below the MIC (diamonds), at the MIC (triangles), and 10-fold above the MIC (circles). Data are the means ± standard deviations of data from 3 independent experiments.
FIG 4.
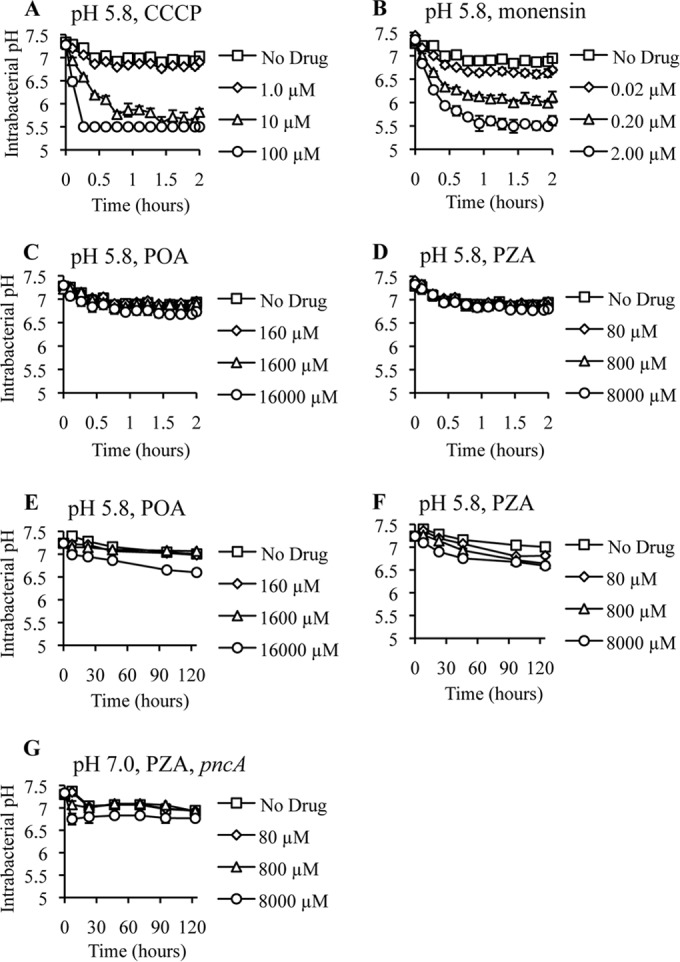
Cytoplasmic acidification kinetics of M. tuberculosis treated with CCCP, monensin, POA, or PZA at pH 5.8 and 7.0. The intrabacterial pH of M. tuberculosis strain H37Ra (A to F) or H37Ra/pUMN007::pncA (G) expressing ratiometric pH-sensitive GFP in 7H9 medium containing OADC, glycerol (0.2%), and tyloxapol (0.05%) at pH 5.8 (A to F) or pH 7.0 (G) is shown. The cultures were treated with no drug (squares) or with CCCP (A), monensin (B), POA (C and E), or PZA (D and F) at concentrations 10-fold below the MIC (diamonds), at the MIC (triangles), and 10-fold above the MIC (circles). pH 5.5 was the limit of detection. Data are the means ± standard deviations of data from 3 independent experiments.
Impact of POA on membrane potential in acidic medium.
Given the lack of cytoplasmic acidification, we proceeded to evaluate the previous suggestion that POA disrupts the membrane potential of M. tuberculosis (22). Growing M. tuberculosis H37Ra cells were treated with 10 μM CCCP as a control or POA at 0.1-, 1.0-, and 10-fold the MIC, followed by incubation with the membrane-permeable fluorescent dye DiOC2(3). Consistent with data from previous reports and our evaluation of intrabacterial pH, CCCP induced a significant loss of membrane potential (29), while concentrations of POA 10-fold above the MIC failed to significantly modify the membrane potential of M. tuberculosis at acidic pH (Fig. 5).
FIG 5.
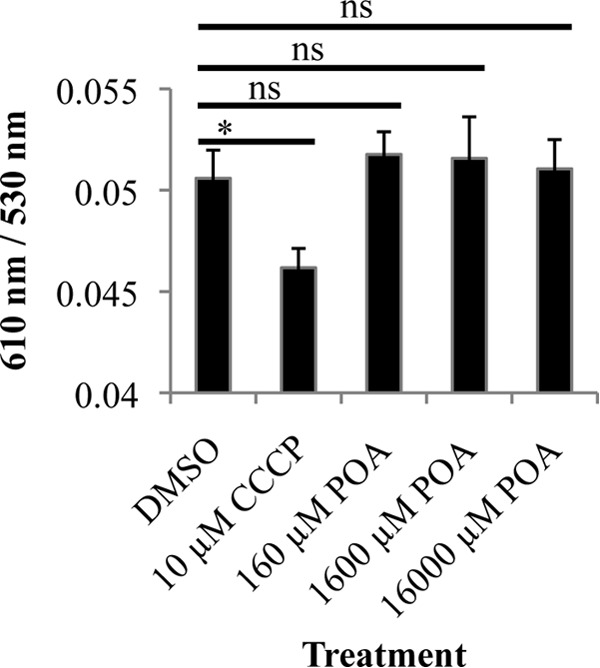
Membrane potential of M. tuberculosis treated with CCCP and POA at pH 5.8. M. tuberculosis cells in 7H9 medium containing OADC, glycerol (0.2%), and tyloxapol (0.05%) at pH 5.8 were treated with CCCP or POA at the indicated concentrations for 30 min. After 30 min of treatment, the fluorescent dye DiOC2(3) was used to assess membrane potential by monitoring the ratio of red fluorescence (610 nm) to green fluorescence (530 nm). A shift from green (530 nm), dependent on cell size, to red (610 nm), dependent on cell size and membrane potential, indicates the presence of membrane potential. Data are the means ± standard deviations of data from 3 independent experiments (*, P < 0.05; ns, not significant).
DISCUSSION
The increasing threat to TB therapy posed by drug-resistant strains of M. tuberculosis necessitates a deeper understanding of PZA action and potentiation. Therefore, in this study, we investigated the dependence of PZA susceptibility in M. tuberculosis on environmental pH. Overexpression of PncA in M. tuberculosis conferred hypersusceptibility to PZA at acidic, neutral, and alkaline pH. Furthermore, bactericidal activity of PZA against M. tuberculosis under conditions of nutrient limitation at neutral pH was observed. These observations demonstrate that an acidic environment is not essential to sensitize M. tuberculosis to PZA. Accordingly, while acidic incubation conditions potentiate the action of PZA, growth inhibition by POA is far less dependent upon acidic pH. Indeed, we found that M. tuberculosis is susceptible to POA at neutral and alkaline pH. A possible explanation for the disparity in pH requirements for POA and PZA actions could lie in differences in the rates of accumulation of a critical concentration of POA. Indeed, it has been demonstrated that POA accumulates more readily under acidic incubation conditions (18). Additionally, the disparity in pH requirements could possibly be explained by differing mechanisms of action at acidic and neutral pH. It was previously reported that Streptococcus bovis lowers its internal pH to prevent significant anion accumulation and thereby enables growth at a reduced pH in the presence of abundant organic acids (35). Therefore, the growth inhibition under neutral-pH conditions could be due to significant POA anion accumulation. However, the observation that POA inhibits growth at neutral and alkaline pH suggests that this model is unlikely and that the intracellular target(s) of POA requires a critical concentration of POA for inhibition.
Significantly, acid-mediated potentiation of PZA susceptibility is independent of changes in the expression of pncA in both attenuated and virulent strains of M. tuberculosis, H37Ra and H37Rv, respectively. It is worth noting, though, that H37Ra carries a single nucleotide polymorphism in phoP conferring a nonsynonymous serine-to-leucine change at position 219 in PhoP that compromises its DNA binding function (36). phoP encodes the DNA response regulator PhoP of the two-component signal transduction system PhoPR. Previous studies demonstrated a role for PhoPR in the acid stress response (37). Considering that H37Ra and H37Rv have similar pncA expression levels, the activation of PZA does not appear to be a consequence of PhoP or acidic pH, although these findings do not exclude the possibility that other PhoPR acid-responsive targets could have relevance in PZA activity. Changes in the PhoP regulon could provide a possible explanation for the discrepancy in PZA MICs at pH 5.8 between H37Ra and H37Rv.
A key facet of the proton ionophore model of PZA action is the suggestion that POA drives acidification of the M. tuberculosis cytoplasm. While previous studies reported acidification of the M. tuberculosis cytoplasm upon treatment with PZA, those studies were conducted under conditions of starvation and extreme acid stress (pH 4.5) (38). In contrast to those findings, we observed only minimal acidification of the M. tuberculosis cytoplasm following PZA or POA treatment in nutrient-replete, moderately acidic medium (pH 5.8). Importantly, PZA and POA showed drastically delayed and less substantial degrees of acidification than the well-characterized ionophores monensin and CCCP, which exhibited rapid and dose-dependent acidification. Additionally, concentrations of POA that were at least 1,600-fold higher than the molar equivalent concentration of CCCP that confers cytoplasmic acidification demonstrated no appreciable acidification. Furthermore, POA failed to significantly alter the membrane potential at acidic pH, suggesting that the active form of POA does not appear to function as a robust protonophore.
Prolonged incubation of M. tuberculosis with PZA or POA eventually resulted in modest acidification. The acidification of the cytoplasm after extended incubation with POA is not surprising considering that POA has been demonstrated to reduce ATP production in Mycobacterium bovis (39), which could ultimately compromise membrane potential and allow cytoplasmic acidification as a secondary consequence. Conversely, acidification conferred by PZA treatment could involve the PncA-dependent production of ammonia. A previous report suggested that ammonia produced by PncA hydrolysis of PZA could contribute to an eventual acidification of the cytoplasm through bacterial efflux of ammonia and proton accumulation (31). This phenomenon could explain the initial acidification observed with the highest concentration of PZA tested. Notably, though, inhibitory concentrations of POA and PZA do not lead to a marked decrease in intrabacterial pH, suggesting that growth arrest does not necessitate cytoplasmic acidification. Taken together, these data demonstrate that susceptibility of M. tuberculosis to PZA and POA is independent of environmental pH and is not attributable to cytoplasmic acidification and proton shuttling.
ACKNOWLEDGMENTS
This work was supported by a grant from the NIAID (7UM1 AI068636-07) and institutional startup funds from the University of Minnesota to A.D.B. B.C.R. was supported by an ASM undergraduate research fellowship and a UROP fellowship from the University of Minnesota. N.A.D. was supported by an institutional training grant from the NHLBI (T32 HL07741).
We thank Sabine Ehrt for providing plasmid pUV15-pHGFP and William R. Jacobs, Jr., for providing M. tuberculosis strains H37Ra and H37Rv. We thank Dean Crick for helpful comments and thoughtful discussions.
REFERENCES
- 1.Anonymous. 1981. A controlled trial of six months chemotherapy in pulmonary tuberculosis. First report: results during chemotherapy. British Thoracic Association. Br J Dis Chest 75:141–153. [DOI] [PubMed] [Google Scholar]
- 2.Anonymous. 2014. Global tuberculosis report 2014. World Health Organization, Geneva, Switzerland. [Google Scholar]
- 3.Scorpio A, Zhang Y. 1996. Mutations in pncA, a gene encoding pyrazinamidase/nicotinamidase, cause resistance to the antituberculous drug pyrazinamide in tubercle bacillus. Nat Med 2:662–667. doi: 10.1038/nm0696-662. [DOI] [PubMed] [Google Scholar]
- 4.Konno K, Feldmann FM, McDermott W. 1967. Pyrazinamide susceptibility and amidase activity of tubercle bacilli. Am Rev Respir Dis 95:461–469. [DOI] [PubMed] [Google Scholar]
- 5.Boshoff HIM, Xu X, Tahlan K, Dowd CS, Pethe K, Camacho LR, Park T-H, Yun C-S, Schnappinger D, Ehrt S, Williams KJ, Barry CE. 2008. Biosynthesis and recycling of nicotinamide cofactors in Mycobacterium tuberculosis: an essential role for NAD in nonreplicating bacilli. J Biol Chem 283:19329–19341. doi: 10.1074/jbc.M800694200. [DOI] [PMC free article] [PubMed] [Google Scholar]
- 6.Vilchèze C, Weinrick B, Wong K-W, Chen B, Jacobs WR Jr. 2010. NAD(+) auxotrophy is bacteriocidal for the tubercle bacilli. Mol Microbiol 76:365–377. doi: 10.1111/j.1365-2958.2010.07099.x. [DOI] [PMC free article] [PubMed] [Google Scholar]
- 7.Zhang Y, Shi W, Zhang W, Mitchison D. 2013. Mechanisms of pyrazinamide action and resistance. Microbiol Spectr 2:MGM2-0023-2013. doi: 10.1128/microbiolspec.MGM2-0023-2013. [DOI] [PMC free article] [PubMed] [Google Scholar]
- 8.Shi W, Zhang X, Jiang X, Yuan H, Lee JS, Barry CE, Wang H, Zhang W, Zhang Y. 2011. Pyrazinamide inhibits trans-translation in Mycobacterium tuberculosis. Science 333:1630–1632. doi: 10.1126/science.1208813. [DOI] [PMC free article] [PubMed] [Google Scholar]
- 9.Dillon NA, Peterson ND, Rosen BC, Baughn AD. 2014. Pantothenate and pantetheine antagonize the antitubercular activity of pyrazinamide. Antimicrob Agents Chemother 58:7258–7263. doi: 10.1128/AAC.04028-14. [DOI] [PMC free article] [PubMed] [Google Scholar]
- 10.Shi W, Chen J, Feng J, Cui P, Zhang S, Weng X, Zhang W, Zhang Y. 2014. Aspartate decarboxylase (PanD) as a new target of pyrazinamide in Mycobacterium tuberculosis. Emerg Microbes Infect 3:e58. doi: 10.1038/emi.2014.61. [DOI] [PMC free article] [PubMed] [Google Scholar]
- 11.Zhang S, Chen J, Shi W, Liu W, Zhang W, Zhang Y. 2013. Mutations in panD encoding aspartate decarboxylase are associated with pyrazinamide resistance in Mycobacterium tuberculosis. Emerg Microbes Infect 2:e34. doi: 10.1038/emi.2013.38. [DOI] [PMC free article] [PubMed] [Google Scholar]
- 12.Anonymous. 1974. Controlled clinical trial of four short-course (6-month) regimens of pulmonary tuberculosis: third report. East African/British Medical Research Councils. Lancet 2:237–240. [PubMed] [Google Scholar]
- 13.Dessau FI, Yeager RL, Burger FJ, Williams JH. 1952. Pyrazinamide (aldinamide) in experimental tuberculosis of the guinea pig. Am Rev Tuberc 65:519–522. [PubMed] [Google Scholar]
- 14.Yeager RL, Munroe WG, Dessau FI. 1952. Pyrazinamide (aldinamide) in the treatment of pulmonary tuberculosis. Am Rev Tuberc 65:523–546. [PubMed] [Google Scholar]
- 15.Malone LSA, Lindh H, McKenzie D, Kiser JS, Williams JH. 1952. The effect of pyrazinamide (aldinamide) on experimental tuberculosis in mice. Am Rev Tuberc 65:511–518. [PubMed] [Google Scholar]
- 16.Tarshis M, Weed WJ. 1953. Lack of significant in vitro sensitivity of Mycobacterium tuberculosis to pyrazinamide on three different solid media. Am Rev Tuberc 67:391–395. [DOI] [PubMed] [Google Scholar]
- 17.McDermott W, Tompsett R. 1954. Activation of pyrazinamide and nicotinamide in acidic environments in vitro. Am Rev Tuberc 70:748–754. [DOI] [PubMed] [Google Scholar]
- 18.Zhang Y, Scorpio A, Nikaido H, Sun Z. 1999. Role of acid pH and deficient efflux of pyrazinoic acid in unique susceptibility of Mycobacterium tuberculosis to pyrazinamide. J Bacteriol 181:2044–2049. [DOI] [PMC free article] [PubMed] [Google Scholar]
- 19.Huang Q, Chen Z-F, Li Y-Y, Zhang Y, Ren Y, Fu Z, Xu S-Q. 2007. Nutrient-starved incubation conditions enhance pyrazinamide activity against Mycobacterium tuberculosis. Chemotherapy 53:338–343. doi: 10.1159/000107723. [DOI] [PubMed] [Google Scholar]
- 20.Chen Z-F, Huang Q, Li Y-Y, Zhang Y, Ren Y, Li K-S, Fu Z, Xu S-Q. 2007. Nutrient-starved incubation conditions enhance pyrazinamide activity against Mycobacterium tuberculosis. Zhonghua Jie He He Hu Xi Za Zhi 30:359–362. [PubMed] [Google Scholar]
- 21.Wade MM, Zhang Y. 2004. Anaerobic incubation conditions enhance pyrazinamide activity against Mycobacterium tuberculosis. J Med Microbiol 53:769–773. doi: 10.1099/jmm.0.45639-0. [DOI] [PubMed] [Google Scholar]
- 22.Zhang Y, Wade MM, Scorpio A, Zhang H, Sun Z. 2003. Mode of action of pyrazinamide: disruption of Mycobacterium tuberculosis membrane transport and energetics by pyrazinoic acid. J Antimicrob Chemother 52:790–795. doi: 10.1093/jac/dkg446. [DOI] [PubMed] [Google Scholar]
- 23.Zimhony O, Cox JS, Welch JT, Vilchèze C, Jacobs WR Jr. 2000. Pyrazinamide inhibits the eukaryotic-like fatty acid synthetase I (FASI) of Mycobacterium tuberculosis. Nat Med 6:1043–1047. doi: 10.1038/79558. [DOI] [PubMed] [Google Scholar]
- 24.Miotto P, Cirillo DM, Migliori GB. 2015. Drug resistance in Mycobacterium tuberculosis: molecular mechanisms challenging fluoroquinolones and pyrazinamide effectiveness. Chest 147:1135–1143. doi: 10.1378/chest.14-1286. [DOI] [PubMed] [Google Scholar]
- 25.Heifets L. 2002. Susceptibility testing of Mycobacterium tuberculosis to pyrazinamide. J Med Microbiol 51:11–12. doi: 10.1099/0022-1317-51-1-11. [DOI] [PubMed] [Google Scholar]
- 26.Vandal OH, Pierini LM, Schnappinger D, Nathan CF, Ehrt S. 2008. A membrane protein preserves intrabacterial pH in intraphagosomal Mycobacterium tuberculosis. Nat Med 14:849–854. doi: 10.1038/nm.1795. [DOI] [PMC free article] [PubMed] [Google Scholar]
- 27.Zhang Y, Permar S, Sun Z. 2002. Conditions that may affect the results of susceptibility testing of Mycobacterium tuberculosis to pyrazinamide. J Med Microbiol 51:42–49. doi: 10.1099/0022-1317-51-1-42. [DOI] [PubMed] [Google Scholar]
- 28.Baughn AD, Deng J, Vilcheze C, Riestra A, Welch JT, Jacobs WR Jr, Zimhony O. 2010. Mutually exclusive genotypes for pyrazinamide and 5-chloropyrazinamide resistance reveal a potential resistance-proofing strategy. Antimicrob Agents Chemother 54:5323–5328. doi: 10.1128/AAC.00529-10. [DOI] [PMC free article] [PubMed] [Google Scholar]
- 29.Eoh H, Rhee KY. 2013. Multifunctional essentiality of succinate metabolism in adaptation to hypoxia in Mycobacterium tuberculosis. Proc Natl Acad Sci U S A 110:6554–6559. doi: 10.1073/pnas.1219375110. [DOI] [PMC free article] [PubMed] [Google Scholar]
- 30.Ehrt S, Guo XV, Hickey CM, Ryou M, Monteleone M, Riley LW, Schnappinger D. 2005. Controlling gene expression in mycobacteria with anhydrotetracycline and Tet repressor. Nucleic Acids Res 33:e21. doi: 10.1093/nar/gni013. [DOI] [PMC free article] [PubMed] [Google Scholar]
- 31.Boshoff HIM, Mizrahi V. 2000. Expression of Mycobacterium smegmatis pyrazinamidase in Mycobacterium tuberculosis confers hypersensitivity to pyrazinamide and related amides. J Bacteriol 182:5479–5485. doi: 10.1128/JB.182.19.5479-5485.2000. [DOI] [PMC free article] [PubMed] [Google Scholar]
- 32.Miesenbock G, De Angelis DA, Rothman JE. 1998. Visualizing secretion and synaptic transmission with pH-sensitive green fluorescent proteins. Nature 394:192–195. doi: 10.1038/28190. [DOI] [PubMed] [Google Scholar]
- 33.Kasianowicz J, Benz R, McLaughlin S. 1984. The kinetic mechanism by which CCCP (carbonyl cyanidem-chlorophenylhydrazone) transports protons across membranes. J Membr Biol 82:179–190. doi: 10.1007/BF01868942. [DOI] [PubMed] [Google Scholar]
- 34.Huczyński A, Janczak J, Łowicki D, Brzezinski B. 2012. Monensin A acid complexes as a model of electrogenic transport of sodium cation. Biochim Biophys Acta 1818:2108–2119. doi: 10.1016/j.bbamem.2012.04.017. [DOI] [PubMed] [Google Scholar]
- 35.Russell JB. 1991. Resistance of Streptococcus bovis to acetic acid at low pH: relationship between intracellular pH and anion accumulation. Appl Environ Microbiol 57:255–259. [DOI] [PMC free article] [PubMed] [Google Scholar]
- 36.Lee JS, Krause R, Schreiber J, Mollenkopf H-J, Kowall J, Stein R, Jeon B-Y, Kwak J-Y, Song M-K, Patron JP, Jorg S, Roh K, Cho S-N, Kaufmann SHE. 2008. Mutation in the transcriptional regulator PhoP contributes to avirulence of Mycobacterium tuberculosis H37Ra strain. Cell Host Microbe 3:97–103. doi: 10.1016/j.chom.2008.01.002. [DOI] [PubMed] [Google Scholar]
- 37.Baker JJ, Johnson BK, Abramovitch RB. 2014. Slow growth of Mycobacterium tuberculosis at acidic pH is regulated by phoPR and host-associated carbon sources. Mol Microbiol 94:56–69. doi: 10.1111/mmi.12688. [DOI] [PMC free article] [PubMed] [Google Scholar]
- 38.Darby CM, Ingólfsson HI, Jiang X, Shen C, Sun M, Zhao N, Burns K, Liu G, Ehrt S, Warren JD, Anderson OS, Brickner SJ, Nathan C. 2013. Whole cell screen for inhibitors of pH homeostasis in Mycobacterium tuberculosis. PLoS One 8:e68942. doi: 10.1371/journal.pone.0068942. [DOI] [PMC free article] [PubMed] [Google Scholar]
- 39.Lu P, Haagsma AC, Pham H, Maaskant JJ, Mol S, Lill H, Bald D. 2011. Pyrazinoic acid decreases the proton motive force, respiratory ATP synthesis activity, and cellular ATP levels. Antimicrob Agents Chemother 55:5354–5357. doi: 10.1128/AAC.00507-11. [DOI] [PMC free article] [PubMed] [Google Scholar]