

Abstract
Colistin has been revived, in the era of extensively drug-resistant (XDR) Gram-negative infections, as the last-resort treatment in critically ill patients. Recent studies focusing on the optimal dosing strategy of colistin have demonstrated the necessity of a loading dose at treatment initiation (D. Plachouras, M. Karvanen, L. E. Friberg, E. Papadomichelakis, A. Antoniadou, I. Tsangaris, I. Karaiskos, G. Poulakou, F. Kontopidou, A. Armaganidis, O. Cars, and H. Giamarellou, Antimicrob Agents Chemother 53:3430–3436, 2009, http://dx.doi.org/10.1128/AAC.01361-08; A. F. Mohamed, I. Karaiskos, D. Plachouras, M. Karvanen, K. Pontikis, B. Jansson, E. Papadomichelakis, A. Antoniadou, H. Giamarellou, A. Armaganidis, O. Cars, and L. E. Friberg, Antimicrob Agents Chemother 56:4241– 4249, 2012, http://dx.doi.org/10.1128/AAC.06426-11; S. M. Garonzik, J. Li, V. Thamlikitkul, D. L. Paterson, S. Shoham, J. Jacob, F. P. Silveira, A. Forrest, and R. L. Nation, Antimicrob Agents Chemother 55:3284–3294, 2011, http://dx.doi.org/10.1128/AAC.01733-10). In 19 critically ill patients with suspected or microbiologically documented infections caused by XDR Gram-negative strains, a loading dose of 9 MU colistin methanesulfonate (CMS) (∼270 mg colistin base activity) was administered with a maintenance dose of 4.5 MU every 12 h, commenced after 24 h. Patients on renal replacement were excluded. CMS infusion was given over 30 min or 1 h. Repeated blood sampling was performed after the loading dose and after the 5th or 6th dose. Colistin concentrations and measured CMS, determined after hydrolization to colistin and including the partially sulfomethylated derivatives, were determined with a liquid chromatography-tandem mass spectrometry assay. Population pharmacokinetic analysis was conducted in NONMEM with the new data combined with data from previous studies. Measured colistimethate concentrations were described by 4 compartments for distribution and removal of sulfomethyl groups, while colistin disposition followed a 1-compartment model. The average observed maximum colistin A plus B concentration was 2.65 mg/liter after the loading dose (maximum time was 8 h). A significantly higher availability of the measured A and B forms of colistimethate and colistin explained the higher-than-expected concentrations in the present study compared to those in previous studies. Creatinine clearance was a time-varying covariate of colistimethate clearance. The incidence of acute renal injury was 20%.
INTRODUCTION
The increase in the incidence of antimicrobial resistance among Gram-negative bacteria in combination with the dry antimicrobial drug development pipeline is a serious threat in the management of nosocomial infections (1). Therefore, the World Health Organization (WHO) has identified antimicrobial resistance as one of the major problems for human health (2), whereas the Infectious Diseases Society of America (IDSA) has denominated this phenomenon “ESKAPE,” from the initials of the most frequent multidrug-resistant (MDR) microorganisms, i.e., Enterococcus faecium, Staphylococcus aureus, Klebsiella pneumoniae, Acinetobacter baumannii, Pseudomonas aeruginosa, and Enterobacter spp., emphasizing their capability to evade the effect of antibacterial agents (3). Therefore, based on the deprived antimicrobial armamentarium, the revival of old antibacterial agents, e.g., colistin, to combat serious Gram-negative infections has been characterized as a state of “back to the future” (1).
Colistin was first isolated in Japan in 1949 from Bacillus polymyxa var. colistinus and became available for clinical use in 1959. It has not been subjected to rigorous drug development procedures and regulatory scrutiny. Colistin is a peptide antibiotic consisting of two main components, colistin A (polymyxin E1) and colistin B (polymyxin E2). It is systemically administered in the form of a prodrug, colistin methanesulfonate (CMS), which is less toxic and which is hydrolyzed to a number of intermediate species both in vitro and in vivo before forming colistin (1, 4). During the last decade, methods were developed minimizing the hydrolysis of CMS of colistin during work-up and utilizing liquid chromatography-tandem mass spectrometry (LC-MS/MS) for quantification of colistin concentrations (5), and these have entered colistin into a revolutionary period where a better characterization of the colistin pharmacokinetics (PK) has been made possible. This assay method measures colistin A and colistin B (5), while other potentially active components produced from the CMS formulation are ignored. In addition, the concentration of compounds resulting from the removal of each of the five sulfomethyl groups in the formation of colistin from colistimethate cannot be determined separately, and they have been lumped together as measured colistimethate. This may have consequences when comparing the results from pharmacokinetic studies using different CMS providers and analytical conditions.
A pharmacokinetic study on CMS dosing at 3 MU every 8 h indicated that colistin has a long half-life, resulting in insufficient concentrations for the first 48 h after the initiation of treatment. Predictions from developed population pharmacokinetic models of CMS and colistin have demonstrated the necessity of a loading dose at treatment initiation, and longer dosing intervals also have been suggested (6–8). A loading dose of 6 MU CMS has been studied; however, colistin concentrations were below MIC breakpoints at 8 h, rendering a higher loading dose necessary (7, 9, and http://www.eucast.org/).
The aim of this study was to evaluate CMS and colistin pharmacokinetics following a 9-MU CMS loading dose in critically ill patients and to reinvestigate potential covariates by pooling data with those of previous studies on lower loading doses (6, 7).
MATERIALS AND METHODS
Subjects.
Patients admitted to the 6th Department of Internal Medicine and Intensive Care Unit (ICU) of the Hygeia General Hospital, as well as the 1st Department of Respiratory Diseases–Intensive Care Unit of Sotiria Chest Diseases and General Hospital in Athens, Greece, hospitalized between February 2012 and November 2012, were defined prospectively as case patients if they fulfilled the following criteria: (i) age above 18 years and (ii) necessity of intravenous colistin administration as empirical treatment or for microbiologically proven infections by extensively drug-resistant (XDR) Gram-negative bacteria.
For each patient, the following data were recorded on the day of colistin administration: age, gender, body weight (actual and ideal), primary diagnosis, APACHE II (Acute Physiology and Chronic Health Evaluation II) score, source of infection, and serum creatinine, serum albumin, hemoglobin, and hematocrit levels. The serum creatinine level was measured on days 1 to 7, 14, and 28, and creatinine clearance (CLCR) was calculated according to the Cockcroft-Gault formula (10). The incidence of acute renal injury (AKI) was evaluated by applying the RIFLE criteria (11). Written informed consent was obtained from all patients or legal representatives, and the study was performed in accordance with good clinical practice guidelines. The study protocol was approved by the Ethics Committee of each institution (Hygeia General Hospital [registration no. 552/14-12-2011] and Sotiria Chest Diseases and General Hospital [registration nο. 9441/24-4-12]).
Colistin administration.
Colistimethate sodium [CMS] (colistin; Norma, Greece) was administered at a loading dose of 9 million units (MU; approximately 270 mg of colistin base activity [CBA]). A maintenance dose was commenced 24 h after administration of the CMS loading dose at a dosage of 4.5 MU (approximately 140 mg CBA) every 12 h. In patients with a calculated creatinine clearance of less than 60 ml/min, the maintenance dose was reduced based on a modified formula from Garonzik et al. (daily maintenance colistin dose [IU] = CLCR/10 + 2) (1, 8). CMS was dissolved in 100 ml of normal saline, and the infusion time was randomized to either 30 min or 1 h.
Sampling.
Venous blood was collected immediately before the loading dose and at 30, 60, 120, 240, 480, and 720 min after the end of infusion and immediately before the second dose. In addition, samples were collected before the fifth or sixth infusion and at 60, 240, and 720 min after the end of the fifth and sixth doses. A total of 12 samples were collected for each patient. All blood samples were immediately centrifuged and chilled to minimize the formation of colistin from colistimethate. The plasma was stored at −70°C until analyzed.
Analytical method of determination of CMS and colistin concentrations.
Colistin A and colistin B plasma concentrations were determined by the liquid chromatography-tandem mass spectrometry method as described earlier (5). With this analysis method, <1% colistimethate is transformed to colistin during the work-up procedure, i.e., there is minimal elevation in colistin concentration due to the hydrolysis of colistimethate in the sample. The measured colistimethate concentration subsequently was determined as the difference in colistin concentration in the sample before and after forced hydrolysis with sulfuric acid (12). Therefore, the partly sulfomethylated colistin compounds were defined as colistimethate using this method.
For graphical purposes, an average molar mass of colistimethate A and colistimethate B (1,628 g/mol) was used to compute the colistimethate A plus B concentrations from the determined colistin A plus B concentrations (1,163 g/mol). In the modeling, moles were used for doses (1 MU corresponded to 45.9 mol CMS) and drug concentrations and were converted to milligrams per liter for graphical purposes only. For 100 μl plasma, the limits of quantification (LOQ) were 0.019 mg/liter for colistin A and 0.010 mg/liter for colistin B. Colistimethate concentrations determined to be <0.12 mg/liter were set to be below the LOQ in the PK analysis (7). The coefficients of variation (CV) for intra- and interday variation were less than 6.2% for colistin and less than 8.8% for CMS.
Population pharmacokinetic modeling.
Similar to earlier studies, there was a constant ratio of colistin A to colistin B within subjects; therefore, total colistin (colistin A plus colistin B) was modeled. As indicated above, the plasma concentration data were in molar units in the analyzed data set to adequately account for the fact that one molecule of colistimethate is hydrolyzed into one molecule of colistin. The data were log transformed and pooled with data from two earlier studies from similar patient populations (6, 7) to form a data set of 47 patients.
In the modeling, the estimated colistin PK parameters were scaled to the unknown fraction of administered CMS formed into colistin (fm). The starting point was a model described earlier (7), with two compartments for colistimethate and one compartment for colistin. Alternative structures were tested, for example, chains of compartments representing the apparent delay in forming colistin from colistimethate due to the required hydrolysis of the five sulfomethyl groups.
The parameters were estimated using nonlinear mixed-effects modeling where the typical tendencies in the population, as well as the interindividual variability (IIV), interoccasion variability (IOV), and residual errors, can be estimated. IIV and IOV were log-normally distributed, and the residual error was evaluated to be additive, proportional, or both additive and proportional. Colistimethate and colistin were allowed to share one component of the residual error, since both compounds were determined from the same sample. Covariate model building was focused on covariates earlier suggested to be of relevance for colistimethate and colistin disposition, i.e., body weight and creatinine clearance (7, 8).
Discrimination between models was driven by the objective function value (OFV) and visual predictive checks (VPCs). For nested models, a drop in OFV (−2 log likelihood) of at least 10.83 was needed to select the more complex model (corresponding to a P value of <0.001 for 1 degree of freedom). For covariates, a reduction in IIV was also a requirement for covariate inclusion. Model evaluation was performed by prediction-corrected VPCs, where a total of 500 replicates of the original data set were simulated and the observed 5th, 50th, and 95th percentiles of the simulated data were compared to the corresponding percentiles of the observed data.
Software.
The plasma concentration data were analyzed using the first-order conditional estimation method (FOCE) with interaction within the population analysis software NONMEM (version 7.3; Icon Development Solutions, Ellicott City, MD). Colistimethate and colistin concentrations measured to be below the LOQ were handled by using the M3 method in NONMEM (13). PsN and Xpose were used for the execution of models and for creating VPCs (14). R (version 3.1.2; www.r-project.org) and ggplot were used for data exploration (15).
RESULTS
Patients.
A total of 19 patients were enrolled in the study. Specifically, 11 men and 8 women were included. The mean age was 56.2 years (range, 18 to 86 years). The median calculated creatinine clearance was 92.1 ± 54.8 ml/min on the first day of treatment, with a mean serum creatinine value of 0.89 mg/dl. In the PK analysis, creatinine clearance was capped at 150 ml/min. Furthermore, the mean APACHE II score was estimated at 18.4, while the mean serum albumin level was 2.8 g/dl. Demographic and clinical data of the enrolled patients are presented in Table 1.
TABLE 1.
Patient characteristicsa
| No. | Gender | Age (yr) | BW (IBWb; kg) | Dose (MU; q12h) | Serum CR (mg/dl) | CLCRc (ml/min) | Serum Alb (g/dl) | APACHE II score | Reason for colistin use | Pathogen or purpose |
|---|---|---|---|---|---|---|---|---|---|---|
| 1 | F | 29 | 100 (45) | 4.5 | 0.6 | 98 | 2.5 | 10 | cUTI | K. pneumoniae |
| 2 | F | 54 | 65 (50) | 4.5 | 0.6 | 85 | 2.8 | 31 | VAP | A. baumannii |
| 3 | M | 77 | 70 (75) | 4.5 | 0.4 | 153 | 2.8 | 20 | VAP | A. baumannii |
| 4 | F | 46 | 60 (55) | 4.5 | 0.7 | 87 | 2.4 | 19 | VAP | P. aeruginosa |
| 5 | M | 77 | 60 (70) | 2.0 | 2.1 | 29 | 2.5 | 29 | VAT | Citrobacter spp. |
| 6 | F | 66 | 60 (50) | 3.0 | 0.9 | 48 | 3.3 | 23 | VAT | Empirical use |
| 7 | M | 67 | 95 (80) | 4.5 | 1 | 81 | 3.0 | 21 | cIAI | Empirical use |
| 8 | M | 34 | 75 (80) | 4.5 | 0.5 | 220 | 3.0 | 16 | VAP | P. aeruginosa |
| 9 | F | 63 | 70 (60) | 3.0 | 1.4 | 39 | 2.5 | 25 | VAP | P. aeruginosa |
| 10 | F | 62 | 75 (60) | —d | 0.4 | 138 | 2.9 | 22 | BSI | K. pneumoniae |
| 11 | F | 43 | 65 (60) | 4.5 | 0.6 | 114 | 2.8 | 14 | VAT | A. baumannii |
| 12 | M | 66 | 120 (70) | 5.0 | 0.7 | 70 | 3.1 | 22 | VAT | A. baumannii |
| 13 | M | 36 | 100 (85) | 4.5 | 0.6 | 204 | 2.0 | 11 | Necrotizing fasciitis | A. baumannii |
| 14 | M | 61 | 95 (60) | 3.0 | 1.6 | 41 | 3.0 | 20 | VAP | A. baumannii |
| 15 | F | 81 | 110 (60) | 3.0 | 1.1 | 38 | 2.7 | 14 | VAP | A. baumannii |
| 16 | M | 86 | 80 (65) | 4.5 | 1.1 | 44 | 2.6 | 22 | CRBSI | A. baumannii |
| 17 | M | 18 | 50 (55) | 4.5 | 1 | 85 | 2.9 | 20 | BSI | K. pneumoniae |
| 18 | M | 80 | 70 (65) | 4.5 | 0.9 | 60 | 4.7 | 10 | VAT | P. aeruginosa |
| 19 | M | 21 | 55(65) | 4.5 | 0.8 | 115 | 2.0 | 9 | cIAI | P. aeruginosa |
Abbreviations: Alb, albumin; BSI, bloodstream infection; IBW, ideal body weight; cIAI, complicated intra-abdominal infection; CR, creatinine; CRBSI, catheter-related bloodstream infection; cUTI, complicated urinary tract infection; q12h, every 12 h; F, female; M, male; VAP, ventilator-associated pneumonia; VAT, ventilator-associated tracheobronchitis.
IBW was calculated based on the formula (for males) IBW = 50 kg + 2.1 kg for each inch (2.54 cm) over 5 feet (152.4 cm) and (for females) IBW = 45.5 kg + 2.1 kg for each inch over 5 feet.
For the estimation of creatinine clearance, ideal body weight was used and was calculated according to the Cockcroft-Gault formula (10).
In patient 10, samples were collected only after the loading dose because the administration of CMS was discontinued.
Types of infection.
Colistin was administered for ventilator-associated pneumonia and tracheobronchitis in seven and five cases, respectively, for bacteremia caused by XDR Gram-negative bacteria in three cases, and intra-abdominal infections in two and one case of acute pyelonephritis and necrotizing fasciitis, respectively. The isolated pathogens were XDR Acinetobacter baumannii (n = 8), XDR Pseudomonas aeruginosa (n = 5), carbapenemase-producing Klebsiella pneumoniae (n = 3), and Citrobacter sp. (n = 1), all susceptible to colistin (MIC, <2 μg/ml), whereas in two patients colistin was administered empirically.
Dose of colistin: collection of samples.
In five patients with reduced creatinine clearance (29 to 48 ml/min), the dosage of colistin was altered; these patients received 4 to 6 MU daily instead of 9 MU. In all patients, samples were obtained after the first dose. In nine patients, samples were collected after the sixth dose, in four patients samples were collected after the fourth dose, and in five patients samples were collected after the fifth dose, while in one patient samples were collected only after the loading dose because the administration of CMS was discontinued.
Summary of observed concentrations.
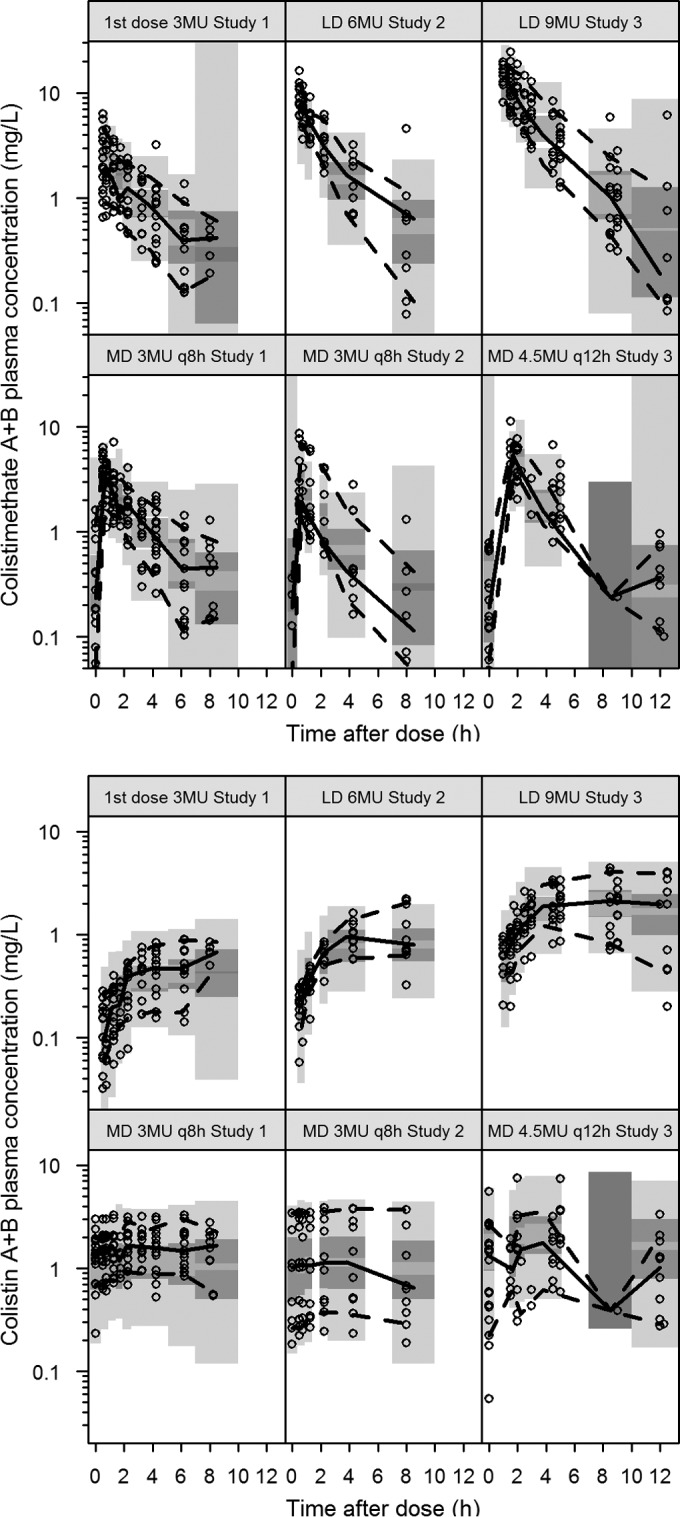
Figure 1 depicts the measured plasma concentrations of colistimethate A plus B and colistin A plus B in each patient in the current study as well as for the earlier studies (6, 7). The average maximum plasma concentration (Cmax) of colistin A plus B after the loading dose was 2.65 mg/liter, with a time to maximum concentration of drug in serum (Tmax) of 8 h. The variation of measured colistin A plus B concentrations after the loading dose was wide, with Cmax values ranging from 0.95 to 5.1 mg/liter. Of note is that patients with increased CLCR appeared to have a reduced ability to achieve colistin plasma concentrations above 2 mg/liter. Specifically, only 4 out of 12 patients with CLCR of >80 ml/min achieved plasma concentrations of >2 mg/liter at steady state.
FIG 1.

Observed colistimethate and colistin plasma concentration data in the three studies included in the model development (6, 7). The data from the current study are shown in the two right panels. inf, infusion; MU, million IU; q8h, every 8 h; q12h, every 12 h. (Reprinted from reference 1 with permission of the publisher.)
Population pharmacokinetic model.
Both colistimethate and colistin displayed linear pharmacokinetics. The earlier developed structural model could describe the new data reasonably well, but to capture the initial delay in colistin formation, additional compartments were added (Fig. 2). For concentrations measured as colistimethate (CCMS), a four-compartment model fit the data best, where 2 compartments represent more complete sulfomethylation of colistin (CMS1) and 2 compartments represent partially sulfomethylated derivatives (CMS2). In the final model, conversion from CMS1 to CMS2 also was allowed to occur in the peripheral compartment, with the same rate constant as that in the central compartment. The distribution volumes of CMS1 and CMS2 were set to be the same, as the data do not contain sufficient information to have them separate. The measured CMS (CCMS) was the sum of the predicted concentrations in the two central compartments (CCMS1 plus CCMS2). For colistin, a one-compartment model was sufficient to describe the observed colistin measurements (Ccolistin).
FIG 2.

Final structural model describing disposition of CMS and colistin. CMS (CMS1) and its derivatives (CMS2) occur in two states and distribute in both a central and peripheral compartment. For the previous studies (6, 7), a portion of the CMS dose (F2) was estimated to enter in the form of derivatives, while F2 was negligible for the new study. In addition, F1 for the new study was higher than F1 plus F2 for the previous studies. Vc, central volume of distribution; Vp, peripheral volume of distribution.
It was apparent that both the CCMS and Ccolistin concentrations were higher than expected from previous studies in similar groups of patients (6, 7), with both following the loading dose, assuming dose proportionality, and being at steady state. In the model, this was accounted for by allowing the estimation of a lower total availability of all CMS doses administered in the earlier studies (6, 7); i.e., the combined fraction entering the CMS compartments (F1 plus F2) was estimated to be lower. The total availability (F1 plus F2) was estimated to be 61% compared to the formulation used in the current study (set to 100%). This indicates a higher proportion of the A and B forms (that are quantified in the assays) in more recent CMS formulations; consequently, both the CMS A plus B and the colistin A plus B concentrations will be higher in the new study. Another difference in the administered content also was incorporated in the model; the data were best described when all administered CMS entered the CMS1 compartment for the new data, while for the old studies 89% of the available A and B forms entered the CMS1 compartment and 11% entered the CMS2 compartment.
The total (apparent) estimated volume of distribution for measured colistimethate and colistin was 28 liters and 80 liters, respectively. Creatinine clearance was identified as a significant covariate for the elimination of CMS1 and CMS2 (Fig. 2). The parameter related to CLCR was not sensitive to the fact that high values were capped at 150 ml/min (0.541 with capping and 0.510 without capping). The clearance determining the hydrolysis steps from CMS1 to CMS2 and from CMS2 to colistin was estimated at 5.8 liters/h. For a CLCR of 80 ml/min, the renal clearances of CMS1 and CMS2 were 2.6 liters/h. The apparent clearance of colistin was 5.0 liters/h. The renal clearance of colistin was not significantly different from zero. The half-life of colistin was computed to be 11.2 h for a typical patient. Parameter estimates of the final model are presented in Table 2. The VPC in Fig. 3 illustrates that for all three studies, the final model captures the typical trends and the interpatient variability over time following both the loading dose and after maintenance dosing.
TABLE 2.
Estimated population pharmacokinetic parameters of CMS and colistina
| Parameter (unit) | Explanation | CMS |
Colistin |
||||
|---|---|---|---|---|---|---|---|
| Typical value | IIV (%) | IOV (%) | Typical value | IIV (%) | IOV (%) | ||
| CLNR,CMS (liters/h) | Nonrenal clearance of CMS1 and CMS2 or of formed colistin (CL/fm) | 5.84 (11) | 16 (37) | 40 (13) | 4.99 (25) | 71b (37) | 41 (14) |
| SlCRCL | Proportionality factor for renal CL of CMS1 and CMS2; CLR (liters/h) = SlCRCL × CRCL (liters/h) | 0.541 (16) | 16 (37) | 40 (13) | |||
| V1 (liters) | Volume of distribution of central compartment for CMS1 and for CMS2 or of formed colistin (V/fmcol) | 1.42 (13) | 80.4 (11) | 41 (14) | |||
| Q1 (liters/h) | Intercompartmental clearance for CMS1 | 550 (31) | |||||
| Q2 (liters/h) | Intercompartmental clearance for CMS2 | 7.75 (11) | |||||
| V2 (liters) | Volume of distribution of peripheral compartment for CMS1 and CMS2 | 12.5 (10) | 30 (13) | ||||
| Fstudy 1 and 2 | Relative availability of CMS A and B in earlier studies compared to the current work | 0.610 (7.2) | |||||
| F1study 1 and 2 | Fraction of the available CMS dose entering CMS1 compartment for earlier studies | 0.892 (4.4) | |||||
| Additive residual error (μmol/liter) | 0.159 (10) | 0.0629 (14) | 48 (16) | ||||
| Proportional error (%) | 0.157 (6.7) | 0.0884 (13) | 48 (16) | ||||
Shown are the estimated population pharmacokinetic parameters of CMS and colistin and their percent relative standard errors (RSE) for the final model based on simultaneous fit of the data from the current and previous studies in critically ill patients (6, 7). IIV, interindividual variability; IOV, interoccasion variability.
The value obtained when the variability of CL/fm was scaled from the variability of CLCMS by the estimated value of 4.52 (41% RSE).
FIG 3.
Prediction-corrected visual predictive check for the final model. Dots represent the observed data, and lines represent the 5th, 50th, and 95th percentiles of the observed data. The shaded areas are the 95% confidence intervals of the 5th, 50th, and 95th percentiles as calculated from 500 simulations from the final PK model. LD, loading dose; MD, maintenance dose. Data from studies 1 and 2 were collected earlier (6, 7), and study 3 is the current study.
There was no significant difference in the estimated pharmacokinetic parameters for the CMS components or for colistin for the 30-min versus the 1-h infusions. Based on the model, the predicted maximum concentrations of colistimethate A plus B in plasma (Cmax) were 24 mg/liter at the end of the 0.5-h infusion and 17 mg/liter at the end of a 1-h infusion of 9 MU CMS. The typical Cmax of colistin A plus B was predicted at 2.3 mg/liter with a typical Tmax of 7 h. Colistin A plus B concentrations of 1 and 2 mg/liter were predicted after 1.6 and 4 h of the start of the infusion of a 9-MU CMS dose. Following repeated administration of 4.5 MU CMS every 12 h, the Cmax values for colistimethate A plus B were 11 and 8.8 mg/liter for a 0.5- and 1-h infusion, respectively, and 2.5 mg/liter for colistin (Fig. 1).
Figure 4 illustrates predictions of the plasma concentration-time profiles for colistimethate A plus B (top row) and colistin A plus B (bottom row) following different dosing regimens for four different compositions of the administered formulation. The two columns to the left show the predictions using the presently estimated relative availability of the A plus B compounds. In the first column, all drug fractions enter CMS1 (F1 = 1), representing the current study, while in the second column a part of the available fraction enters CMS2 and the total available fraction is 0.610 (F1 = 0.544, F2 = 0.066), representing the old studies. For both colistimethate and colistin, the higher availability determined for the current, more recent study, results, as expected, in a higher exposure of the A plus B forms than what is predicted from the older studies for the corresponding dosing regimen.
FIG 4.

Predicted profiles of colistimethate (top) and colistin (bottom) following the first dose and on day 5 (steady state) for the three dosing regimens available to generate the population PK model. In all predictions, an infusion time of 30 min was applied, and CLCR was set to 80 ml/min. F1 and F2 are the fractions of the administered dose that enters the CMS compartments as A or B forms (Fig. 2). F3 is the corresponding fraction directly entering the colistin compartment (applied in the 4th column). The two left columns show the predictions based on the estimated fractions of F1 and F2 in the current study, and the new formulation is set to include 100% A or B forms of CMS. The old formulation is set to include the estimated relative percentage of 61% A or B forms of CMS. The two right columns are two hypothetical scenarios where a part of the dose enters the CMS2 compartment (F2 > 0; 3rd and 4th columns) or colistin compartment (F3 > 0; 4th column).
The two columns to the right in Fig. 4 represent two other scenarios to illustrate consequences on the observed A plus B concentrations if parts of the administered CMS is hydrolyzed to partly sulfomethylated compounds (F2 > 0) or to colistin (F3 > 0) at the time of administration, when only A and B forms are available in the administered formulation (F1 + F2 + F3 = 1). In those cases, colistimethate Cmax in the central, measurable compartments are predicted to be higher than when all CMS is entering the first compartment (F1 = 1) (Fig. 4, left). Colistin concentrations rise faster, while there is no important difference in colistin Cmax.
DISCUSSION
A loading dose of 9 MU CMS was administered in 19 critically ill patients not on renal replacement with Gram-negative infections, achieving average colistin A plus B concentrations above 2 mg/liter within the first hours of treatment initiation. Moreover, in this study a novel structural model was developed in order to depict the delay in colistin formation. In addition, an interesting finding is that in comparisons of this study with previous studies in the same patient population (6, 7), higher plasma concentrations of colistimethate A plus B and, subsequently, colistin A plus B were apparent in the current CMS formulation.
In a population analysis of 18 critically ill patients receiving a dosage of 3 MU CMS every 8 h, a 48-h period was shown to be necessary for a typical patient in order to obtain steady-state plasma colistin concentrations (6), signifying a major delay in appropriate treatment. The latter observation is of high importance, as the delayed initiation of appropriate antimicrobial therapy is associated with increased mortality in critically ill patients (16). The application of a loading dose of 9 MU resulted in a mean observed maximum plasma colistin A plus B concentration of 2.65 mg/liter at 8 h, achieving concentrations above the breakpoints of EUCAST and CLSI for Enterobacteriaceae and Acinetobacter baumannii (susceptible at <2 mg/liter) (9; http://www.eucast.org/). Therefore, the current dosage scheme is recommended as a rather efficacious dose of administration in clinical practice for critically ill patients with Gram-negative infections.
Septic shock and sepsis associated with multiple-organ failure have been reported as the most common cause of death, with mortality exceeding 50%. Major principles for the successful treatment of severe infections in the ICU include the expeditious minimization of the infectious burden to be achieved by the early administration of a potent antimicrobial regimen and blood therapeutic levels to be obtained promptly in order to accomplish pathogen clearance (17). Taking into consideration the relatively rapid therapeutic colistin concentrations achieved with the loading dose of 9 MU CMS, in combination with the effective decrease of a 3-log-unit bacterial kill predicted to be achieved in the first 6.5 h of treatment for a 9-MU loading dose in an in vitro time-kill study on the bactericidal activity of colistin against P. aeruginosa (7), the application of a loading dose in critically ill patients potentially can yield improved clinical outcome.
In the PK analysis, the new data were pooled with the data from the two earlier studies with similar patient populations (6, 7), to make up a total of 47 patients with a total of 1,144 observed colistimethate or colistin plasma concentrations determined from initial and maintenance dosing. Our final best-fit population PK model (Fig. 2) successfully described the data across all three studies (Fig. 3), characterizes the slow formation of colistin, which is consistent with observations in vitro (4), and explains the higher-than-expected A plus B plasma concentrations in the current study.
Despite a much lower CMS dose (2 MU compared to 9 MU), a recent study by Grégoire et al. found a colistin Cmax of 2.0 mg/liter 3 h after the end of the 60-min infusion (18). Apart from potential discrepancies in the analytical methods (e.g., in quantification of partly sulfomethylated compounds and potential hydrolysis during work-up), brand-to-brand variability in the composition of the CMS formulation could be an explanation (19, 20). Figure 4 illustrates that our model predicts that a lower degree of sulfomethylation (F2 and/or F3 > 0) results in higher total colistin A and B exposures with an earlier Tmax. In a comparison of CMS from six different providers in plasma in vitro, we have, however, observed that colistin formation was slow for all six brands, including the brand used by Grégoire et al. (18), with similar rates and extents of colistin formation (unpublished data).
The computed colistin elimination half-life in the study by Grégoire et al. also was shorter (3.1 h) (18) than that in our study, where it was estimated to be 11.2 h for a typical patient, and earlier studies have reported colistin half-lives of 9 to 18 h (6–8). The difference in half-lives seems primarily to arise from a difference in the estimated apparent volume of distribution (V). Grégoire et al. (18) reported a V of 26 liters (similar to that from their study of young healthy volunteers [21]), while earlier studies of patients reported values of 165 to 218 liters (6–8). However, these values are not directly comparable to those of the current study, since V of colistin is dependent on the available fraction of the A plus B form. Using the estimated relative availability between the current and old studies of 0.61 (Table 2), the 80 liters estimated in the current study would correspond to a V of approximately 131 liters in earlier studies. A wide range of pathophysiological changes occur in critically ill patients, resulting in alterations of the volume of distribution and clearance of antibiotics. Gram-negative bacteria produce endotoxins inducing a systemic inflammatory response that affect the vascular endothelium, leading to increased capillary permeability and an increase of the volume of distribution (22). These findings were not apparent in the study by Grégoire et al., as no difference was observed between healthy volunteers and critically ill patients (18, 21). The VPC in Fig. 3 illustrates that our model can describe our observations from all three studies very well in both the observed slow initial rise in plasma concentration of colistin and the steady-state concentrations.
CLCR was found to be a significant time-varying covariate for CL of colistimethate and its derivatives (CMS1 and CMS2) (Fig. 2), as observed earlier (8). An interesting finding in the present study, in agreement with previous studies (8), is that patients with creatinine clearance of >80 ml/min/1.73 m3 had a low ability to achieve colistin concentrations above 2 mg/liter at maintenance dosing of a total dose of 9 MU/day. Only 4 out of 12 patients obtained colistin levels above 2 mg/liter in the present study at steady state. This is likely because a higher proportion of CMS was cleared by renal excretion in patients with normal renal function, and less is available for the formation of colistin (20). Taking these findings into consideration, a higher maintenance dose is suggested in order to achieve colistin concentrations above 2 mg/liter. However, based on the current upper limited dosage of CMS in the summary of product characteristics (SPC), a daily dosage of 9 to 10 MU has been recommended in the United States and, most recently, in Europe (23, 24). Reports of patients treated with dosages above 10 MU had a probability of renal toxicity of up to 69% (25, 26). Therefore, based on the potential impact on renal dysfunction, a maximum daily dosage of CMS is highly suggested to not exceed 10 MU, and if dosages higher than those recommended by the manufacturers are implied, close renal function monitoring is obligatory. Therefore, for critically ill patients with CLCR of >80 ml/min, a highly active combination treatment instead of monotherapy with colistin may be preferred (8, 20).
An important issue is the considerable interindividual variability of colistin concentrations observed in the present study. In particular, the variations of colistin concentrations were wide, with values ranging from 0.95 to 5.1 mg/liter and 0.68 to 8.72 mg/liter after the loading dose of 9 MU and at steady state, respectively, implying a large variability of Cmax colistin levels between patients, in correlation with previous studies that also depicted a large variability with only a minor portion explained by individual differences in CLCR (7, 8, 18). The unexplained interindividual variability of colistin clearance also has been relatively noticeable, with values between 37 to 76% in previous studies when covariates are included, while in the current study a value of 71% was estimated. Since a pronounced variability in the concentrations between dosing administrations (IOV) also have been determined in critically ill patients (Table 2) (7, 8), the utilization of therapeutic drug monitoring (TDM) (20) may not be as valuable for the individualization of the dose as hoped.
Nephrotoxicity is the most important and common adverse effect. Based on the RIFLE criteria (11), nephrotoxicity rates range from 20 to 60%, whereas higher daily doses are associated with renal toxicity in a dose-dependent fashion (1, 25). In the present study, renal toxicity was observed in 20% of patients, corresponding to published reports with daily doses of up to 9 MU CMS (1, 27). It was reversible in all cases, without the requirement of renal replacement therapy, and no permanent renal damage was observed. However, due to the small number of patients, care must be taken and close renal monitoring is recommended. No cases of neurotoxicity were observed here despite a loading dose of 9 MU, and a low incidence rate has been reported in the modern era (1).
The successful clinical outcome of the application of a loading dose of 9 MU CMS followed by a maintenance dose of 4.5 MU CMS every 12 h has been highlighted in clinical practice in 28 critically ill patients with severe sepsis and septic shock. The clinical cure was found to be 82%, and half of the cases were treated with colistin monotherapy (28). Recently, based on available novel data about the pharmacokinetics, effectiveness, and safety of colistin, the European Medicines Agency has suggested the alteration of product information and proposed a loading dose of 9 MU CMS, with a maintenance dose of 9 MU daily divided in 2 or 3 doses, in critically ill patients with normal renal function, in concordance with the dosage of the present study (www.ema.europa.eu/docs/en_GB/document_library/Press_release/2014/10/WC500176334.pdf).
In conclusion, a loading dose of 9 MU CMS was applied in 19 critically ill patients, and this is the first study to demonstrate colistin concentrations above the MIC breakpoints after the initiation of treatment. The implementation of a loading dose of 9 MU CMS in serious Gram-negative infections in the ICU possesses a high probability of achieving steady-state colistin concentrations rapidly that would be expected to be reliably efficacious in order to accomplish fast clinical improvement. A new structural model for CMS and its derivatives was successfully developed based on the current data with a loading dose of 9 MU and two earlier data sets with lower initial doses (3 and 6 MU) (6, 7). The present modeling structure also allowed for the estimation of a significant increase in the availability of the A plus B forms of CMS and colistin in the new study. CLCR was a time-varying covariate for the clearance of CMS and CMS derivatives. Finally, based on our findings and previous publications (8), patients with a CLCR above 80 ml/min/1.73 m3 probably would benefit from an even higher maintenance dose in order to achieve a colistin concentration above 2 mg/liter at steady state.
REFERENCES
- 1.Karaiskos I, Giamarellou H. 2014. Multidrug-resistant and extensively drug-resistant Gram-negative pathogens: current and emerging therapeutic approaches. Expert Opin Pharmacother 15:1351–1370. doi: 10.1517/14656566.2014.914172. [DOI] [PMC free article] [PubMed] [Google Scholar]
- 2.World Health Organization (WHO). 2011. Antimicrobial resistance: no action today, no cure tomorrow. WHO Press, Geneva, Switzerland: http://www.who.int/world-health-day/2011/en/index.html. [Google Scholar]
- 3.Boucher HW, Talbot GH, Bradley JS. 2009. Bad bugs, no drugs: no ESKAPE! An update from the Infectious Diseases Society of America. Clin Infect Dis 48:1–12. doi: 10.1086/595011. [DOI] [PubMed] [Google Scholar]
- 4.Bergen PJ, Li J, Rayner CR, Nation RL. 2006. Colistin methanesulfonate is an inactive prodrug of colistin against Pseudomonas aeruginosa. Antimicrob Agents Chemother 50:1953–1958. doi: 10.1128/AAC.00035-06. [DOI] [PMC free article] [PubMed] [Google Scholar]
- 5.Jansson B, Karvanen M, Cars O, Plachouras D, Friberg LE. 2009. Quantitative analysis of colistin A and colistin B in plasma and culture medium using a simple precipitation step followed by LC/MS/MS. J Pharm Biomed Anal 49:760–767. doi: 10.1016/j.jpba.2008.12.016. [DOI] [PubMed] [Google Scholar]
- 6.Plachouras D, Karvanen M, Friberg LE, Papadomichelakis E, Antoniadou A, Tsangaris I, Karaiskos I, Poulakou G, Kontopidou F, Armaganidis A, Cars O, Giamarellou H. 2009. Population pharmacokinetic analysis of colistin methanesulfonate and colistin after intravenous administration in critically ill patients with infections caused by Gram-negative bacteria. Antimicrob Agents Chemother 53:3430–3436. doi: 10.1128/AAC.01361-08. [DOI] [PMC free article] [PubMed] [Google Scholar]
- 7.Mohamed AF, Karaiskos I, Plachouras D, Karvanen M, Pontikis K, Jansson B, Papadomichelakis E, Antoniadou A, Giamarellou H, Armaganidis A, Cars O, Friberg LE. 2012. Application of a loading dose of colistin methanesulfonate in critically ill patients: population pharmacokinetics, protein binding, and prediction of bacterial kill. Antimicrob Agents Chemother 56:4241–4249. doi: 10.1128/AAC.06426-11. [DOI] [PMC free article] [PubMed] [Google Scholar]
- 8.Garonzik SM, Li J, Thamlikitkul V, Paterson DL, Shoham S, Jacob J, Silveira FP, Forrest A, Nation RL. 2011. Population pharmacokinetics of colistin methanesulfonate and formed colistin in critically ill patients from a multicenter study provide dosing suggestions for various categories of patients. Antimicrob Agents Chemother 55:3284–3294. doi: 10.1128/AAC.01733-10. [DOI] [PMC free article] [PubMed] [Google Scholar]
- 9.Clinical and Laboratory Standards Institute. 2013. Performance standards for antimicrobial susceptibility testing; 23rd informational supplement, M100-S23. CLSI, Wayne, PA. [Google Scholar]
- 10.Cockcroft DW, Gault MH. 1976. Prediction of creatinine clearance from serum creatinine. Nephron 16:31–41. doi: 10.1159/000180580. [DOI] [PubMed] [Google Scholar]
- 11.Bellomo R, Ronco C, Kellum JA, Mehta RL, Palevsky P, Acute Dialysis Quality Initiative Workgroup. 2004. Acute renal failure—definition, outcome measures, animal models, fluid therapy and information technology needs: the Second International Consensus Conference of the Acute Dialysis Quality Initiative (ADQI) Group. Crit Care 8:R204–R212. doi: 10.1186/cc2872. [DOI] [PMC free article] [PubMed] [Google Scholar]
- 12.Li J, Milne RW, Nation RL, Turnidge JD, Coulthard K, Valentine J. 2002. Simple method for assaying colistin methanesulfonate in plasma and urine using high-performance liquid chromatography. Antimicrob Agents Chemother 46:3304–3307. doi: 10.1128/AAC.46.10.3304-3307.2002. [DOI] [PMC free article] [PubMed] [Google Scholar]
- 13.Beal SL. 2001. Ways to fit a PK model with some data below the quantification limit. J Pharmacokinet Pharmacodyn 28:481–504. doi: 10.1023/A:1012299115260. [DOI] [PubMed] [Google Scholar]
- 14.Keizer RJ, Karlsson MO, Hooker A. 2013. Modeling and simulation workbench for NONMEM: tutorial on Pirana, PsN, and Xpose. CPT Pharmacometrics Syst Pharmacol 2:e50. doi: 10.1038/psp.2013.24. [DOI] [PMC free article] [PubMed] [Google Scholar]
- 15.Ito K, Murphy D. 2013. Application of ggplot2 to pharmacometric graphics. CPT Pharmacometrics Syst Pharmacol 2:e79. doi: 10.1038/psp.2013.56. [DOI] [PMC free article] [PubMed] [Google Scholar]
- 16.Kumar A, Roberts D, Wood KE, Light B, Parrillo JE, Sharma S, Suppes R, Feinstein D, Zanotti S, Taiberg L, Gurka D, Kumar A, Cheang M. 2006. Duration of hypotension before initiation of effective antimicrobial therapy is the critical determinant of survival in human septic shock. Crit Care Med 34:1589–1596. doi: 10.1097/01.CCM.0000217961.75225.E9. [DOI] [PubMed] [Google Scholar]
- 17.Kumar A. 2014. An alternate pathophysiologic paradigm of sepsis and septic shock: implications for optimizing antimicrobial therapy. Virulence 5:80–97. doi: 10.4161/viru.26913. [DOI] [PMC free article] [PubMed] [Google Scholar]
- 18.Grégoire N, Mimoz O, Mégarbane B, Comets E, Chatelier D, Lasocki S, Gauzit R, Balayn D, Gobin P, Marchand S, Couet W. 2014. New colistin population pharmacokinetic data in critically ill patients suggesting an alternative loading dose rationale. Antimicrob Agents Chemother 58:7324–7330. doi: 10.1128/AAC.03508-14. [DOI] [PMC free article] [PubMed] [Google Scholar]
- 19.He H, Li JC, Nation RL, Jacob J, Chen G, Lee HJ, Tsuji BT, Thompson PE, Roberts K, Velkov T, Li J. 2013. Pharmacokinetics of four different brands of colistimethate and formed colistin in rats. J Antimicrob Chemother 68:2311–2317. doi: 10.1093/jac/dkt207. [DOI] [PMC free article] [PubMed] [Google Scholar]
- 20.Nation RL, Velkov T, Li J. 2014. Colistin and polymyxin B: peas in a pod, or chalk and cheese? Clin Infect Dis 59:88–94. doi: 10.1093/cid/ciu213. [DOI] [PMC free article] [PubMed] [Google Scholar]
- 21.Couet W, Grégoire N, Gobin P, Saulnier PJ, Frasca D, Marchand S, Mimoz O. 2011. Pharmacokinetics of colistin and colistimethate sodium after a single 80-mg intravenous dose of CMS in young healthy volunteers. Clin Pharmacol Ther 89:875–879. doi: 10.1038/clpt.2011.48. [DOI] [PubMed] [Google Scholar]
- 22.Roberts JA, Lipman J. 2009. Pharmacokinetic issues for antibiotics in the critically ill patient. Crit Care Med 37:840–851. doi: 10.1097/CCM.0b013e3181961bff. [DOI] [PubMed] [Google Scholar]
- 23.Nation RL, Li J, Turnidge JD. 2013. The urgent need for clear and accurate information on the polymyxins. Clin Infect Dis 57:1656–1657. doi: 10.1093/cid/cit522. [DOI] [PubMed] [Google Scholar]
- 24.Theuretzbacher U. 2014. Product information for parenteral colistin varies substantially across Europe. J Antimicrob Chemother 69:1987–1992. doi: 10.1093/jac/dku064. [DOI] [PubMed] [Google Scholar]
- 25.Pogue JM, Lee J, Marchaim D, Yee V, Zhao JJ, Chopra T, Lephart P, Kaye KS. 2011. Incidence of and risk factors for colistin-associated nephrotoxicity in a large academic health system. Clin Infect Dis 53:879–884. doi: 10.1093/cid/cir611. [DOI] [PubMed] [Google Scholar]
- 26.Akajagbor DS, Wilson SL, Shere-Wolfe KD, Dakum P, Charurat ME, Gilliam BL. 2013. Higher incidence of acute kidney injury with intravenous colistimethate sodium compared with polymyxin B in critically ill patients at a tertiary care medical center. Clin Infect Dis 57:1300–1303. doi: 10.1093/cid/cit453. [DOI] [PubMed] [Google Scholar]
- 27.Justo JA, Bosso JA. 2015. Adverse reactions associated with systemic polymyxin therapy. Pharmacotherapy 35:28–33. doi: 10.1002/phar.1493. [DOI] [PubMed] [Google Scholar]
- 28.Dalfino L, Puntillo F, Mosca A, Monno R, Spada ML, Coppolecchia S, Miragliotta G, Bruno F, Brienza N. 2012. High-dose, extended-interval colistin administration in critically ill patients: is this the right dosing strategy? A preliminary study. Clin Infect Dis 54:1720–1726. doi: 10.1093/cid/cis286. [DOI] [PMC free article] [PubMed] [Google Scholar]