

Summary
Epigenetic regulation serves as the basis for stem cell differentiation into distinct cell types, but it is unclear how global epigenetic changes are regulated during this process. Here, we tested the hypothesis that global chromatin organization affects the lineage potential of stem cells and that manipulation of chromatin dynamics influences stem cell function. Using nuclease sensitivity assays, we found a progressive decrease in chromatin digestion among pluripotent embryonic stem cells (ESCs), multipotent hematopoietic stem cells (HSCs), and mature hematopoietic cells. Quantitative high-resolution microscopy revealed that ESCs contain significantly more euchromatin than HSCs, with a further reduction in mature cells. Increased cellular maturation also led to heterochromatin localization to the nuclear periphery. Functionally, prevention of heterochromatin formation by inhibition of the histone methyltransferase G9A resulted in delayed HSC differentiation. Our results demonstrate global chromatin rearrangements during stem cell differentiation and that heterochromatin formation by H3K9 methylation regulates HSC differentiation.
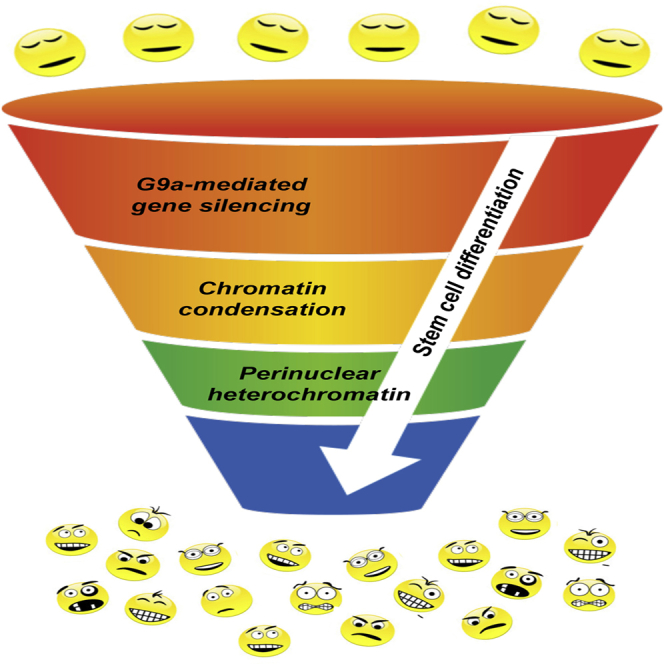
Graphical Abstract
Highlights
-
•
Nuclease sensitivity decreases progressively with stem cell differentiation
-
•
Distinct chromatin architecture is apparent in cells of different lineage potential
-
•
Stem cell differentiation leads to perinuclear heterochromatin localization
-
•
G9a-mediated heterochromatin formation facilitates stem cell differentiation
Forsberg and colleagues use a variety of approaches to investigate global chromatin structure and architecture in pluripotent, multipotent, and differentiated cells. They show that progressive changes in nuclease sensitivity, chromatin condensation, and heterochromatin localization correlate with the lineage potential of embryonic and adult stem cells and committed cells. Functionally, inhibition of heterochromatin formation delayed hematopoietic stem cell differentiation. These data provide new insights on the epigenetic regulation of stem cell lineage potential and differentiation.
Introduction
Epigenetic mechanisms play a major role in maintaining stem cell identity as well as in regulating stem cell fate decisions. Intense desire to predict and control cell differentiation and dedifferentiation has rapidly led to deeper insights into the epigenetic regulation of stem cell function. Many of these recent insights have been obtained from embryonic stem cells (ESCs) because the ability to expand and differentiate these cells ex vivo provides access to large numbers of cells at various stages of differentiation. ESCs have been reported to contain a relatively open chromatin conformation with hyperdynamic binding of chromatin proteins (Meshorer et al., 2006), accompanied by bivalent histone modifications (Azuara et al., 2006, Bernstein et al., 2006) and transcriptional hyperactivity compared to differentiated cells (Efroni et al., 2008). Immature cells also harbor a higher proportion of DNaseI hypersensitive sites, and their loss or relocation upon differentiation suggests major remodeling of the epigenetic landscape (Stergachis et al., 2013). Furthermore, chromatin remodeling proteins such as CHD1 and esBAF appear essential for the open chromatin state in ESCs and preservation of self-renewal capacity and pluripotency (Gaspar-Maia et al., 2009, Ho et al., 2009). These observations suggest that chromatin conformation is very dynamic in ESCs, with dramatic changes occurring upon differentiation.
Progress has also been made in mapping the epigenomes of adult stem cells, including DNA methylation and histone modifications of hematopoietic stem cells (HSCs) and their progeny. However, while the hierarchy and lineage potential of hematopoietic cell populations is well characterized (Boyer et al., 2011, Boyer et al., 2012, Forsberg et al., 2006), much less is known about the epigenetic mechanisms governing hematopoietic fate decisions. There are huge gaps in our understanding of the characteristics of chromatin structure in HSCs, how it compares to ESCs, and how it is remodeled upon differentiation. We also don’t understand the functional consequences of large-scale chromatin remodeling, which are the master regulators of chromatin architecture, or how these regulators control lineage potential.
Here, we tested the hypothesis that stem cells undergo significant changes in global chromatin conformation upon differentiation and that lineage potential is a direct consequence of the global chromatin composition and distribution. Our study demonstrates that global chromatin architecture is distinctly different among cells of diverse lineage potential and that proper transition from euchromatin to heterochromatin is required for efficient stem cell differentiation.
Results
Nuclease Sensitivity Progressively Decreases upon Stem Cell Differentiation
To test whether there are substantial differences in chromatin condensation in cells with different lineage potential, we measured the relative DNaseI sensitivity of mouse ESCs and of primary hematopoietic stem and progenitor cells (HSPCs; defined as c-kit+Lin−Sca1+ [KLS] bone marrow [BM] cells) and mature hematopoietic cells isolated by fluorescence-activated cell sorting (FACS) from mouse BM. Cell populations were subjected to DNaseI digestion, and the size of the fragmented DNA was analyzed by gel electrophoresis to assess the relative degree of chromatin condensation (Sabo et al., 2006). Strikingly, we found that ESCs displayed the highest degree of DNaseI sensitivity, followed by HSPCs, and then mature cells (Figure 1A). Interestingly, further separation of BM cells into an HSC-enriched fraction (Flk2− KLS cells) and myeloid progenitors (granulocyte/macrophage progenitors [GMPs] and megakaryocyte/erythrocyte progenitors [MEPs]) did not result in significantly different DNaseI digestion, although there was a trend toward higher sensitivity for myeloid progenitors over HSCs (Figure 1A). HSCs that had been induced to cycle in vivo by injecting mice with cytoxan/G-CSF prior to HSC isolation (Morrison et al., 1997, Smith-Berdan et al., 2011) did not display significantly different DNaseI sensitivity compared to steady-state quiescent HSCs (Figure S1A). Thus, cell-cycle status did not directly correlate with the nuclease sensitivity.
Figure 1.

Progressive Decrease in Nuclease Sensitivity upon Stem Cell Differentiation
(A) Multipotent HSPCs display greater sensitivity to DNaseI digestion than mature hematopoietic cells but lower sensitivity compared to pluripotent ESCs. Each cell population was incubated with increasing concentrations of DNaseI, followed by DNA separation by gel electrophoresis (left panels). No significant differences were detected between HSCs and GMPs/MEPs. DNaseI sensitivity was quantified (middle and right panels) as the amount of digested DNA at equal concentrations of DNaseI (yellow rectangles in left panel). n = 6 independent experiments. Statistics by one-way ANOVA.
(B) MNase sensitivity assays revealed higher ESC sensitivity to MNase digestion, but no differences between HSPCs and mature hematopoietic cells, indicating that nucleosome linker regions are differentially organized in ESCs compared to multipotent and mature hematopoietic cells. n = 3 independent experiments. Statistics by one-way ANOVA.
(C and D) The global abundance of histone modifications does not change significantly among ESCs, HSPCs, and mature cells. Each modification was measured using semiquantitative immunoblot analysis (C) or nucleosome ELISA (D). n = 8 and statistics by two-way ANOVA (C), and n = 3–4 and statistics by t test (D).
Data are means ± SEM; ∗p < 0.05, ∗∗p < 0.01, and ∗∗∗p < 0.001; ns, not significant; N.D., not determined. See also Figure S1.
To determine whether the differential nuclease sensitivity is manifested in chromatin linker regions, we performed analogous experiments with micrococcal nuclease (MNase), an enzyme that induces double-strand breaks specifically in nucleosome linker regions. We found that ESCs displayed significantly higher sensitivity to MNase digestion compared to HSPCs (Figure 1B), possibly because of their differential expression of linker histone variants (Terme et al., 2011). In contrast, we found no significant differences in MNase sensitivity between HSPCs and mature hematopoietic cells (Figure 1B). This suggests that the higher DNaseI sensitivity of HSPCs relative to mature cells is manifested in core histone regions, without significant differences in linker histone conformation. Overall, these results show that nuclease sensitivity correlates with lineage potential and that there is a progressive global condensation of chromatin among pluripotent ESCs, multipotent HSPCs, and fully differentiated blood cells.
Global Levels of Epigenetic Modifications Do Not Change upon Stem Cell Differentiation
We hypothesized that the observed differences in chromatin condensation among ESCs, HSPCs, and mature cells could be due to global differences in either DNA methylation or histone modifications. However, despite recent demonstrations of the importance of DNA methylation for HSC function (Bröske et al., 2009, Challen et al., 2011, Trowbridge et al., 2009), we did not detect significant differences in DNA digestion between HSPCs and mature cells using the restriction enzymes MspI and HpaII (Figure S1B) (Bernardino et al., 1997). Using immunoblotting, we also found no significant differences in the overall levels of any of the histone marks investigated (H3K4me3, H3Ac, H4K16Ac, H4K20me1, and H3K36me3 that are usually associated with active transcription, or H3K27me3, H3K9me2, and H3K9me3 that usually act as repressive marks) among ESCs, HSPCs, and fully mature cells (Figure 1C). Further separation of hematopoietic cells into more distinct populations also failed to reveal significant differences in the frequency of histone marks (Figure S1C). To test the sensitivity of the assay, we treated cells with the histone deacetylase inhibitor trichostatin A (TSA). This led to a significant increase in the global levels of histone acetylation (Figure S1C), showing that the immunoblotting assay was capable of detecting differences in histone modification. To test whether ELISAs would enable greater sensitivity and detection of differential levels of modifications, we established a quantitative nucleosome ELISA (NU-ELISA; Figure S1D) (Dai et al., 2013). Quantification of histone modifications of acid-extracted nucleosomes did not reveal statistically significant differences between ESCs and mature cells (Figure 1D), despite a measurable increase in H3Ac upon TSA treatment (Figure S1E). qRT-PCR also showed that the overall expression levels of histone H1 were comparable between ESCs and mature cells, whereas both the mRNA and protein levels of the nucleosome binding protein HMGN1 were significantly lower in mature cells (Figures S1F and S1G). Taken together, these results suggest that the globally more open chromatin conformation in ESCs and HSPCs is not due to substantial differences in overall levels of DNA methylation or individual histone modifications. Our data are consistent with recent studies showing that HSC differentiation is accompanied by changes in DNA methylation at specific genomic loci without significant changes in overall levels (Ji et al., 2010) and by quantitative mass spectrometry detecting only moderate global differences in the levels of histone modifications between mature cells (MEFs) and pluripotent stem cells (Sridharan et al., 2013).
The Chromatin Architecture of Stem Cells Is Modified upon Differentiation
Previous studies have shown that ESC differentiation or perturbation of chromatin remodeling proteins can lead to significant changes in heterochromatin abundance and distribution in ESCs (Gaspar-Maia et al., 2009, Meshorer et al., 2006). To test whether differences also exist between unmanipulated ESCs and freshly isolated HSCs and their progeny, we analyzed their chromatin conformation using high-resolution electron microscopy (EM) and soft X-ray tomography (SXT) (Parkinson et al., 2013). Strikingly, EM revealed a very high content of euchromatin in ESCs (79% of nuclear area; Figure 2A, images in left column, and Figure 2B, top). A significant decrease in the amount of euchromatin was observed in HSCs, multipotent progenitors (MPPs), and GMPs (55%, 53%, and 57%, respectively) (Figure 2B, middle panel). Mature myeloid cells and B cells displayed a further significant reduction in euchromatin area (34% and 37%, respectively).
Figure 2.

Alterations in Nuclear Architecture and Chromatin Conformation upon Stem Cell Differentiation
(A) High-resolution imaging of ESCs, HSCs, MPPs, GMPs, B cells, and GM cells by electron microscopy (left column) and soft X-ray tomography (middle and right columns) displays the organization of hetero- (dark or blue nuclear regions) and euchromatin (light or green nuclear regions) in a single plane (left and middle) as well as in a 3D reconstruction (right).
(B) Quantification of the ratios of heterochromatin and euchromatin area by EM and volume by SXT revealed significant reductions in the proportion of euchromatin upon stem cell differentiation. The top image depicts examples of EM-based quantification of densely appearing heterochromatin, illustrating the stark differences between heterochromatin staining between ESCs and B cells. (EM, n = 30 cells; SXT, n = 8 cells; per cell type in three or more experiments.)
(C) Positive correlation of the amount of euchromatin and nuclear size by EM (top) and SXT (bottom) analyses. (EM, n = 30 cells; SXT, n = 8 cells; per cell type in three or more experiments.)
(D) Theoretical model of a cell nucleus as a perfect sphere and the interphase between hetero- and euchromatin as a perfect disk.
(E) Quantification of the total area of the euchromatin/heterochromatin interface by SXT revealed that stem and progenitor cells have significantly larger euchromatin/heterochromatin interaction areas than lineage-committed cells. All cell types deviate from the theoretical interphase of a perfect disk, designated as 1. (EM, n = 30 cells; SXT, n = 8 cells; per cell type in three or more experiments.)
(F) ESCs and mature GM cells have the highest degree of nuclear folding, quantified as nuclear sphericity, while HSPCs and B cells are the closest to a theoretical perfect sphere (= 1). (EM, n = 30 cells; SXT, n = 8 cells; per cell type in three or more experiments.)
Data are means ± SEM; ∗p < 0.05, ∗∗p < 0.01, and ∗∗∗p < 0.001; ns, not significant. Statistics by one-way ANOVA. Scale bars represent 4 uM for EM images in (A); all other scale bars are 2 uM. See also Figure S2 and Movies S1, S2, and S3.
Next, imaging by SXT and 3D reconstruction of complete cells allowed us to analyze the entire chromatin content of cells, quantifying the total volumes of hetero- versus euchromatin and their spatial distribution throughout the cell nuclei (McDermott et al., 2009, Parkinson et al., 2013). Notably, SXT imaging is performed on the entire cell in its natural hydrated conformation, therefore avoiding potential artifacts in chromatin conformation induced by cell fixation and single-plane analysis. Strikingly similar to the EM results, SXT images as single orthoslices revealed a reduction in the amount of euchromatin among pluripotent ESCs, multipotent stem and progenitor cells, and lineage-restricted mature cells (Figure 2A, images in middle column). Quantification of the volumes of each type of chromatin as a fraction of the nuclear volume demonstrated the highest percentage of euchromatin in ESCs (72.6%), followed by MPPs (52.8%), GMPs (53.7%), HSCs (40.9%), B cells (37.2%), and granulocyte/monocyte (GM) cells (29.4%) (Figure 2A, images in right column; Figure 2B, bottom panel; Movies S1, S2, and S3). Surprisingly, we found that the heterochromatin amount remained unaltered among the different cell types when measured as either total absolute area by EM or as volume by SXT (Figure S1A). Instead, the euchromatin content significantly decreased upon differentiation, condensing into highly packed heterochromatin. Independent analyses by both EM and SXT images demonstrated a positive correlation between nuclear size and the amount of euchromatin, suggesting that nuclear size may be determined predominantly by the prevalence of euchromatin rather than heterochromatin content (Figure 2C). Overall, our results demonstrate that chromatin composition changes with restriction of lineage potential from a highly open and euchromatinized state to an increasingly condensed and silenced heterochromatin conformation.
We next analyzed the spatial distribution of chromatin in cell types of varying lineage potential. To measure the total surface area of hetero- and euchromatin and the extent of hetero- or euchromatin interface, we constructed a 3D hypothetical model where: (1) cell nuclei are perfect spheres, (2) the nuclei are divided in two equal parts of hetero- and euchromatin, and (3) the interface between them is a regular disk (Figure 2D). Using the SXT images, we found that the interface between the two chromatin fractions was significantly different from that expected for a circular disk (value = 1) for all cell types. The observed interface for ESCs, HSCs, MPPs, and GMPs was approximately 10-fold higher than the model and significantly higher than for mature GM and B cells (Figure 2E). We also found that the nuclear shape of HSCs, MPPs, GMPs, and B cells deviated only slightly from a perfect sphere, whereas ESCs displayed a high degree of nuclear folding (Figure 2F). Extensive nuclear folding was also evident in GM cells, in agreement with their characteristic morphology (Figure 2A, bottom images). The high nuclear folding of ESCs and extensive chromatin interface in stem and progenitor cells compared to mature cells may reflect a more dynamic chromatin structure indicative of greater lineage potential.
Heterochromatin Is Redistributed to the Nuclear Periphery upon Stem Cell Differentiation
We next tested whether the subcellular distribution of H3K9me3, a heterochromatin-associated mark, is differentially distributed in the nucleus of cells with different lineage potential. ESCs or purified hematopoietic subpopulations were incubated with DAPI to label nuclei, anti-lamin antibodies to label the nuclear envelope, and anti-H3K9me3 antibodies to label heterochromatin and then analyzed by confocal microscopy. H3K9me3 accumulated in well-defined foci scattered throughout the nucleus of ESCs, consistent with previous studies (Gaspar-Maia et al., 2009). In HSCs and MPPs, H3K9me3 was preferentially localized at the nuclear periphery, overlapping with the nuclear envelope mark LaminB, with much fewer foci in the center of the nuclei (Figure 3A). Three-dimensional analysis of confocal images revealed large numbers of foci of various sizes located near the nuclear envelope, demonstrating that heterochromatin foci are present but peripherally distributed in HSPCs (Movie S2). Mature cells demonstrated an even more distinct pericentric distribution of H3K9me3. Interestingly, GMPs had relatively dispersed H3K9me3 foci throughout the nucleus, similar to ESCs (Figure 3A). These visual observations were substantiated by radial distribution analysis (Figure 3B), with quantification demonstrating that H3K9me3 in HSCs, MPPs, GM, B cells, and T cells was mainly contained within the 20% of the nuclear area closest to the nuclear envelope, whereas a significantly smaller fraction of the total H3K9me3 in ESCs and GMPs was localized to the periphery (Figure 3C). To assess heterochromatin localization by an independent method, we also quantified the distribution of heterochromatin relative to the nuclear envelope using SXT. As in the immunohistochemistry (IHC) analyses of H3K9me3-marked heterochromatin, SXT revealed that ESCs had the lowest amount of heterochromatin located near (within 0.5 μm) the nuclear envelope, followed by GMPs, then HSCs and MPPs, and finally by mature cells (Figure 3D). Overall, these results show that despite having similar global levels of H3K9me3 (Figures 1C and 1D), the spatial distribution of this mark differs significantly among different cell types. The progressive localization of H3K9me3 to the nuclear periphery upon cell differentiation generally followed the patterns observed by nuclease sensitivity (Figure 1) and euchromatin content (Figure 2), except that GMPs deviate from the “expected” distribution of pericentric heterochromatin.
Figure 3.

Subnuclear Distribution of Heterochromatin Is Altered upon Stem Cell Differentiation
(A) Immunohistochemistry for H3K9me3 revealed differential heterochromatin distribution in the nuclei of different cell types, gradually shifting from a dispersed distribution in ESCs to a tight, pericentric distribution in mature cells. Lamin B was used to mark the nuclear envelope.
(B) Average radial distribution of H3K9me3 (red line) across the width of the nucleus (indicated with a yellow box, top) superimposed on DAPI stain (blue histogram) in the cell types displayed in (A). GMPs showed a less defined pattern, with significant foci in the center of the nucleus, similar to ESCs. The distinct shape of the nuclear membrane of mature GM cells (bottom row in A) precluded comparative quantification. n = 12 cells per cell type in three independent experiments.
(C) Quantification of the H3K9me3 distribution across the center (inner 60%) and periphery (outer 20% of each edge) of the nuclei of different cell types demonstrated a progressive shift in H3K9me3 localization from the nuclear center to the periphery during stem cell differentiation. As in (A) and (B), GMPs represent an exception to this pattern.
(D) Analysis of the fraction of heterochromatin, measured by SXT as heterochromatin volume, at increasing distance from the nuclear envelope shows the accumulation of heterochromatin at the nuclear periphery in more differentiated cells. Mature GM and B cells (yellow and green lines) have a thicker ring of heterochromatin close to the nuclear envelope, whereas ESCs (black line) have a very thin ring of heterochromatin near the nuclear envelope.
Data are means ± SEM; ∗p < 0.05, ∗∗p < 0.01, and ∗∗∗p < 0.001; ns, not significant. Statistics by one-way ANOVA. Scale bars, 2 um. See also Figure S3.
H3K9 Methylation by G9A Is Essential for Efficient HSC Differentiation
To search for molecular regulators mediating the condensation of euchromatin during lineage commitment, we tested whether inhibitors of chromatin-modifying enzymes affected HSC differentiation in vitro. Purified HSCs were grown in liquid culture with and without inhibitors. By dose titration for cell viability and analysis of HSC differentiation in response to several different inhibitors, we found that inhibition of the histone methyltransferase G9A (EHMT2), an enzyme mediating mono- and di-methylation of H3K9 in euchromatin domains and promoting heterochromatin formation (Barski et al., 2007, Shinkai and Tachibana, 2011), using the small-molecule inhibitor UNC0638 (Vedadi et al., 2011) led to significant accumulation of HSPCs (Figures 4 and 5A). Accumulation of HSPCs upon G9A inhibition occurred in both liquid culture and co-culture of HSCs with AFT024 stromal cells (Moore et al., 1997) (Figures 4 and 5A and data not shown). Dose titration showed that total cell numbers started to decline beyond UNC0638 concentrations of 1 uM. Interestingly, total HSPC numbers, not only their frequency, increased throughout this concentration range (Figure 4). This suggested that G9A inhibition may increase self-renewing divisions of HSPCs in culture. Indeed, ethynyl deoxyuridine (EdU) incorporation experiments revealed that a significantly higher percentage of HSPCs were in S phase upon UNC0638 treatment compared to the DMSO control (56% and 44%, respectively), and fewer cells were in the G0/G1 phase (38% and 50%) (Figure 5B). In contrast, the myeloid progenitor population displayed no significant shift in cell-cycle status upon UNC0638 treatment (Figure 5B). These data suggest that UNC0638 promotes proliferation of HSPCs and that they accumulate due to lack of differentiation.
Figure 4.

G9A Inhibition Uniquely Leads to Hematopoietic Progenitor Accumulation In Vitro
Numbers of live cells and KLS cells after 5 days of in vitro liquid culture of mouse HSCs (isolated as KLS Flk2-CD150+ BM cells) with the G9A inhibitor UNC0638 at varying concentrations. The number of KLS cells significantly increased at 0.1–1 uM of UNC0638 in comparison to the DMSO-treated controls. The number of total live cells started to significantly decline at 1 uM of UNC0638. Data shown are calculated from n = 4 wells in two independent experiments with HSCs grown in liquid culture. Similar results were obtained when HSCs were grown on AFT024 stromal cells (data not shown). On the basis of these data, we used UNC0638 at 0.3 uM for subsequent experiments.
Statistical analyses for cell viability (open bars) and KLS cell accumulation (black bars) relative to the vehicle control conditions were determined using two-way ANOVA of three or more independent experiments. ∗p ≤ 0.05, ∗∗p ≤ 0.01, and ∗∗∗p ≤ 0.001.
Figure 5.

G9A Inhibition Impairs HSC Differentiation In Vitro
(A) G9A inhibition via the inhibitor UNC0638 led to a significant increase in the frequency (flow cytometry plots; 66.8% versus 21.9%) and number (right bar graph) of KLS cells compared to the DMSO control. HSCs (isolated as KLS Flk2−CD150+ BM cells) were cultured for 5 days in vitro with or without UNC0638. n = 3 independent experiments.
(B) Cell-cycle analysis using EdU incorporation combined with Hoechst staining revealed that a higher percentage of UNC0638-treated KLS cells were in S phase compared to the DMSO-treated controls (56% versus 44%), demonstrating increased proliferation in UNC0638-treated cells. Myeloid progenitor cells harvested from the same wells displayed no differences in cell-cycle status. n = 3 independent experiments.
(C) Hematopoietic reconstitution was not improved by UNC0638 treatment of HSCs. Purified HSCs were cultured in the presence or absence of UNC0638 as in (A). After 24 hr of culture, KLS cells were sorted from each condition, and equal numbers (500 per mouse) were transplanted into lethally irradiated recipients. Erythrocytes, platelets, GM, B cells, and T cells were detected from both conditions, with no significant differences in reconstitution levels or lineage distribution. Line graphs display the peripheral blood reconstitution of each lineage over time for one out of three independent experiments, each performed with at least three recipient mice. Bar graphs display the short-term (left graph; measured at 2–6 weeks post-transplantation depending on cell type) or long-term (right graph; measured > 14 weeks post-transplantation for all cell types) reconstitution for each lineage for all three experiments. n = 3 independent experiments with 8–10 recipient mice per group. p values were determined using two-way ANOVA. No significant differences were observed.
(D) Gene expression analysis by RNA-seq (left) revealed a significant number of upregulated HSC-related genes in UNC0638-treated cells compared to control cells grown without inhibitor (DESEQ padj < 0.01). The differential expression of a subset of these genes was verified by qRT-PCR (middle panel). The overlap (138 genes) of genes upregulated upon UNC0638 treatment of HSCs (650 genes) that also have higher expression in freshly isolated HSCs compared to MPPs (635 genes) is highly significant (right panel), indicating that UNC0638 promotes a more HSC-like expression. The intersect of differentially regulated genes was assessed by php coding, and the p value calculated by hypergeometric test (http://nemates.org/MA/progs/overlap_stats.html). n = 3 independent experiments.
(E) ChIP-qPCR demonstrated significantly reduced levels of H3K9me2 on promoters of putative G9A targets based on RNA-seq. A trend toward H3K9me3 reduction was also observed, but no differences were found for the active mark H3K4me3. n = 3 independent experiments.
(F) Gene set enrichment analysis (GSEA) of RNA-seq data from (D) revealed that G-protein-coupled receptors is the most significantly differentially expressed gene category between control and UNC0638-treated HSCs.
(G) Transwell migration assay demonstrated an impaired capacity of UNC0638 KLS cells to migrate toward the chemokine SDF1. n = 3 independent experiments.
Data are means ± SEM; ∗p < 0.05, ∗∗p < 0.01, and ∗∗∗p < 0.001; ns, not significant. Statistical analysis by two-tailed t test. See also Figures S4 and S5.
Next, to test the functionality of these expanded HSPCs, we transplanted them into lethally irradiated recipients. Despite the significant increase in KLS cells, transplantation of cells from wells seeded with HSCs and grown in liquid cultured for 24 hr in the presence of UNC0638 resulted in only a minor increase in reconstitution compared to control cells (Figure 5C). Additional experiments that varied the length of UNC0638 exposure, the number of transplanted cells, the conditioning of the recipient mice, and whether cells were grown in liquid culture or on AFT024 cells, while leading to significant increases in KLS cells, also failed to significantly increase the reconstitution levels of transplant recipients (Figures 5C, S4A, and S4B and data not shown). Growth in liquid culture for 24 hr or on AFT024 cells for up to 5 days resulted in long-term engraftment (Figure 5C), whereas liquid culturing for longer time periods led to only short-term hematopoietic reconstitution (Figure S4B). The loss of engraftment potential over time in culture equally affected untreated and UNC0638-treated cells, indicating that G9A inhibition was not sufficient to maintain engraftable HSCs for prolonged periods in culture. All conditions led to multilineage readout, with production of red blood cells, platelets, and nucleated myeloid, B cells, and T cells at similar ratios between control and UNC0638-treated cells. Thus, G9A inhibition maintained KLS cells without affecting lineage output but was insufficient to expand HSCs with strong long-term engraftment capability.
To test the molecular mechanisms behind UNC0638-mediated accumulation of HSPCs, we compared the global gene expression of the KLS fraction after 5 days of in vitro culture with and without UNC0638. We found a significant number of upregulated genes in UNC0638-treated cells previously associated with HSC function, such as Sox6, Itga2b, Gata1, and Fgf3 (Figures 5D, S5A, and S5B) (Gekas and Graf, 2013). Many of the genes upregulated with UNC0638 treatment also have significantly higher expression in freshly isolated HSCs compared to MPPs, suggesting that UNC0638 treatment delayed the silencing of genes necessary for HSC differentiation (Figures 5D, S5A, and S5B). We also identified significant downregulation of genes involved in the regulation of HSC proliferation, such as Egr1 (Min et al., 2008) and Ndn (Asai et al., 2012), and HSC engraftment, such as Robo4 (Smith-Berdan et al., 2011). Thus, UNC0638 led to maintenance of a large number of HSC-selective genes, whereas HSCs grown in the absence of UNC0638 had a gene expression profile more similar to MPPs, consistent with G9A inhibition leading to delayed differentiation of HSCs into increasingly mature progeny. Using chromatin immunoprecipitation (ChIP) PCR, we found that several upregulated genes identified by RNA sequencing (RNA-seq) have significantly lower amount of H3K9me2 at their promoter (Figure 5E). The reduced levels of H3K9me2 at the promoter of these genes suggest that they are directly regulated by G9A and that G9A promotes their silencing upon HSC differentiation. The same promoters also tended to have lower levels of H3K9me3, but no changes in H3K4me3, indicating that an increase in the activating H3K4me3 modification is not necessary for increased gene expression. On the other hand, downregulated genes had no significant changes in H3K9me2 levels at their promoters, suggesting that their downregulation is an indirect effect of G9A inhibition (Figure S5C). Collectively, these data suggest that the accumulation of KLS cells in response to G9A inhibition reflects a delay in HSC differentiation due to impaired silencing of some, but not all, genes associated with differentiation.
Interestingly, gene set enrichment analysis (GSEA) and gene ontology (GO) classification of RNA-seq data revealed that a significant number of genes involved in cell migration were affected by UNC0638 (Figures 5D, 5F, S5A, and S5B; Table S1), suggesting that G9A inhibition led to impaired migration capacity. One of the differentially regulated genes, the G-protein-coupled receptor Cxcr4, plays essential roles in HSC homing and engraftment by responding to the chemokine SDF1 (aka CXCL12) (Nagasawa et al., 1998, Peled et al., 1999, Smith-Berdan et al., 2011, Zou et al., 1998). To test the functional significance of Cxcr4 dysregulation, we performed transwell migration assays toward SDF1. We found a significant decrease in the migration efficiency of UNC0638-treated HSPCs, but not myeloid progenitors, compared to the DMSO control (Figure 5G). Reduced migration efficiency, combined with the increased fraction of cells in cycle (Figure 5B), which correlates with poor HSC engraftment ability (Passegué et al., 2005), likely explains the lack of increased reconstitution by UNC0638-treated HSCs compared to untreated cells (Figures 5C, S4A, and S4B). Nevertheless, our results suggest that proper transition of euchromatic regions into silenced heterochromatin, mediated in part by G9A, promotes the developmental programs necessary for HSC maintenance and efficient stem cell differentiation.
Discussion
Here, using several sensitive, complementary approaches, we were able to assess the chromatin organization of rare, primary hematopoietic cells. Our investigation revealed how chromatin composition and organization dramatically change from ESCs to HSCs, hematopoietic progenitor cells, and terminally differentiated blood cells (Figures 1, 2, 3, S1, S2, and S3). We found that the large amount of euchromatin present in pluripotent ESCs decreases gradually with lineage commitment (Figures 2A, 2B, and S2) and that the layer of heterochromatin at the nuclear envelope increases with cellular differentiation (Figures 3 and S3). We revealed a global, gradual change in chromatin condensation between pluripotent and multipotent stem cells and fully mature cells (Figures 1A, 1B, 2A–2C, and S2A). It appears that both the amount of euchromatin and the spatial distribution of heterochromatin define the transition between stem and progenitor cells. The differences in chromatin distribution likely affect the transcriptional competence of a cell, being highly permissive in ESCs, followed by an intermediate state in multipotent HSCs and MPPs, and culminating in a highly restricted chromatin conformation and the permanent silencing of developmental programs in mature cells.
Interestingly, we found no major differences in global chromatin composition or spatial organization between HSCs and MPPs (Figures 1, 2, 3, S2, and S3), which differ in self-renewal capability but share the capability to give rise to all hematopoietic lineages (Boyer et al., 2011, Forsberg et al., 2006). Myeloid-restricted GMPs also have similar nuclease sensitivity and euchromatin content. However, GMPs deviated significantly from the “expected” increase in perinuclear localized heterochromatin distribution that accompanied differentiation in the other cases investigated (Figures 3A–3C and S3). This ESC-like heterochromatin organization in GMPs may be related to GMPs’ high reprogramming efficiency (Eminli et al., 2009, Guo et al., 2014). As reprogramming is more efficient in cells with highly dynamic epigenomes (Alabert and Groth, 2012), our findings are important for understanding the mechanisms of differential reprogramming efficiency from different types of adult cells.
Our inability to detect significant differences in the overall level of DNA methylation (Figure S1D) and individual histone modifications (Figures 1C, 1D, and S1C–S1E) indicates that the substantial chromatin condensation that occurs upon stem cell differentiation cannot be attributed to a single modification. Our data are supported by the lack of overall changes in DNA methylation levels during HSC differentiation (Bock et al., 2012, Ji et al., 2010) and by relatively modest differences in global levels of histone modifications between ESCs and MEFs by sensitive mass spectroscopy (Sridharan et al., 2013). While the patterns of individual modifications clearly change at gene regulatory sites as stem cells differentiate, global levels of individual marks seem to remain largely unchanged. Instead, relatively small changes in multiple modifications may cumulatively lead to the global chromatin condensation that we observed among pluripotent ESCs, multipotent HSPCs, and mature hematopoietic cells.
We also showed that the chromatin remodeler G9A plays an important role in HSC differentiation. We found that lack of G9A function significantly impaired the differentiation ability of HSCs in vitro and led to accumulation of HSPCs (Figures 4 and 5A). Similar effects have been reported by G9A inhibition in human hematopoietic progenitor cells (Chen et al., 2012). G9A also regulates the timing of pluripotency gene silencing upon ESC differentiation (Yamamizu et al., 2012) and improves the reprogramming efficiency of adult somatic cells into induced pluripotent stem cells (iPSCs) (Shi et al., 2008). While germline deletion of G9A results in embryonic lethality (Tachibana et al., 2002), mice with hematopoietic-specific deletion of G9A display few abnormalities (Lehnertz et al., 2010). The clear effect on HSC differentiation in vitro by inhibiting G9A with UNC0638 may therefore seem surprising. A possible explanation is that HSCs are more capable of compensating for lack of one epigenetic regulator in vivo than they are in vitro, enabling them to cope with loss of functionality that delays differentiation in vitro. Collectively, our results and analogous studies in ESCs and human HSCs suggest that G9A functions to silence genes associated with the transition of stem cells into lineage-committed cells. In our study, failure to silence these genes led to a delay, but not complete block, in HSC differentiation (Figures 4 and 5A). G9A inhibition, alone, also failed to maintain genes necessary for robust HSC engraftment upon transplantation (Figures 5C–5G, S4, and S5; Table S1). Nevertheless, G9A has emerged as an essential epigenetic regulator of stem cell function. Our new insights on global chromatin composition and distribution provide a solid platform for furthering a deeper comprehension on the epigenetic regulation of stem cell fate and function.
Experimental Procedures
Mice and Cells
All experiments were performed using 8- to 12-week-old C57BL/6 wild-type mice in accordance with UCSC guidelines. Hematopoietic cells were isolated from BM isolated from murine femurs and tibias as described (Forsberg et al., 2006, Beaudin et al., 2014, Smith-Berdan et al., 2015). ESCs (E14) were cultured as described (Gaspar-Maia et al., 2009).
Nuclease Sensitivity
FACS-sorted cells were incubated for 6 min at 37°C with increasing concentrations of DNaseI or micrococcal nuclease. Reactions were terminated by adding equal volume of lysis buffer (10 mM Tris [pH 7.8], 0.1M EDTA, 10 mM EGTA, and 0.5% SDS), 0.4 mg/ml proteinase K, and 20 μg/mL of RNase and incubated at 42°C for 2 hr. DNA was isolated using phenol/chloroform and analyzed on 1% agarose gels with SyberGold.
Electron Microscopy
Fixed cells were ultrathin sectioned on a Reichert Ultracut S ultramicrotome and counter-stained with 0.8% lead citrate. Grids were examined on a JEOL JEM-1230 transmission electron microscope and photographed with the Gatan Ultrascan 1000 digital camera at the Gladstone Institute EM facility, San Francisco, CA, followed by ImageJ analysis (Figure 2B).
Soft X-Ray Microscopy
FACS-sorted cells were mounted in thin-walled glass capillary tubes and rapidly cryo-immobilized prior to mounting in a cryogenic specimen rotation stage of the XM-2 Soft X-ray microscope (Le Gros et al., 2005). Three-dimensional tomograms were used for calculations and movies (Movies S1, S2, and S3).
HSC Culturing and Transplantation
FACS-sorted HSCs (KLS Flk2-Slamf1+) were seeded at 100–500 cells into 96-well plates and grown in liquid culture or on ATF024 stromal cells. After culture with and without UNC0638 (Sigma), cells were analyzed for cell surface marker expression by flow cytometry and transplanted into congenic, irradiated C57BL/6 mice.
Acknowledgments
We thank Drs. Kateri Moore for the AFT024 cells and Jeremy Sanford and Sol Katzman for advice on gene expression analysis; Santa Cruz Biotechnology for antibodies; and Rohinton Kamakaka and Forsberg lab members for comments on the manuscript. This work was supported by an NIH/NHLBI award (R01HL115158), the Santa Cruz Cancer Benefit group, and UCSC startup funds to E.C.F.; by the Gordon and Betty Moore Foundation (3497) to C.A.L.; by NIH/NIGMS (P41GM103445) and US DOE/BER (DE-AC02-05CH11231) to The National Center for X-ray Tomography by CIRM Training grant TG2-01157 to F.U. and J.K.; by a UCSC IMSD award from NIH/NIGMS to R.S. (R25GM058903); by CIRM SCILL grant TB1-01195 to E.W.M. via San Jose State University; and by CIRM Shared Stem Cell Facilities (CL1-00506) and CIRM Major Facilities (FA1-00617-1) awards to UCSC. E.C.F. is the recipient of a California Institute for Regenerative Medicine (CIRM) New Faculty Award (RN1-00540) and an American Cancer Society Research Scholar Award (RSG-13-193-01-DDC).
Published: October 15, 2015
Footnotes
This is an open access article under the CC BY-NC-ND license (http://creativecommons.org/licenses/by-nc-nd/4.0/).
Supplemental Information includes Supplemental Experimental Procedures, five figures, two tables, and three movies and can be found with this article online at http://dx.doi.org/10.1016/j.stemcr.2015.09.009.
Supplemental Information
Nuclear architecture is distinctly different during stem cell differentiation into mature cells. Soft X-ray tomography was used to image whole, fully hydrated cells. The movies feature the cell (gray) and the shape of the nucleus (blue), euchromatin (green), nucleoli (red), lipid bodies (yellow), and mitochondria (gold); related to Figure 2.
References
- Alabert C., Groth A. Chromatin replication and epigenome maintenance. Nat. Rev. Mol. Cell Biol. 2012;13:153–167. doi: 10.1038/nrm3288. [DOI] [PubMed] [Google Scholar]
- Asai T., Liu Y., Di Giandomenico S., Bae N., Ndiaye-Lobry D., Deblasio A., Menendez S., Antipin Y., Reva B., Wevrick R., Nimer S.D. Necdin, a p53 target gene, regulates the quiescence and response to genotoxic stress of hematopoietic stem/progenitor cells. Blood. 2012;120:1601–1612. doi: 10.1182/blood-2011-11-393983. [DOI] [PMC free article] [PubMed] [Google Scholar]
- Azuara V., Perry P., Sauer S., Spivakov M., Jørgensen H.F., John R.M., Gouti M., Casanova M., Warnes G., Merkenschlager M., Fisher A.G. Chromatin signatures of pluripotent cell lines. Nat. Cell Biol. 2006;8:532–538. doi: 10.1038/ncb1403. [DOI] [PubMed] [Google Scholar]
- Barski A., Cuddapah S., Cui K., Roh T.-Y., Schones D.E., Wang Z., Wei G., Chepelev I., Zhao K. High-resolution profiling of histone methylations in the human genome. Cell. 2007;129:823–837. doi: 10.1016/j.cell.2007.05.009. [DOI] [PubMed] [Google Scholar]
- Beaudin A.E., Boyer S.W., Forsberg E.C. Flk2/Flt3 promotes both myeloid and lymphoid development by expanding non-self-renewing multipotent hematopoietic progenitor cells. Exp. Hematol. 2014;42:218–229. doi: 10.1016/j.exphem.2013.11.013. [DOI] [PMC free article] [PubMed] [Google Scholar]
- Bernardino J., Roux C., Almeida A., Vogt N., Gibaud A., Gerbault-Seureau M., Magdelenat H., Bourgeois C.A., Malfoy B., Dutrillaux B. DNA hypomethylation in breast cancer: an independent parameter of tumor progression? Cancer Genet. Cytogenet. 1997;97:83–89. doi: 10.1016/s0165-4608(96)00385-8. [DOI] [PubMed] [Google Scholar]
- Bernstein B.E., Mikkelsen T.S., Xie X., Kamal M., Huebert D.J., Cuff J., Fry B., Meissner A., Wernig M., Plath K. A bivalent chromatin structure marks key developmental genes in embryonic stem cells. Cell. 2006;125:315–326. doi: 10.1016/j.cell.2006.02.041. [DOI] [PubMed] [Google Scholar]
- Bock C., Beerman I., Lien W.H., Smith Z.D., Gu H., Boyle P., Gnirke A., Fuchs E., Rossi D.J., Meissner A. DNA methylation dynamics during in vivo differentiation of blood and skin stem cells. Mol. Cell. 2012;47:633–647. doi: 10.1016/j.molcel.2012.06.019. [DOI] [PMC free article] [PubMed] [Google Scholar]
- Boyer S.W., Schroeder A.V., Smith-Berdan S., Forsberg E.C. All hematopoietic cells develop from hematopoietic stem cells through Flk2/Flt3-positive progenitor cells. Cell Stem Cell. 2011;9:64–73. doi: 10.1016/j.stem.2011.04.021. [DOI] [PMC free article] [PubMed] [Google Scholar]
- Boyer S.W., Beaudin A.E., Forsberg E.C. Mapping differentiation pathways from hematopoietic stem cells using Flk2/Flt3 lineage tracing. Cell Cycle. 2012;11:3180–3188. doi: 10.4161/cc.21279. [DOI] [PMC free article] [PubMed] [Google Scholar]
- Bröske A.M., Vockentanz L., Kharazi S., Huska M.R., Mancini E., Scheller M., Kuhl C., Enns A., Prinz M., Jaenisch R. DNA methylation protects hematopoietic stem cell multipotency from myeloerythroid restriction. Nat. Genet. 2009;41:1207–1215. doi: 10.1038/ng.463. [DOI] [PubMed] [Google Scholar]
- Challen G.A., Sun D., Jeong M., Luo M., Jelinek J., Berg J.S., Bock C., Vasanthakumar A., Gu H., Xi Y. Dnmt3a is essential for hematopoietic stem cell differentiation. Nat. Genet. 2011;44:23–31. doi: 10.1038/ng.1009. [DOI] [PMC free article] [PubMed] [Google Scholar]
- Chen X., Skutt-Kakaria K., Davison J., Ou Y.L., Choi E., Malik P., Loeb K., Wood B., Georges G., Torok-Storb B., Paddison P.J. G9a/GLP-dependent histone H3K9me2 patterning during human hematopoietic stem cell lineage commitment. Genes Dev. 2012;26:2499–2511. doi: 10.1101/gad.200329.112. [DOI] [PMC free article] [PubMed] [Google Scholar]
- Dai B., Giardina C., Rasmussen T.P. Quantitation of nucleosome acetylation and other histone posttranslational modifications using microscale NU-ELISA. Methods Mol. Biol. 2013;981:167–176. doi: 10.1007/978-1-62703-305-3_13. [DOI] [PubMed] [Google Scholar]
- Efroni S., Duttagupta R., Cheng J., Dehghani H., Hoeppner D.J., Dash C., Bazett-Jones D.P., Le Grice S., McKay R.D.G., Buetow K.H. Global transcription in pluripotent embryonic stem cells. Cell Stem Cell. 2008;2:437–447. doi: 10.1016/j.stem.2008.03.021. [DOI] [PMC free article] [PubMed] [Google Scholar]
- Eminli S., Foudi A., Stadtfeld M., Maherali N., Ahfeldt T., Mostoslavsky G., Hock H., Hochedlinger K. Differentiation stage determines potential of hematopoietic cells for reprogramming into induced pluripotent stem cells. Nat. Genet. 2009;41:968–976. doi: 10.1038/ng.428. [DOI] [PMC free article] [PubMed] [Google Scholar]
- Forsberg E.C., Serwold T., Kogan S., Weissman I.L., Passegué E. New evidence supporting megakaryocyte-erythrocyte potential of flk2/flt3+ multipotent hematopoietic progenitors. Cell. 2006;126:415–426. doi: 10.1016/j.cell.2006.06.037. [DOI] [PubMed] [Google Scholar]
- Gaspar-Maia A., Alajem A., Polesso F., Sridharan R., Mason M.J., Heidersbach A., Ramalho-Santos J., McManus M.T., Plath K., Meshorer E., Ramalho-Santos M. Chd1 regulates open chromatin and pluripotency of embryonic stem cells. Nature. 2009;460:863–868. doi: 10.1038/nature08212. [DOI] [PMC free article] [PubMed] [Google Scholar]
- Gekas C., Graf T. CD41 expression marks myeloid-biased adult hematopoietic stem cells and increases with age. Blood. 2013;121:4463–4472. doi: 10.1182/blood-2012-09-457929. [DOI] [PubMed] [Google Scholar]
- Guo S., Zi X., Schulz V.P., Cheng J., Zhong M., Koochaki S.H.J., Megyola C.M., Pan X., Heydari K., Weissman S.M. Nonstochastic reprogramming from a privileged somatic cell state. Cell. 2014;156:649–662. doi: 10.1016/j.cell.2014.01.020. [DOI] [PMC free article] [PubMed] [Google Scholar]
- Ho L., Ronan J.L., Wu J., Staahl B.T., Chen L., Kuo A., Lessard J., Nesvizhskii A.I., Ranish J., Crabtree G.R. An embryonic stem cell chromatin remodeling complex, esBAF, is essential for embryonic stem cell self-renewal and pluripotency. Proc. Natl. Acad. Sci. USA. 2009;106:5181–5186. doi: 10.1073/pnas.0812889106. [DOI] [PMC free article] [PubMed] [Google Scholar]
- Ji H., Ehrlich L.I.R., Seita J., Murakami P., Doi A., Lindau P., Lee H., Aryee M.J., Irizarry R.A., Kim K. Comprehensive methylome map of lineage commitment from haematopoietic progenitors. Nature. 2010;467:338–342. doi: 10.1038/nature09367. [DOI] [PMC free article] [PubMed] [Google Scholar]
- Le Gros M.A., McDermott G., Larabell C.A. X-ray tomography of whole cells. Curr. Opin. Struct. Biol. 2005;15:593–600. doi: 10.1016/j.sbi.2005.08.008. [DOI] [PubMed] [Google Scholar]
- Lehnertz B., Northrop J.P., Antignano F., Burrows K., Hadidi S., Mullaly S.C., Rossi F.M.V., Zaph C. Activating and inhibitory functions for the histone lysine methyltransferase G9a in T helper cell differentiation and function. J. Exp. Med. 2010;207:915–922. doi: 10.1084/jem.20100363. [DOI] [PMC free article] [PubMed] [Google Scholar]
- McDermott G., Le Gros M.A., Knoechel C.G., Uchida M., Larabell C.A. Soft X-ray tomography and cryogenic light microscopy: the cool combination in cellular imaging. Trends Cell Biol. 2009;19:587–595. doi: 10.1016/j.tcb.2009.08.005. [DOI] [PMC free article] [PubMed] [Google Scholar]
- Meshorer E., Yellajoshula D., George E., Scambler P.J., Brown D.T., Misteli T. Hyperdynamic plasticity of chromatin proteins in pluripotent embryonic stem cells. Dev. Cell. 2006;10:105–116. doi: 10.1016/j.devcel.2005.10.017. [DOI] [PMC free article] [PubMed] [Google Scholar]
- Min I.M., Pietramaggiori G., Kim F.S., Passegué E., Stevenson K.E., Wagers A.J. The transcription factor EGR1 controls both the proliferation and localization of hematopoietic stem cells. Cell Stem Cell. 2008;2:380–391. doi: 10.1016/j.stem.2008.01.015. [DOI] [PubMed] [Google Scholar]
- Moore K.A., Ema H., Lemischka I.R. In vitro maintenance of highly purified, transplantable hematopoietic stem cells. Blood. 1997;89:4337–4347. [PubMed] [Google Scholar]
- Morrison S.J., Wright D.E., Weissman I.L. Cyclophosphamide/granulocyte colony-stimulating factor induces hematopoietic stem cells to proliferate prior to mobilization. Proc. Natl. Acad. Sci. USA. 1997;94:1908–1913. doi: 10.1073/pnas.94.5.1908. [DOI] [PMC free article] [PubMed] [Google Scholar]
- Nagasawa T., Tachibana K., Kishimoto T. A novel CXC chemokine PBSF/SDF-1 and its receptor CXCR4: their functions in development, hematopoiesis and HIV infection. Semin. Immunol. 1998;10:179–185. doi: 10.1006/smim.1998.0128. [DOI] [PubMed] [Google Scholar]
- Parkinson D.Y., Epperly L.R., McDermott G., Le Gros M.A., Boudreau R.M., Larabell C.A. Nanoimaging cells using soft X-ray tomography. Methods Mol. Biol. 2013;950:457–481. doi: 10.1007/978-1-62703-137-0_25. [DOI] [PubMed] [Google Scholar]
- Passegué E., Wagers A.J., Giuriato S., Anderson W.C., Weissman I.L. Global analysis of proliferation and cell cycle gene expression in the regulation of hematopoietic stem and progenitor cell fates. J. Exp. Med. 2005;202:1599–1611. doi: 10.1084/jem.20050967. [DOI] [PMC free article] [PubMed] [Google Scholar]
- Peled A., Petit I., Kollet O., Magid M., Ponomaryov T., Byk T., Nagler A., Ben-Hur H., Many A., Shultz L. Dependence of human stem cell engraftment and repopulation of NOD/SCID mice on CXCR4. Science. 1999;283:845–848. doi: 10.1126/science.283.5403.845. [DOI] [PubMed] [Google Scholar]
- Sabo P.J., Kuehn M.S., Thurman R., Johnson B.E., Johnson E.M., Cao H., Yu M., Rosenzweig E., Goldy J., Haydock A. Genome-scale mapping of DNase I sensitivity in vivo using tiling DNA microarrays. Nat. Methods. 2006;3:511–518. doi: 10.1038/nmeth890. [DOI] [PubMed] [Google Scholar]
- Shi Y., Do J.T., Desponts C., Hahm H.S., Schöler H.R., Ding S. A combined chemical and genetic approach for the generation of induced pluripotent stem cells. Cell Stem Cell. 2008;2:525–528. doi: 10.1016/j.stem.2008.05.011. [DOI] [PubMed] [Google Scholar]
- Shinkai Y., Tachibana M. H3K9 methyltransferase G9a and the related molecule GLP. Genes Dev. 2011;25:781–788. doi: 10.1101/gad.2027411. [DOI] [PMC free article] [PubMed] [Google Scholar]
- Smith-Berdan S., Nguyen A., Hassanein D., Zimmer M., Ugarte F., Ciriza J., Li D., García-Ojeda M.E., Hinck L., Forsberg E.C. Robo4 cooperates with CXCR4 to specify hematopoietic stem cell localization to bone marrow niches. Cell Stem Cell. 2011;8:72–83. doi: 10.1016/j.stem.2010.11.030. [DOI] [PMC free article] [PubMed] [Google Scholar]
- Smith-Berdan S., Nguyen A., Hong M.A., Forsberg E.C. ROBO4-mediated vascular integrity regulates the directionality of hematopoietic stem cell trafficking. Stem Cell Reports. 2015;4:255–268. doi: 10.1016/j.stemcr.2014.12.013. [DOI] [PMC free article] [PubMed] [Google Scholar]
- Sridharan R., Gonzales-Cope M., Chronis C., Bonora G., McKee R., Huang C., Patel S., Lopez D., Mishra N., Pellegrini M. Proteomic and genomic approaches reveal critical functions of H3K9 methylation and heterochromatin protein-1γ in reprogramming to pluripotency. Nat. Cell Biol. 2013;15:872–882. doi: 10.1038/ncb2768. [DOI] [PMC free article] [PubMed] [Google Scholar]
- Stergachis A.B., Neph S., Reynolds A., Humbert R., Miller B., Paige S.L., Vernot B., Cheng J.B., Thurman R.E., Sandstrom R. Developmental fate and cellular maturity encoded in human regulatory DNA landscapes. Cell. 2013;154:888–903. doi: 10.1016/j.cell.2013.07.020. [DOI] [PMC free article] [PubMed] [Google Scholar]
- Tachibana M., Sugimoto K., Nozaki M., Ueda J., Ohta T., Ohki M., Fukuda M., Takeda N., Niida H., Kato H., Shinkai Y. G9a histone methyltransferase plays a dominant role in euchromatic histone H3 lysine 9 methylation and is essential for early embryogenesis. Genes Dev. 2002;16:1779–1791. doi: 10.1101/gad.989402. [DOI] [PMC free article] [PubMed] [Google Scholar]
- Terme J.M., Sesé B., Millán-Ariño L., Mayor R., Izpisúa Belmonte J.C., Barrero M.J., Jordan A. Histone H1 variants are differentially expressed and incorporated into chromatin during differentiation and reprogramming to pluripotency. J. Biol. Chem. 2011;286:35347–35357. doi: 10.1074/jbc.M111.281923. [DOI] [PMC free article] [PubMed] [Google Scholar]
- Trowbridge J.J., Snow J.W., Kim J., Orkin S.H. DNA methyltransferase 1 is essential for and uniquely regulates hematopoietic stem and progenitor cells. Cell Stem Cell. 2009;5:442–449. doi: 10.1016/j.stem.2009.08.016. [DOI] [PMC free article] [PubMed] [Google Scholar]
- Vedadi M., Barsyte-Lovejoy D., Liu F., Rival-Gervier S., Allali-Hassani A., Labrie V., Wigle T.J., Dimaggio P.A., Wasney G.A., Siarheyeva A. A chemical probe selectively inhibits G9a and GLP methyltransferase activity in cells. Nat. Chem. Biol. 2011;7:566–574. doi: 10.1038/nchembio.599. [DOI] [PMC free article] [PubMed] [Google Scholar]
- Yamamizu K., Fujihara M., Tachibana M., Katayama S., Takahashi A., Hara E., Imai H., Shinkai Y., Yamashita J.K. Protein kinase A determines timing of early differentiation through epigenetic regulation with G9a. Cell Stem Cell. 2012;10:759–770. doi: 10.1016/j.stem.2012.02.022. [DOI] [PubMed] [Google Scholar]
- Zou Y.R., Kottmann A.H., Kuroda M., Taniuchi I., Littman D.R. Function of the chemokine receptor CXCR4 in haematopoiesis and in cerebellar development. Nature. 1998;393:595–599. doi: 10.1038/31269. [DOI] [PubMed] [Google Scholar]
Associated Data
This section collects any data citations, data availability statements, or supplementary materials included in this article.
Supplementary Materials
Nuclear architecture is distinctly different during stem cell differentiation into mature cells. Soft X-ray tomography was used to image whole, fully hydrated cells. The movies feature the cell (gray) and the shape of the nucleus (blue), euchromatin (green), nucleoli (red), lipid bodies (yellow), and mitochondria (gold); related to Figure 2.