

Summary
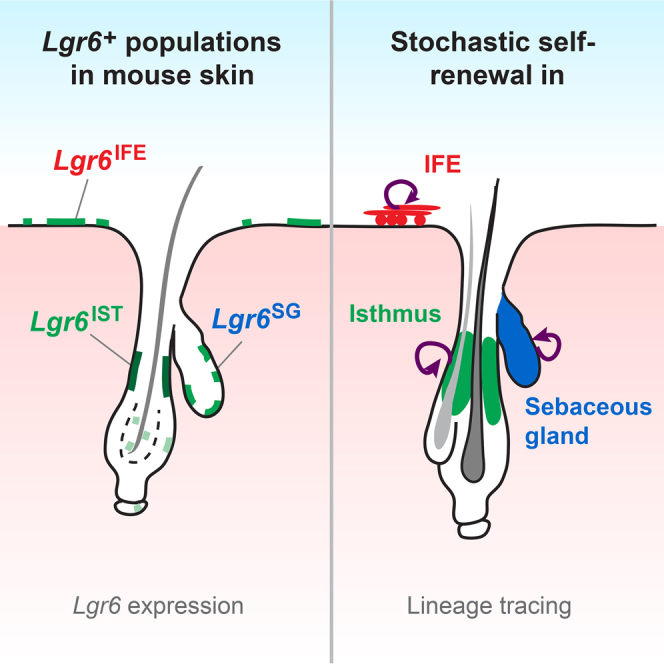
The dynamics and interactions between stem cell pools in the hair follicle (HF), sebaceous gland (SG), and interfollicular epidermis (IFE) of murine skin are still poorly understood. In this study, we used multicolor lineage tracing to mark Lgr6-expressing basal cells in the HF isthmus, SG, and IFE. We show that these Lgr6+ cells constitute long-term self-renewing populations within each compartment in adult skin. Quantitative analysis of clonal dynamics revealed that the Lgr6+ progenitor cells compete neutrally in the IFE, isthmus, and SG, indicating population asymmetry as the underlying mode of tissue renewal. Transcriptional profiling of Lgr6+ and Lgr6− cells did not reveal a distinct Lgr6-associated gene expression signature, raising the question of whether Lgr6 expression requires extrinsic niche signals. Our results elucidate the interrelation and behavior of Lgr6+ populations in the IFE, HF, and SG and suggest population asymmetry as a common mechanism for homeostasis in several epithelial skin compartments.
Graphical Abstract
Highlights
-
•
Lgr6 marks independent self-renewing populations in the IFE, HF isthmus, and SG
-
•
Renewal of IFE, isthmus, and SG by Lgr6+ cells follows from neutral competition
-
•
Lgr6+ cells are not distinguishable by unique transcriptional signatures
In this article, Kasper and colleagues demonstrate that the hair follicle isthmus, sebaceous gland, and interfollicular epidermis harbor independent self-renewing Lgr6+ progenitor populations and that renewal of these populations follows from neutral competition.
Introduction
Skin contains several epithelial structures that undergo constant self-renewal, including the hair follicle (HF), sebaceous gland (SG), and interfollicular epidermis (IFE), making it an ideal organ to study the lineage potential of stem cells in a compartmentalized tissue (Blanpain and Fuchs, 2009, Schepeler et al., 2014). Hair is generated in recurring cycles of growth (anagen), regression (catagen), and resting (telogen) phases of the lower HF part (Müller-Röver et al., 2001). In contrast, the IFE and SG continuously produce cells that differentiate into stratified epithelium or mature sebocytes, respectively (Blanpain and Fuchs, 2014). The murine pilosebaceous unit (PSU), encompassing the HF and SG, has a well-defined anatomy that consists of several subcompartments. The bulge, containing mainly quiescent progenitor cells, and the hair germ, which is in direct contact with the dermal papilla, contribute to the hair lineages during anagen (Greco et al., 2009, Jaks et al., 2008, Rompolas and Greco, 2014). The permanent part of the HF that does not participate in hair regeneration comprises the isthmus, spanning from the bulge to the infundibulum, the junctional zone, which is the upper region of the isthmus adjacent to the SG, and the infundibulum, linking the PSU and the IFE (Schepeler et al., 2014).
Genetic fate-mapping studies using lineage tracing in vivo demonstrated that molecularly defined basal cells that possess stem cell properties reside in most of these regions (Jaks et al., 2010, Kretzschmar and Watt, 2014). Apart from self-renewal, their contribution to other structures seems to remain locally restricted, although contribution of HF cells to SG maintenance during homeostasis has been proposed (Petersson et al., 2011, Schepeler et al., 2014). Because of the large variety of genetic markers used to study the individual stem cell populations, direct comparisons of the results have been difficult. Thus, the interrelation between different stem cell pools within the PSU remains to be elucidated.
The IFE is less well characterized in terms of its cellular heterogeneity and molecular markers. However, the mode of stem cell renewal in the IFE has been a subject of intense research (Doupé and Jones, 2012). Based on genetic lineage tracing studies, it has been proposed that the maintenance of IFE tissue relies on the turnover of a single population of progenitors, which follows a pattern of balanced stochastic fate (Clayton et al., 2007, Doupé et al., 2010). In this paradigm, the division of basal progenitors results in stochastic fate outcome, with cells choosing stochastically between symmetrical duplication, asymmetrical division, and terminal division. However, to achieve homeostasis, the chance of terminal cell division is balanced with the frequency of symmetric duplication so that, on average, cell division results in asymmetric fate outcome. A similar mode of stochastic self-renewal, termed population asymmetry (Watt and Hogan, 2000), was also observed in other tissues, such as the male germline (Nakagawa et al., 2007), the small intestine (Lopez-Garcia et al., 2010, Snippert et al., 2010b), the esophagus (Doupé et al., 2012), and the stomach (Leushacke et al., 2013). Moreover, a study based on separate targeted promoters provided evidence of proliferative heterogeneity in IFE, with the committed progenitor cell pool underpinned by a second quiescent or slow-cycling stem cell population, which becomes mobilized on injury (Mascré et al., 2012). However, no studies have been performed to determine whether compartments within the PSU are maintained by population asymmetry or whether stem cell self-renewal follows a process of invariant asymmetry in which each and every stem cell division results in an asymmetric fate outcome.
Expression of Lgr6 (leucine-rich repeat-containing G protein-coupled receptor 6) was initially reported to be a specific marker of stem cells located in the HF isthmus that were thought to give rise to cells of the HF, SG, and IFE lineage (Snippert et al., 2010a). More recent reports have uncovered that Lgr6 is additionally present in basal cells of the IFE and the SG (Liao and Nguyen, 2014, Page et al., 2013), thus questioning the origin of the Lgr6+-derived clones in the first study.
The aim of this study was to define the stem cell properties of the Lgr6+ cell populations in the HF, SG, and IFE and understand their interrelation. Tracking the fate of Lgr6+ cells using multicolor lineage tracing, the current study revealed that Lgr6+ cells in the IFE are able to maintain IFE tissue without contribution from Lgr6+ PSU cells. In the isthmus and SG, local Lgr6+ cell populations exhibited the potential for long-term maintenance of their respective compartment. Furthermore, quantitative analysis of clonal dynamics revealed that local Lgr6+ progenitors renew all three compartments through the process of population asymmetry. Finally, genome-wide mRNA profiling uncovered that the transcriptome of Lgr6+ keratinocytes is mainly determined by the cellular location, rather than by a gene signature specific for Lgr6+ cells.
Results
Characterization of Lgr6 Expression in Murine Dorsal Skin
As a prerequisite to investigating how Lgr6+ keratinocytes produce HF, IFE, and SG, we first characterized Lgr6 expression in the skin using Lgr6-EGFP-Ires-CreERT2 knockin mice (Snippert et al., 2010a), where EGFP marks cells with active transcription of the Lgr6 locus (Lgr6+ cells). A substantial number of Lgr6+ cells were found in the basal layer of the isthmus (Lgr6IST), IFE (Lgr6IFE), and the SG (Lgr6SG), with the highest EGFP levels present in the isthmus (Figure 1A), which is consistent with previous findings (Liao and Nguyen, 2014, Page et al., 2013, Snippert et al., 2010a). Additional EGFP antibody staining revealed intermittent, medium- to low-level Lgr6-EGFP-expressing cells in the dermal papilla and the inner and outer layer of the bulge (Figures 1A and 1B). Sensitive mRNA in situ detection on WT telogen skin confirmed Lgr6 transcription in all skin compartments described above (Figure 1C). Throughout the hair cycle, a similar epithelial Lgr6-EGFP-expression pattern was observed as in telogen, with additional Lgr6-EGFP expression in the proximal part of the early extending and full-grown anagen HF (Figures S1A and S1B).
Figure 1.

Lgr6 Expression Pattern in Murine Dorsal Skin
(A) EGFP fluorescence detected by confocal microscopy with EGFP antibody (bottom, n = 5 mice) or without antibody staining (top, no AB, n = 5 mice) in skin of Lgr6-EGFP-Ires-CreERT2 mice at P3w. EGFP is expressed at high levels in the isthmus (IST), at medium levels in the IFE and SG (arrows), and at low levels in the bulge and dermal papilla (arrowheads).
(B) Summary illustrating high (dark green), medium (light green), and low (pale green) Lgr6-EGFP expressing cell populations in dorsal telogen skin. Marked cells do not represent absolute positions and numbers of Lgr6-EGFP expressing cells.
(C) Representative pattern of Lgr6 mRNA expression in a telogen HF using single-molecule RNA ISH. Shown are confocal z-stack projections. Co-staining with a K5-specific probe indicates the basal identity of Lgr6+ cells in the epithelium (n = 3 mice). HG, hair germ; DP, dermal papilla.
(D) Quantification of Lgr6IFE cells using image analysis. Projections of flat-mount confocal z stacks recorded in dorsal skin of Lgr6-EGFP-Ires-CreERT2 mice at P3w and P8w. Magnified sections depict the X, Y, and Z planes, with (right) and without (left) rendering; dashed blue lines indicate basement membrane. The relative number of Lgr6IFE cells was determined as the ratio of EGFP+ cells to the total IFE basal cell number (n ≥ 3 mice for each time point).
(E) Co-staining in skin of Lgr6-EGFP-Ires-CreERT2 mice with anti-EGFP and anti-BrdU antibodies at P3w telogen; BrdU chased for 2 hr. BrdU-positive cells in Lgr6IFE and Lgr6− IFE basal cells were quantified (n = 3 mice, more than 1,000 IFE cells were counted per mouse).
(F) DNA content of keratinocytes from Lgr6-EGFP-Ires-CreERT2 mice, isolated at P3w telogen, was measured by FACS to determine the percentage of cells in S and G2-M cell-cycle phase in the EGFPhi and EGFP− fractions of SCA-1+ (IFE/infundibulum) and SCA-1− (PSU) cells (n = 4 mice). (Inset) Representative Vibrant DyeCycle histograms.
TO-PRO-3 nuclear stain is shown in (A), (D), and (E). DAPI nuclear stain is shown in (C), and without EGFP antibody staining: no AB in (A) and (D). Scale bars represent 50 μm (A and D), 15 μm (C), and 25 μm (E). Data are shown as mean ± SD. Asterisks indicate t test significance level at ∗p < 0.05 and ∗∗p < 0.01. See also Figure S1.
Lgr6IFE cells of dorsal skin are located exclusively in the basal layer of the epidermis (Figures 1C and 1D). Quantification of Lgr6IFE cells by image analysis revealed that the IFE contains approximately 5% Lgr6-EGFP-expressing basal cells at postnatal week 3 (P3w). During adolescence, the number of Lgr6IFE cells significantly increased, eventually reaching a steady state in adult mice at around 22% (Figure 1D). To quantify Lgr6IFE cells by fluorescence-activated cell sorting (FACS), we stained isolated keratinocytes of Lgr6-EGFP-Ires-CreERT2 mice with SCA-1 and CD49f (integrin alpha 6) antibodies (Jensen et al., 2008) to discriminate Lgr6IFE cells (SCA-1+) from Lgr6+ keratinocytes of the PSU (Lgr6PSU) (SCA-1−). The FACS analysis confirmed that the fraction of EGFPhi cells increased from P3w to P8w in both SCA-1+ and SCA-1− fractions (Figure S1C).
Because Lgr6+ cells are found in rapidly proliferating epidermal regions, such as the isthmus and the hair germ upon anagen entry (Figure S1A) (Lien et al., 2014), we investigated whether Lgr6IFE cells differed from Lgr6− IFE cells in regard to cell-cycle activity. A 2-hr bromodeoxyuridine (BrdU) pulse during telogen revealed a comparable BrdU+ cell fraction in Lgr6IFE and Lgr6− IFE cells, suggesting similar proliferation rates at the population level (Figure 1E). Analysis of the DNA content by FACS confirmed that Lgr6IFE cells do not significantly differ from Lgr6− IFE cells in cell-cycle activity (Figure 1F). FACS analysis further disclosed a higher cell-cycle activity in Lgr6PSU cells compared with Lgr6− PSU cells (Figure 1E), likely reflecting the abundance of Lgr6+ cells in the more proliferative isthmus area relative to the rest of the telogen HF (Figure S1D).
Overall, Lgr6 expression marks a subset of basal cells in several epithelial skin compartments and is not generally correlated with cell division.
The R26R-Confetti Reporter Labels Three Basal Lgr6+ Populations
In order to investigate whether the different Lgr6+ populations in the dorsal epidermis are able to maintain tissue within their local compartment, we employed a lineage tracing strategy in Lgr6-EGFP-Ires-CreERT2 mice combined with R26R-Confetti multicolor reporter mice (Snippert et al., 2010b). After Cre-mediated recombination, one of four fluorescent marker proteins will be expressed, generating nuclear green, cytoplasmic yellow, cytoplasmic red, or membranous blue cells (Confetti-labeled cells). This allows discrimination between the clonal progeny of individual cells. Fluorescent labeling and tracing of Lgr6+ cells were induced at first telogen (P3w) by topical application of a single tamoxifen dose. Subsequently, Confetti-labeled cells and entire clones were mapped to the different epidermal compartments, defining cohesively connected cells in the same color as single clone (Figures 2A and 2B). Initial labeling, 4 days after induction, revealed single- or two-cell clones in the basal layer of the IFE, isthmus, SG, and the inner bulge (Figure 2A). Notably, initial labeling in the bulge was restricted to the inner layer, where cells have been shown to be post-mitotic (Hsu et al., 2011). Thus, when using the R26R-Confetti reporter, we assume that all expanding Lgr6+-derived clones originated either from the isthmus, SG, or IFE basal layer. Untreated Lgr6-EGFP-Ires-CreERT2/R26R-Confetti mice did not show any clone development at 1 year of age (Figure S2A). Moreover, tamoxifen treatment induced a delay in anagen entry of at least 10 days (Figure S2B), and at all time points, PSUs in telogen were analyzed. Following the tracing pattern over different time periods, up to 1 year, revealed that Lgr6+-traced cells were present in the IFE, the isthmus including the junctional zone, the SG, and the bulge, whereas the infundibulum was very rarely labeled (Figure 2C). We frequently detected clones in the isthmus, SG and IFE, respectively, without any connection to another compartment (Figure 2A; 40-days PSU [yellow SG, green isthmus]), implying that all three compartments contain their own resident Lgr6+ stem or progenitor cells. However, this observation does not exclude that an Lgr6+ population, while maintaining itself, also contributes to another Lgr6+ compartment. We thus sought to investigate the clonal relationship between the different Lgr6+ populations next.
Figure 2.

Short- and Long-Term Contribution of Lgr6-EGFP-Ires-CreERT2/R26R-Confetti Traced Clones during Homeostasis
(A) Illustrative images for lineage tracing in skin of Lgr6-EGFP-Ires-CreERT2/R26R-Confetti mice induced at P3w and traced for 4 or 40 days. Confocal z-stack projections of flat-mount preparations show the IFE and its underlying PSUs. Lgr6+ clones are labeled with Confetti colors in nuclear green, cytoplasmic yellow, cytoplasmic red, and membranous blue; Lgr6-EGFP expression is cytoplasmic green, and TO-PRO-3 nuclear stain is gray. Hair shafts show autofluorescence in the blue channel. Initial labeling is present in the basal cells of the IFE (arrowheads), isthmus (asterisks), SG (white arrows), and inner bulge (blue arrows). Scale bars represent 50 μm.
(B) Illustration of the epidermal compartments. Confetti-labeled cells were assigned to the respective compartments according to this scheme.
(C) Quantification of Confetti-labeled cell distributions in the PSU after different tracing periods. Notably, cells in the infundibulum were rarely labeled (arrow). The labeled cells in each compartment are given as the percentage of total labeled cells at each time point. In total, 1,308 clones containing 5,082 labeled cells in 1,325 PSUs were analyzed (n = 3 mice per time point). Data are shown as mean ± SD.
(D) Illustration of the assignment of IFE clones, used in (E). First, a random IFE clone was picked, and then all surrounding PSUs were scanned for clones. Three different clone categories were defined: correlated (with PSU clone of the same color), non-correlated (with PSU clone of a different color), or alone (no labeled PSU in the vicinity).
(E) Confetti clone color correlation between IFE and PSU clones. The continuous lines represent the expected percentages for each clone category at given labeling efficiencies (derived via simulation) assuming that IFE and the PSU are independent. Note that the correlated IFE clone category increases steadily with increasing labeling efficiency (x axis). The experimentally determined values (observed) for IFE clone categories were plotted for each individual mouse (M1–M6, values on the y axis add up to 100% for each mouse, see dashed lines). In total, 186 IFE clones and 875 PSUs were analyzed in six mice.
Isthmus, SG, and IFE Harbor Resident Self-Renewing Lgr6+ Populations
It has been shown that cells originating in the HF bulge area can contribute to the infundibulum and the IFE when challenged with a wound environment (Brownell et al., 2011, Ito et al., 2005, Kasper et al., 2011, Levy et al., 2005). Investigating Lgr6PSU-derived clones in closing wounds (5-days post-wounding) and healed scar areas (≥36 days post-wounding) demonstrated that Lgr6PSU progeny also leave a Confetti-trace in the infundibulum when recruited to the IFE (Figures S2C and S2D). Importantly, the absence of such a tracing pattern in healthy skin strongly argues against a continuous flux of Lgr6PSU-derived cells to the IFE.
To rule out that Confetti-labeled Lgr6PSU cells migrate to the IFE during tissue homeostasis without leaving a Confetti-trace in the infundibulum, we studied the color correlation between IFE and PSU clones. In 3D confocal microscopy scans of flat-mount preparations (imaging from the top of the IFE down to the PSU), IFE clones (traced for 40 days up to 1 year) were compared with clones in the PSUs located around an IFE clone in an ∼175-μm radius (Figure 2D). IFE clones were then categorized as “correlated” (with PSU clone of the same color in the vicinity), “non-correlated” (with PSU clone of a different color in the vicinity), or “alone” (no labeled PSU in the vicinity) (Figure 2D). If IFE clones were derived from PSU cells, all IFE clones should have a color-matched clone in one of their surrounding PSUs. However, even if IFE clones are independent from PSU clones, it is expected that some color-matched clones will appear by chance due to the color limitation. These expected frequencies are dependent on the labeling efficiency and the actual occurrence of Confetti-clone colors in IFE and PSU, which vary between individual mice. Thus, we used a simulation strategy (see Supplemental Experimental Procedures) to determine the expected frequencies of correlated, non-correlated, and alone clones under the assumption that there is no cellular exchange between the IFE and the PSU. We then compared observed and expected frequencies and found that, irrespective of labeling efficiency, the observed frequencies matched the expected correlations for independent clones within 2 SDs (Figure 2E; Table S1). This color correlation analysis indicates that the IFE and the PSU clones are independent, which was further confirmed through an alternative resampling strategy estimating the expected color correlations within each mouse independently (Figure S2E; Supplemental Experimental Procedures). In summary, Lgr6PSU cells do not contribute to Lgr6+-derived clones in the IFE, demonstrating that the IFE harbors a long-term self-renewing Lgr6+ population.
To investigate the clonal relationship between the Lgr6IST and Lgr6SG populations, we compared all SG clones, traced for 40 days up to 1 year, to clones in the isthmus of the respective PSUs (Figures S2F and S2G). SG clones were then categorized as correlated (isthmus clone of the same color), non-correlated (isthmus clone of a different color), or alone (no clone in the isthmus) (Figure S2G). After applying the same resampling strategy as for the IFE, the results suggest that the Lgr6SG and Lgr6IST populations are maintained independently. However, a minor cellular exchange between the isthmus and SG may not be ruled out (Figure S2F).
Lgr6IFE, Lgr6IST, and Lgr6SG Clone Dynamics Show the Hallmarks of Neutral Competition
Since Lgr6IFE, Lgr6IST, and Lgr6SG populations all exhibited long-term clone survival, we wanted to assess the mode of stem cell renewal within the three epidermal compartments. In homeostasis, modes of stem cell self-renewal can be grouped into two classes of model: invariant asymmetry (in which each and every stem cell division results in strictly asymmetric fate outcome) and population asymmetry (where stochastic stem cell loss through differentiation is perfectly compensated by stem cell duplication) (Simons and Clevers, 2011). In contrast to invariant asymmetry, where clone number and size are predicted to remain approximately constant over time, tissues maintained by population asymmetry are characterized by an increase in average clone size while their number steadily diminishes so that the overall size of the labeled population remains constant. Furthermore, within this dynamics, the clone size distribution is predicted to acquire a hallmark scaling behavior, in which the chance of finding a clone with a size some multiple of the average remains constant (Klein and Simons, 2011).
Based on this characterization, we analyzed the Confetti-clone frequency and clone size of IFE clones, isthmus clones, and SG clones after different tracing times starting at P3w (Figures 3 and S3; allocation of clones is described in Supplemental Experimental Procedures). The numbers of analyzed mice for each time point, including counted clones and the total number of labeled cells, are listed in Table S2. Significantly, in all skin compartments, the overall clone frequency still increased from 4 to 9 days of tracing, with the highest fold change seen in the IFE (Figures 3A–3C, left). This delay in clone emergence may be due to prolonged tamoxifen/Cre activity on the R26R-Confetti construct or a slow accumulation of reporter protein levels (expression of membranous CFP and nuclear GFP was delayed beyond day 4; see Table S2).
Figure 3.

Lgr6-EGFP-Ires-CreERT2/R26R-Confetti Clone Dynamics in the IFE, Isthmus, and SG
Lgr6-EGFP-Ires-CreERT2/R26R-Confetti tracing was induced in telogen at P3w, and clone frequency, size, and the number of labeled cells were counted in the IFE, isthmus, and SG over time.
(A–C) Observed clone data are shown as mean ± SD of three mice, and the orange lines show the best fit according to the neutral competition model. (A) Average number of IFE clones per mm2, average clone size of basal cells, and average number of labeled basal cells per mm2 IFE for the respective time points. (B) Average number of isthmus clones per PSU, average clone size, and average number of labeled cells per PSU for the respective time points. (C) Average number of SG clones per PSU, average clone size, and average number of labeled SG cells per PSU for the respective time points.
(D) Scaling behavior of Lgr6+-derived IFE, isthmus, and SG clones represented by the cumulative clone size distribution. For each time point, clone sizes from three mice were pooled and divided by the average clone size of the respective time point. Theory predicts that if stem cell self-renewal follows from population asymmetry the probability of finding a surviving clone with n/(average n(t)) cells remains constant over time. Black line denotes the scaling curve F(x) = e−x.
Following IFE clone development from 9 days onward revealed a steady decline in clone number combined with an increase in average clone size so that the overall number of labeled cells stayed approximately constant (Figures 3A and S3A). This clone fate behavior in dorsal skin matches that described for tail, ear, and paw IFE (Clayton et al., 2007, Doupé et al., 2010, Lim et al., 2013) and is suggestive of population asymmetry. Further, the convergence of the Lgr6IFE-derived clone size distribution onto an exponential scaling behavior, as predicted by committed progenitor cell dynamics, shows that tissue maintenance follows from neutral competition (Figures 3D, S3B, and S3C) (Clayton et al., 2007). Although the clone size dependence is consistent with a single progenitor cell population, the contribution of a second minority slow-cycling stem cell population cannot be ruled out.
Evaluating the dynamics of Lgr6IST-derived clones revealed a similar clone fate behavior as in the IFE, with the clone size converging onto an exponential scaling form and an approximately similar average growth rate (Figures 3B, 3D, S3B, and S3C). Analyses of Lgr6SG-derived clones show comparable clone fates, with a decreasing clone number and an increasing clone size and exponential scaling behavior (Figures 3C, 3D, S3B, and S3C). The fact that both Lgr6IST and Lgr6SG clone dynamics conform to the predictions of the committed progenitor model again denotes that a potential cellular exchange between isthmus and SG must be small enough not to affect the clone size distribution.
In summary, the clonal fate data from the IFE, isthmus, and SG suggest population asymmetry as the mode of stem cell renewal in all three compartments.
Lgr6+ Keratinocytes of the IFE and PSU Do Not Share a Common Gene Expression Signature
Finally, we asked whether Lgr6IFE and Lgr6PSU cells share a certain transcriptional signature that is unique to Lgr6-expressing cells. We isolated Lgr6+ and Lgr6− keratinocytes from the SCA-1+ and the SCA-1− fraction using live-cell sorting (Figure S4A) and performed mRNA sequencing (RNA-seq) analysis of the sorted keratinocyte populations. The purity and the correct identity of the populations were validated based on read counts and real-time PCR (Figures S4B–S4D). A comparison of the global expression profiles using Pearson correlation (Figure S4E) and principal component analysis (PCA) (Figure 4A) revealed that the Lgr6+ populations do not show a high degree of similarity to each other. Moreover, we did not find significant differentially regulated genes when comparing all EGFPhi populations to the EGFP− populations. Hierarchical clustering based on the most differentially expressed genes between the two EGFPhi populations revealed that EGFPhi/SCA-1+ cells display a clear IFE identity while EGFPhi/SCA-1− cells present a signature more similar to their neighboring HF and SG cells (Figures 4B and S4F). This indicates that the transcription profile of Lgr6+ cells is markedly influenced by the local environment.
Figure 4.

Gene Expression Profiles of Lgr6IFE and Lgr6PSU Cell Populations
(A) Two-dimensional principle component analysis (PCA) of sorted cell populations based on the 500 genes with the highest variance demonstrates a clear separation between SCA-1+ (IFE/infundibulum) and SCA-1− (PSU) cells. Three independent sortings were performed.
See Figure S4A for detailed illustration of the location and the gating strategy used for each cell population.
(B) Heatmap of the most differentially expressed genes between EGFPhi/SCA-1+ and EGFPhi/SCA-1− cells, including hierarchical clustering of all sorted cell populations (biological replicates indicated by digits), illustrating the distinct PSU and IFE signatures.
(C) Functional annotation analysis of genes significantly upregulated or downregulated in EGFPhi cells compared with EGFP− cells in the SCA-1− fraction. Functional groups, genes, and their fold changes are shown (Inf: no reads were counted in the reference population).
(D) Real-time PCR analysis of selected upregulated or downregulated genes in EGFPhi cells compared with EGFP− cells in the SCA-1− fraction. Data are shown as mean of two or more biological replicates ± SD.
(E) Co-staining in telogen skin of Lgr6-EGFP-Ires-CreERT2 mice with anti-EGFP (green), anti-CST6 (red), and TO-PRO-3 nuclear stain shows co-localization of Lgr6-EGFP and CST6 expression in the lower isthmus (n = 3 mice).
(F) Defb6 mRNA detected by single-molecule RNA ISH, and presented as confocal z-stack projection image. Insets are magnifications of isthmus and infundibulum. Asterisk marks SG devoid of Defb6 (n = 3 mice).
(G) Co-staining in telogen skin of Lgr6-EGFP-Ires-CreERT2/Gli1-LacZ mice with anti-EGFP (red), anti-BGAL (green), and DAPI nuclear stain shows a partial overlap of the Lgr6+ and Gli1+ populations in the lower isthmus (arrows). Arrowheads indicate BGAL-expression in Gli1+ cells in the surrounding stroma. Asterisk marks unspecific fluorescence of the hair shaft (n = 3 mice).
Scale bars represent 25 μm (E–G). See also Figure S4.
Transcriptional Comparison between Lgr6+ and Lgr6− Cells within the PSU
PCA indicated that Lgr6PSU and Lgr6− PSU cells have distinct characteristics (see Figure 4A). The most pronounced difference of Lgr6PSU cells compared with Lgr6− PSU cells was the upregulation of a gene cluster related to cell division (Figure 4C), which is in line with the cell-cycle analysis (Figure 1F). Since LGR6 is implicated as an R-spondin receptor and thus a potential modulator of the Wnt pathway (de Lau et al., 2011), we had a closer look at the expression of Wnt signaling-related genes and found several Wnt-pathway associated genes such as Wnt6, Fzd1, Sox4, Tcf7l2 upregulated in Lgr6PSU cells (Figures 4C and 4D). Interestingly, several genes associated with nerve fiber development, and axon morphogenesis were upregulated in Lgr6PSU cells, such as Alcam, Sema3e, Ntf3, and Nrp1 (Figures 4C and 4D), which suggest an interaction of Lgr6+ cells with nerve fibers, as recently denoted (Liao and Nguyen, 2014). The most prominently downregulated genes in Lgr6PSU cells were associated with cytokine receptors (Tnfrsf19 and Cxcl12) and negative regulation of BMP signaling (Sostdc1 and Htra1) (Figures 4C and 4D). Since the Lgr6PSU likely contains a mixture of Lgr6IST and Lgr6SG, also SG-associated genes such as Scd1 were found to be upregulated (Figure 4C). However, many genes that were highly enriched in Lgr6PSU cells have previously been mapped to the isthmus, like parathyroid hormone-related protein (Pthlh) (Cho et al., 2003), neurotrophin-3 (Ntf3) (Botchkarev et al., 1998), Cd44 (Jensen et al., 2008), and CST6 (Veniaminova et al., 2013). For validation, we stained P3w telogen skin for CST6, Defb6, and beta-galactosidase (under the control of the Gli1 promoter; Brownell et al., 2011) (Figures 4E–4G). CST6 was found to be co-localized with Lgr6-EGFP in the lower part of the isthmus (Figure 4E). Defb6 expression was detected by mRNA in situ hybridization (ISH) in the isthmus (including the junctional zone), highlighting a potential role of the isthmus for immune regulation in the PSU (Figure 4F). Finally, using Lgr6-EGFP-Ires-CreERT2/Gli1-LacZ mice, we detected a partial overlap of the Lgr6+ and Gli1+ populations in the lower isthmus closest to the bulge (Figure 4G), as has been speculated previously (Kretzschmar and Watt, 2014). In summary, we could not detect a significant set of genes that is generally co-expressed with Lgr6; however, we could highlight genes that are differentially expressed in the Lgr6PSU when compared with the rest of the basal PSU cells.
Discussion
Combining multicolor lineage tracing in intact tissue with confocal microscopy, we were able to trace Lgr6+ epidermal progenitor cells within the native 3D environment. We found that Lgr6IFE cells give rise to long-term IFE clones without contribution from Lgr6PSU cells. This is in line with previous work, supporting a PSU-independent maintenance of the IFE during homeostasis (Ghazizadeh and Taichman, 2001, Ito et al., 2005, Levy et al., 2005, Nowak et al., 2008, Page et al., 2013). Moreover, we sporadically observed monoclonal conversion in the three compartments harboring resident Lgr6+ progenitor cells and found further evidence for their independence using simulation of the Confetti-color correlation, which supports the notion of a compartmentalized epidermis (Schepeler et al., 2014).
The clonal dynamics of Lgr6IFE progeny in dorsal skin matched those of prior experiments performed in tail, ear, and paw epidermis, indicating that population asymmetry is the underlying mode of tissue renewal (Clayton et al., 2007, Doupé et al., 2010, Lim et al., 2013, Mascré et al., 2012). In contrast to previous studies where the genetic labeling system targeted all IFE basal progenitors, albeit with variable efficiency, the Lgr6-EGFP-Ires-CreERT2 system targets only a subset of basal cells that display similar proliferation rates at the population level as the Lgr6− IFE cells. Based on Lgr6+ clone dynamics, we provide evidence that in three distinct compartments, formed by a continuous epithelial basal layer, tissue renewal follows from neutral competition regardless of specific differentiation programs (e.g., stratified epithelium or mature sebocytes). At 14 weeks of tracing, we observed a consistent outlier behavior across all compartments, where the average clone size was lower than expected. This is interesting because it could reflect an ongoing tissue expansion during the postnatal development (visible due to labeling induction before adulthood), where a first wave of cellular overproduction is followed by a degree of uncompensated loss after postnatal development. However, this should not impact the qualitative conclusions drawn about Lgr6+ progenitor cell dynamics (Clayton et al., 2007).
When analyzing Lgr6-EGFP expression, we detected an increase of Lgr6IFE cells during postnatal development, which raises key questions for future studies. For example, such a significant increase could be achieved by selective expansion of an Lgr6+ population, which remains Lgr6+ and grows (clonal dominance), or by expansion of a niche that drives Lgr6 expression. The clonal data do not suggest that clonal dominance leads to this increase, favoring the possibility that Lgr6 expression is influenced by extrinsic factors that are established for example during adolescence. As reported previously, cutaneous nerve fibers may supply signals defining the Lgr6 expression pattern (Liao and Nguyen, 2014). Supporting this notion, we found genes related to neural development specifically expressed in Lgr6PSU cells, where increased expression of Efnb2 and Sema3e, and downregulation of Cxcl12, suggest a potential role of Lgr6+ cells in active axon repulsion (Guan and Rao, 2003). Nerve signals, however, may not explain Lgr6 expression in the extending anagen HF, inner bulge, and SG. Increased Lgr6 expression upon anagen entry was recently shown to be governed by beta-catenin (Lien et al., 2014), and we confirmed Lgr6-EGFP upregulation in the hair germ during anagen entry in Lgr6-EGFP-Ires-CreERT2 mice. Yet, canonical Wnt signaling is unlikely to regulate Lgr6 expression in the SG as beta-catenin signaling suppresses the SG phenotype (Silva-Vargas et al., 2005), and expression of dominant-negative LEF1 protein leads to upregulation of Lgr6 along with other SG progenitor markers (Petersson et al., 2011). Thus, the regulation of Lgr6 transcription seems rather complex and further work is needed to uncover all influential signals and pathways.
In summary, the presence of Lgr6+ cells in multiple skin compartments offered the unique possibility to simultaneously follow the fates and dynamics of epidermal progenitors influenced by distinct cell-intrinsic and environmental cues. Our results support that healthy tissue is renewed in a compartmentalized fashion and highlight the robustness of stochastic stem cell renewal to varying microenvironments.
Experimental Procedures
Mice
All animal experiments were performed in accordance with the Swedish legislation and were approved by the Stockholm South Animal Ethics Committee. The used knockin strains Lgr6-EGFP-Ires-CreERT2 (Snippert et al., 2010a), R26R-Confetti (Snippert et al., 2010b), and Gli1-LacZ (Bai et al., 2002) were described previously and kept on a C57BL/6 background. For lineage tracing, Lgr6-EGFP-Ires-CreERT2/R26R-Confetti mice aged 3 weeks (P3w) were treated topically with 1.5-mg 4-hydroxytamoxifen (Sigma) in 100-μl acetone on the dorsal skin. Biopsies were taken 4 days later (P25) to analyze the initial labeling and observe the contribution to wound closure at the biopsied sites. The tracing pattern was analyzed after 4, 9, 40, 100, and 150 days, and 1 year. To mark replicating cells, 0.1-mg/g BrdU was injected intraperitoneally 2 hr before mice were sacrificed.
Sample Preparation and Microscopy for Confetti Clone Detection
Dorsal hair was removed with hair removal cream (Veet), and skin pieces ∼1–2 cm2 were fixed in 4% paraformaldehyde (PFA) for 20 min. Subcutaneous fat was removed with a scalpel, and small skin pieces (∼10–20 mm2) were stained with TO-PRO-3 (Invitrogen) in PBS overnight. The skin was mounted flat on a cover glass and overlaid with Pro-Long Gold mounting medium (Invitrogen). Confocal imaging is described in detail in Supplemental Experimental Procedures. To detect Confetti IFE and PSU labels in the same area, z-stack images spanning the depth of the PSU were recorded with a confocal plane distance of 4 μm. Projections of z-stack planes were generated using ImageJ.
Confetti Clone Definition and Color Correlation
Single Confetti clones were defined as coherent labels of the same color. For clone color correlation of the IFE, all PSUs within a radius of 150–200 μm were evaluated, and for SGs, the respective isthmus of the same PSU was analyzed. Detailed descriptions of clone categorization as well as the simulation and resampling strategies are provided in Supplemental Experimental Procedures. For determining the clone dynamics, we counted the number of basal cells per IFE clone and measured the area of IFE clones in z projections. In the isthmus and SG, the total number of cells per clone was quantified. The expected curves for the clone frequency were modeled to the best fit, based on the formulas given in (Klein and Simons, 2011). The first data point is shown but was excluded from the calculations since not all labels had been revealed.
Immunofluorescence Staining and RNA ISH
For immunofluorescence (IF), the following primary antibodies were used: rabbit anti-EGFP (Invitrogen/A-11122, 1:500), rat anti-BrdU (Serotec/OBT0030G, 1:400), rabbit anti-CST6 (Aviva Systems Biology/ARP53533_P050, 1:100), and chicken anti-β-galactosidase (Abcam/ab9361, 1:400). ISH was performed using an RNAscope Fluorescent Multiplex Kit (Advanced Cell Diagnostics) according to the manufacturer’s instructions. IF was performed on PFA-fixed horizontal whole-mount dorsal skin preparations and ISH on PFA-fixed paraffin-embedded dorsal skin sections (Supplemental Experimental Procedures).
Keratinocyte Isolation and FACS Analysis
Keratinocytes were isolated from P3w mice as described previously, pooling cells from two to three mice per experiment (Jaks et al., 2008). Cells were stained with AlexaFluor647-conjugated anti-CD49f (integrin alpha 6; 1:20) and PE-Cy7-conjugated anti-SCA-1 (1:15) antibodies (both BD Biosciences). For negative control, cells were stained with the respective isotype control antibodies (AlexaFluor647 Rat IgG2a, and PE-Cy7 Rat IgG2a, BD Biosciences). Staining with 7-AAD (BD biosciences) was used to exclude dead cells. To measure the cell cycle, cells were treated with verapamil (Sigma; 100 mM final concentration) for 15 min at 37°C before Vybrant DyeCycle Violet Stain (Molecular Probes) was added (5 μM final concentration), and cells were incubated for another 30 min. Cells were analyzed on a BD LSRFortessa. FACS data were analyzed using FlowJo software (Tree Star).
Cell Sorting and RNA Isolation
Keratinocytes stained for CD49f, SCA-1, and 7-AAD were sorted using a FACSAria III (BD). Lgr6IFE cells were defined as the CD49fhigh, SCA-1high, and EGFPhigh fraction, and Lgr6PSU cells as the CD49fhigh+dim, SCA-1−, and EGFPhigh fraction (Jensen et al., 2008). We also collected the respective Lgr6− PSU (CD49fhigh, SCA-1−, and EGFP−), Lgr6− IFE/infundibulum (CD49fhigh, SCA-1high, and EGFP−) and “all” (containing a mix of all four) basal populations. One hundred thousand cells were collected for each population. RNA was isolated from sorted keratinocytes by combining the RNA-containing aqueous phase extract using RNA-Bee (Amsbio) with the RNAaqueous-Micro Kit (Ambion). RNA integrity was measured using an Agilent 2100 Bioanalyzer Pico Chip or a 2200 TapeStation High Sensitivity R6K Screen Tape. The RNA integrity number of all samples was higher than 8.5.
RNA Sequencing and Real-Time PCR
RNA samples from three independent sortings (S1, S2, S3) were analyzed by RNA sequencing. The procedure was performed according to the STRT4 protocol (Islam et al., 2012), starting with 1 ng total RNA per sample in duplicates. Sequence data were pre-processed using the pipeline established in the Linnarsson lab (Islam et al., 2012). Briefly, reads were aligned to mouse genome (mm10 assembly), maintaining only uniquely aligned reads. Reads falling into annotated Refseq gene regions were summed into a raw read count matrix (Islam et al., 2012). We identified differentially expressed genes using DESeq (Anders and Huber, 2010) and SAMseq (Li and Tibshirani, 2013), with standard parameters in R/Bioconductor environment. In Figure 4B, we displayed differentially expressed genes with a DESeq adjusted p value below 0.1 and a fold change above 2. Functional analyses defining Gene Ontology (GO) category clusters of significant genes were performed with the DAVID online tool.
To validate RNA-seq results, real-time PCR was performed on the same RNA samples used for sequencing after pre-amplification of the cDNA with gene-specific, nested primers. The raw CT values were normalized to the mean of Hprt1 and Rplp0. Detailed description is provided in Supplemental Experimental Procedures, and primer sequences and PCR conditions are given in Tables S3 and S4.
Author Contributions
A.F., R.T., and M.K. conceived the study. A.F. and M.K. designed the experiments. A.F., A.A., S.J., T.J., and U.S. performed experiments. S.L. provided sequencing platform. A.F., S.J., U.S., and B.D.S. analyzed the data. A.H. and H.C. generated and provided mouse strains. A.F. and M.K. wrote the manuscript with critical input from all authors.
Acknowledgments
We thank Åsa Bergström for technical help and assistance with mouse strains, Viljar Jaks for his help with FACS analysis, and Anna Johnsson and Peter Lönnerberg for conducting RNA-seq. This work was supported by grants from the Swedish Cancer Society, Swedish Research Council, H&G Jeanssons Foundation, Swedish Foundation for Strategic Research and Ragnar Söderberg Foundation (to M.K.), the Swedish Cancer Society, Swedish Research Council (to R.T.), the European Molecular Biology Organization (to A.H.), the Swedish Research Council (STARGET to M.K. and S.L.), and the Wellcome Trust (grant number 098357/Z/12/Z to B.D.S.). A.F. was supported by the EU FP7 ITN Healing Network. Parts of this study were performed at the (1) Live Cell Imaging unit, Department of Biosciences and Nutrition, Karolinska Institutet, Sweden, supported by grants from the Knut and Alice Wallenberg Foundation, the Swedish Research Council, the Center for Innovative Medicine and the Jonasson donation to the School of Technology and Health, Royal Institute of Technology, Sweden, and (2) Wallenberg Institute for Regenerative Medicine Flow Cytometry Facility financed by Knut and Alice Wallenberg Foundation, Karolinska Institutet, Huddinge, Sweden.
Published: October 22, 2015
Footnotes
This is an open access article under the CC BY-NC-ND license (http://creativecommons.org/licenses/by-nc-nd/4.0/).
Supplemental Information includes Supplemental Experimental Procedures, four figures, and four tables and can be found with this article online at http://dx.doi.org/10.1016/j.stemcr.2015.09.013.
Accession Numbers
The accession number for the RNA-sequencing data reported in this paper is ArrayExpress: E-MTAB-3533.
Supplemental Information
References
- Anders S., Huber W. Differential expression analysis for sequence count data. Genome Biol. 2010;11:R106. doi: 10.1186/gb-2010-11-10-r106. [DOI] [PMC free article] [PubMed] [Google Scholar]
- Bai C.B., Auerbach W., Lee J.S., Stephen D., Joyner A.L. Gli2, but not Gli1, is required for initial Shh signaling and ectopic activation of the Shh pathway. Development. 2002;129:4753–4761. doi: 10.1242/dev.129.20.4753. [DOI] [PubMed] [Google Scholar]
- Blanpain C., Fuchs E. Epidermal homeostasis: a balancing act of stem cells in the skin. Nat. Rev. Mol. Cell Biol. 2009;10:207–217. doi: 10.1038/nrm2636. [DOI] [PMC free article] [PubMed] [Google Scholar]
- Blanpain C., Fuchs E. Stem cell plasticity. Plasticity of epithelial stem cells in tissue regeneration. Science. 2014;344:1242281. doi: 10.1126/science.1242281. [DOI] [PMC free article] [PubMed] [Google Scholar]
- Botchkarev V.A., Welker P., Albers K.M., Botchkareva N.V., Metz M., Lewin G.R., Bulfone-Paus S., Peters E.M., Lindner G., Paus R. A new role for neurotrophin-3: involvement in the regulation of hair follicle regression (catagen) Am. J. Pathol. 1998;153:785–799. doi: 10.1016/S0002-9440(10)65621-0. [DOI] [PMC free article] [PubMed] [Google Scholar]
- Brownell I., Guevara E., Bai C.B., Loomis C.A., Joyner A.L. Nerve-derived sonic hedgehog defines a niche for hair follicle stem cells capable of becoming epidermal stem cells. Cell Stem Cell. 2011;8:552–565. doi: 10.1016/j.stem.2011.02.021. [DOI] [PMC free article] [PubMed] [Google Scholar]
- Cho Y.M., Woodard G.L., Dunbar M., Gocken T., Jimènez J.A., Foley J. Hair-cycle-dependent expression of parathyroid hormone-related protein and its type I receptor: evidence for regulation at the anagen to catagen transition. J. Invest. Dermatol. 2003;120:715–727. doi: 10.1046/j.1523-1747.2003.12147.x. [DOI] [PubMed] [Google Scholar]
- Clayton E., Doupé D.P., Klein A.M., Winton D.J., Simons B.D., Jones P.H. A single type of progenitor cell maintains normal epidermis. Nature. 2007;446:185–189. doi: 10.1038/nature05574. [DOI] [PubMed] [Google Scholar]
- de Lau W., Barker N., Low T.Y., Koo B.K., Li V.S., Teunissen H., Kujala P., Haegebarth A., Peters P.J., van de Wetering M. Lgr5 homologues associate with Wnt receptors and mediate R-spondin signalling. Nature. 2011;476:293–297. doi: 10.1038/nature10337. [DOI] [PubMed] [Google Scholar]
- Doupé D.P., Jones P.H. Interfollicular epidermal homeostasis: dicing with differentiation. Exp. Dermatol. 2012;21:249–253. doi: 10.1111/j.1600-0625.2012.01447.x. [DOI] [PubMed] [Google Scholar]
- Doupé D.P., Klein A.M., Simons B.D., Jones P.H. The ordered architecture of murine ear epidermis is maintained by progenitor cells with random fate. Dev. Cell. 2010;18:317–323. doi: 10.1016/j.devcel.2009.12.016. [DOI] [PubMed] [Google Scholar]
- Doupé D.P., Alcolea M.P., Roshan A., Zhang G., Klein A.M., Simons B.D., Jones P.H. A single progenitor population switches behavior to maintain and repair esophageal epithelium. Science. 2012;337:1091–1093. doi: 10.1126/science.1218835. [DOI] [PMC free article] [PubMed] [Google Scholar]
- Ghazizadeh S., Taichman L.B. Multiple classes of stem cells in cutaneous epithelium: a lineage analysis of adult mouse skin. EMBO J. 2001;20:1215–1222. doi: 10.1093/emboj/20.6.1215. [DOI] [PMC free article] [PubMed] [Google Scholar]
- Greco V., Chen T., Rendl M., Schober M., Pasolli H.A., Stokes N., Dela Cruz-Racelis J., Fuchs E. A two-step mechanism for stem cell activation during hair regeneration. Cell Stem Cell. 2009;4:155–169. doi: 10.1016/j.stem.2008.12.009. [DOI] [PMC free article] [PubMed] [Google Scholar]
- Guan K.L., Rao Y. Signalling mechanisms mediating neuronal responses to guidance cues. Nat. Rev. Neurosci. 2003;4:941–956. doi: 10.1038/nrn1254. [DOI] [PubMed] [Google Scholar]
- Hsu Y.C., Pasolli H.A., Fuchs E. Dynamics between stem cells, niche, and progeny in the hair follicle. Cell. 2011;144:92–105. doi: 10.1016/j.cell.2010.11.049. [DOI] [PMC free article] [PubMed] [Google Scholar]
- Islam S., Kjällquist U., Moliner A., Zajac P., Fan J.B., Lönnerberg P., Linnarsson S. Highly multiplexed and strand-specific single-cell RNA 5′ end sequencing. Nat. Protoc. 2012;7:813–828. doi: 10.1038/nprot.2012.022. [DOI] [PubMed] [Google Scholar]
- Ito M., Liu Y., Yang Z., Nguyen J., Liang F., Morris R.J., Cotsarelis G. Stem cells in the hair follicle bulge contribute to wound repair but not to homeostasis of the epidermis. Nat. Med. 2005;11:1351–1354. doi: 10.1038/nm1328. [DOI] [PubMed] [Google Scholar]
- Jaks V., Barker N., Kasper M., van Es J.H., Snippert H.J., Clevers H., Toftgård R. Lgr5 marks cycling, yet long-lived, hair follicle stem cells. Nat. Genet. 2008;40:1291–1299. doi: 10.1038/ng.239. [DOI] [PubMed] [Google Scholar]
- Jaks V., Kasper M., Toftgård R. The hair follicle-a stem cell zoo. Exp. Cell Res. 2010;316:1422–1428. doi: 10.1016/j.yexcr.2010.03.014. [DOI] [PubMed] [Google Scholar]
- Jensen U.B., Yan X., Triel C., Woo S.H., Christensen R., Owens D.M. A distinct population of clonogenic and multipotent murine follicular keratinocytes residing in the upper isthmus. J. Cell Sci. 2008;121:609–617. doi: 10.1242/jcs.025502. [DOI] [PMC free article] [PubMed] [Google Scholar]
- Kasper M., Jaks V., Are A., Bergström Å., Schwäger A., Svärd J., Teglund S., Barker N., Toftgård R. Wounding enhances epidermal tumorigenesis by recruiting hair follicle keratinocytes. Proc. Natl. Acad. Sci. USA. 2011;108:4099–4104. doi: 10.1073/pnas.1014489108. [DOI] [PMC free article] [PubMed] [Google Scholar]
- Klein A.M., Simons B.D. Universal patterns of stem cell fate in cycling adult tissues. Development. 2011;138:3103–3111. doi: 10.1242/dev.060103. [DOI] [PubMed] [Google Scholar]
- Kretzschmar K., Watt F.M. Markers of epidermal stem cell subpopulations in adult mammalian skin. Cold Spring Harb. Perspect. Med. 2014;4:a013631. doi: 10.1101/cshperspect.a013631. [DOI] [PMC free article] [PubMed] [Google Scholar]
- Leushacke M., Ng A., Galle J., Loeffler M., Barker N. Lgr5(+) gastric stem cells divide symmetrically to effect epithelial homeostasis in the pylorus. Cell Rep. 2013;5:349–356. doi: 10.1016/j.celrep.2013.09.025. [DOI] [PubMed] [Google Scholar]
- Levy V., Lindon C., Harfe B.D., Morgan B.A. Distinct stem cell populations regenerate the follicle and interfollicular epidermis. Dev. Cell. 2005;9:855–861. doi: 10.1016/j.devcel.2005.11.003. [DOI] [PubMed] [Google Scholar]
- Li J., Tibshirani R. Finding consistent patterns: a nonparametric approach for identifying differential expression in RNA-Seq data. Stat. Methods Med. Res. 2013;22:519–536. doi: 10.1177/0962280211428386. [DOI] [PMC free article] [PubMed] [Google Scholar]
- Liao X.H., Nguyen H. Epidermal expression of Lgr6 is dependent on nerve endings and Schwann cells. Exp. Dermatol. 2014;23:195–198. doi: 10.1111/exd.12340. [DOI] [PMC free article] [PubMed] [Google Scholar]
- Lien W.H., Polak L., Lin M., Lay K., Zheng D., Fuchs E. In vivo transcriptional governance of hair follicle stem cells by canonical Wnt regulators. Nat. Cell Biol. 2014;16:179–190. doi: 10.1038/ncb2903. [DOI] [PMC free article] [PubMed] [Google Scholar]
- Lim X., Tan S.H., Koh W.L., Chau R.M., Yan K.S., Kuo C.J., van Amerongen R., Klein A.M., Nusse R. Interfollicular epidermal stem cells self-renew via autocrine Wnt signaling. Science. 2013;342:1226–1230. doi: 10.1126/science.1239730. [DOI] [PMC free article] [PubMed] [Google Scholar]
- Lopez-Garcia C., Klein A.M., Simons B.D., Winton D.J. Intestinal stem cell replacement follows a pattern of neutral drift. Science. 2010;330:822–825. doi: 10.1126/science.1196236. [DOI] [PubMed] [Google Scholar]
- Mascré G., Dekoninck S., Drogat B., Youssef K.K., Broheé S., Sotiropoulou P.A., Simons B.D., Blanpain C. Distinct contribution of stem and progenitor cells to epidermal maintenance. Nature. 2012;489:257–262. doi: 10.1038/nature11393. [DOI] [PubMed] [Google Scholar]
- Müller-Röver S., Handjiski B., van der Veen C., Eichmüller S., Foitzik K., McKay I.A., Stenn K.S., Paus R. A comprehensive guide for the accurate classification of murine hair follicles in distinct hair cycle stages. J. Invest. Dermatol. 2001;117:3–15. doi: 10.1046/j.0022-202x.2001.01377.x. [DOI] [PubMed] [Google Scholar]
- Nakagawa T., Nabeshima Y., Yoshida S. Functional identification of the actual and potential stem cell compartments in mouse spermatogenesis. Dev. Cell. 2007;12:195–206. doi: 10.1016/j.devcel.2007.01.002. [DOI] [PubMed] [Google Scholar]
- Nowak J.A., Polak L., Pasolli H.A., Fuchs E. Hair follicle stem cells are specified and function in early skin morphogenesis. Cell Stem Cell. 2008;3:33–43. doi: 10.1016/j.stem.2008.05.009. [DOI] [PMC free article] [PubMed] [Google Scholar]
- Page M.E., Lombard P., Ng F., Göttgens B., Jensen K.B. The epidermis comprises autonomous compartments maintained by distinct stem cell populations. Cell Stem Cell. 2013;13:471–482. doi: 10.1016/j.stem.2013.07.010. [DOI] [PMC free article] [PubMed] [Google Scholar]
- Petersson M., Brylka H., Kraus A., John S., Rappl G., Schettina P., Niemann C. TCF/Lef1 activity controls establishment of diverse stem and progenitor cell compartments in mouse epidermis. EMBO J. 2011;30:3004–3018. doi: 10.1038/emboj.2011.199. [DOI] [PMC free article] [PubMed] [Google Scholar]
- Rompolas P., Greco V. Stem cell dynamics in the hair follicle niche. Semin. Cell Dev. Biol. 2014;25-26:34–42. doi: 10.1016/j.semcdb.2013.12.005. [DOI] [PMC free article] [PubMed] [Google Scholar]
- Schepeler T., Page M.E., Jensen K.B. Heterogeneity and plasticity of epidermal stem cells. Development. 2014;141:2559–2567. doi: 10.1242/dev.104588. [DOI] [PMC free article] [PubMed] [Google Scholar]
- Silva-Vargas V., Lo Celso C., Giangreco A., Ofstad T., Prowse D.M., Braun K.M., Watt F.M. Beta-catenin and Hedgehog signal strength can specify number and location of hair follicles in adult epidermis without recruitment of bulge stem cells. Dev. Cell. 2005;9:121–131. doi: 10.1016/j.devcel.2005.04.013. [DOI] [PubMed] [Google Scholar]
- Simons B.D., Clevers H. Strategies for homeostatic stem cell self-renewal in adult tissues. Cell. 2011;145:851–862. doi: 10.1016/j.cell.2011.05.033. [DOI] [PubMed] [Google Scholar]
- Snippert H.J., Haegebarth A., Kasper M., Jaks V., van Es J.H., Barker N., van de Wetering M., van den Born M., Begthel H., Vries R.G. Lgr6 marks stem cells in the hair follicle that generate all cell lineages of the skin. Science. 2010;327:1385–1389. doi: 10.1126/science.1184733. [DOI] [PubMed] [Google Scholar]
- Snippert H.J., van der Flier L.G., Sato T., van Es J.H., van den Born M., Kroon-Veenboer C., Barker N., Klein A.M., van Rheenen J., Simons B.D., Clevers H. Intestinal crypt homeostasis results from neutral competition between symmetrically dividing Lgr5 stem cells. Cell. 2010;143:134–144. doi: 10.1016/j.cell.2010.09.016. [DOI] [PubMed] [Google Scholar]
- Veniaminova N.A., Vagnozzi A.N., Kopinke D., Do T.T., Murtaugh L.C., Maillard I., Dlugosz A.A., Reiter J.F., Wong S.Y. Keratin 79 identifies a novel population of migratory epithelial cells that initiates hair canal morphogenesis and regeneration. Development. 2013;140:4870–4880. doi: 10.1242/dev.101725. [DOI] [PMC free article] [PubMed] [Google Scholar]
- Watt F.M., Hogan B.L. Out of Eden: stem cells and their niches. Science. 2000;287:1427–1430. doi: 10.1126/science.287.5457.1427. [DOI] [PubMed] [Google Scholar]
Associated Data
This section collects any data citations, data availability statements, or supplementary materials included in this article.