Figure 4.
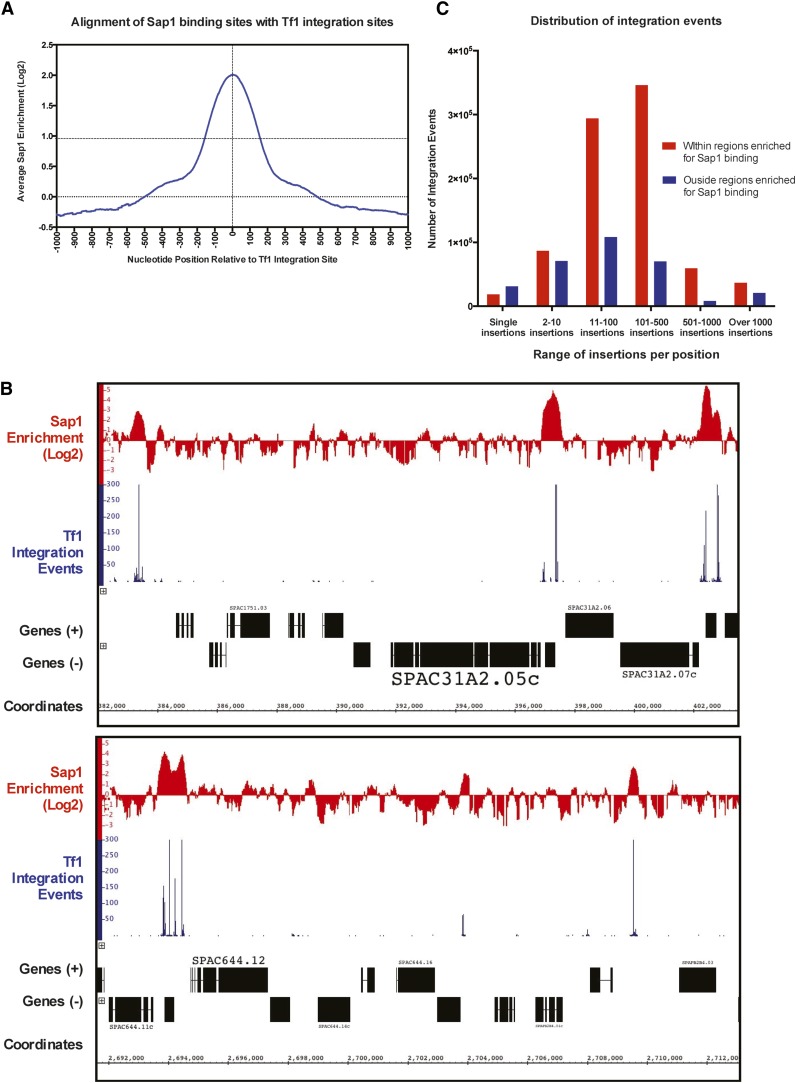
Tf1 prefers to integrate in Sap1-bound regions of the genome. (A) Graph showing the alignment of all genomic Tf1 insertion sites with the tabulated average of Sap1 enrichment (log2 ratio of Sap1 binding to WCE signal) at single-nucleotide positions within 1000 bp of the aligned insertion sites. (B) Representative regions of the genome showing that high integration sites align with regions of the genome enriched for Sap1 binding. (C) Graph showing the number of Tf1 insertions that occur within the indicated ranges of insertions per positions, as well as their occurrence in and outside Sap1-enriched regions in the genome.

