Abstract
In this work, O/W emulsion sets were prepared by using different concentrations of two nonionic surfactants. The two surfactants, tween 80(HLB=15.0) and span 80(HLB=4.3) were used in a fixed proportions equal to 0.55:0.45 respectively. HLB value of the surfactants blends were fixed at 10.185. The surfactants blend concentration is starting from 3% up to 19%. For each O/W emulsion set the conductivity was measured at room temperature (25±2°), 40, 50, 60, 70 and 80°. Applying the simple linear regression least squares method statistical analysis to the temperature-conductivity obtained data determines the effective surfactants blend concentration required for preparing the most stable O/W emulsion. These results were confirmed by applying the physical stability centrifugation testing and the phase inversion temperature range measurements. The results indicated that, the relation which represents the most stable O/W emulsion has the strongest direct linear relationship between temperature and conductivity. This relationship is linear up to 80°. This work proves that, the most stable O/W emulsion is determined via the determination of the maximum R² value by applying of the simple linear regression least squares method to the temperature–conductivity obtained data up to 80°, in addition to, the true maximum slope is represented by the equation which has the maximum R² value. Because the conditions would be changed in a more complex formulation, the method of the determination of the effective surfactants blend concentration was verified by applying it for more complex formulations of 2% O/W miconazole nitrate cream and the results indicate its reproducibility.
Keywords: ESBC, Emulsions, Nonionic, Linear regression, Coefficient of determination
The objective of this work is the assignment of a suitable reproducible procedure for the determination of the effective surfactants blend concentration (ESBC) required for preparing the most stable O/W emulsion stabilized by two nonionic surfactants in pharmaceuticals, cosmetics and other field of industries to reduce cost and to save time.
The hydrophilicity of nonionic surfactants changes with temperature, the emulsion inverts from O/W to W/O type when the temperature is slowly raised. The phase inversion temperature (PIT), at which the hydrophilic–lipophilic properties of the surfactant are in balance (also called HLB temperature), may be detected conduct metrically[1]. This property was used to determine PIT.
PIT is a valuable method for ranking the emulsions in order of relative stability, its general applicability for predicting long–term stability is limited when phase changes occur on heating. There is also a qualitative relationship between PIT and the degree of creaming and cracking of the emulsions on long-term storage at 20°, it is evident that the greater the inversion temperature the lower was the degree of separation of phases[2], in addition to, there is a linear relationship between emulsion stability and PIT of liquid paraffin-in-water emulsions stabilized by sorbitan derivatives. This relationship was linear up to PIT of 80°. Measurements above this temperature exhibited a deviation from linearity, apparently due to evaporation of water phase[3], so PIT was measured up to 80° only. PIT was used for ranking the tested O/W emulsions in order of relative stability as well as the physical stability centrifugation testing.
It is important to consider that the presence of certain hydrophilic or lipophilic surfactants, at amount in excess of the quantities required for optimum emulsification, can sometimes results in degradation of O/W emulsions[4] and also the stability measurements showed that the concentration of hydrophilic and lipophilic surfactant were very important parameter[5], in addition to, only nonionic polyethoxylated surfactants will allow to perform the emulsion inversion, but the affinities of the surfactant for the aqueous and oily bulk phases have to be relatively balanced, right from the start[6], so it is very important to adjust the concentration of surfactants right from the start which is the objective of this work.
MATERIALS AND METHODS
The following Instruments were used: RZR1 stirring paddle (Heidolph Instruments Gmbh and Co. KG, Germany); A Jenway model 4510 conductivity/TDS meter (UK); K centrifuge harmonic series (Taiwan); thermometer 150 (76 mm 1 mm, N2 filled GH, Zeal, Ltd, England); 100 ml and 600 ml glass-ware beakers grade A (Ilmabor TGI, Germany); burette (0.1/DIN/AS 50 ml, Germany); 100 ml vials of type 1 (Bormioli, Italy) with ready for sterilization rubber; MS-H-Pro digital hotplate magnetic stirrer (USA); PGW453e, 750.0 g, d=0.001 g ADAM balance (UK). All equipments were calibrated, approved and ready for use.
The following chemicals were used in formulation, miconazole nitrate (Jiangsu Nhwa Pharmaceutical Co. Ltd. China), paraffin oil (Apar industries Co. Ltd. India), soft paraffin (Jell Pharmaceuticals Pvt Co. Ltd. India) and beeswax (Cisme Co. Italy), Tween 80 and Span 80 (Kolb Co. Switzerland), propyl paraben base (Salycylates and Chemicals Co. Ltd. India) and methyl paraben base (Wuhu Huahai Biology Engineering Co. Ltd. China), sorbitol (Roquette Lestrem Co. France) and water for injection (Grand pharma for pharmaceutical industries Co. Egypt).
Emulsions composition:
Paraffin oil was used as oil phase, nonionic emulsifiers tween 80 and span 80 (Kolb Co. Switzerland) were used as surfactants blend with different proportions and their ratios were fixed at 5%[4,7,8,9], water for injection was used as water phase. Emulsions compositions, average of responses of conductivities at room temperature (25±2°) and type of emulsions were recorded in Table 1. These emulsion sets were used to determine the effective surfactants blend (ESB).
TABLE 1.
EMULSIONS COMPOSITIONS AND CONDUCTIVITY

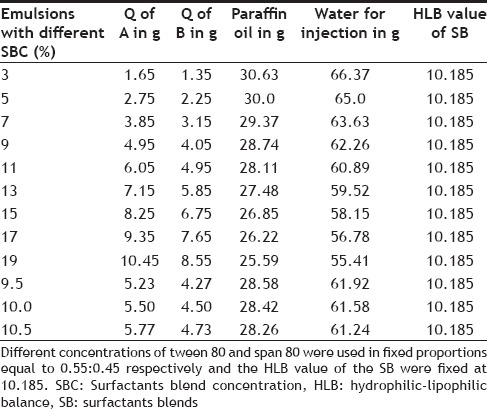
Other sets of O/W emulsions were prepared with different concentrations of the two nonionic surfactants. The two surfactants, tween 80 and span 80 were used in fixed proportions equal to 0.55:0.45 (HLB=10.185)respectively. The surfactants blend concentration (SBC) is starting from 3% to 19% with 2% increment
(as known that, the emulsion contains varying amounts of surfactants ranging from 2-15 or 1-20%)[4,5,6,7,8,9,10]. Since the prepared O/W emulsion sets with SBC starting from 11% to 19% have a physical gel consistency appearance, so another three additional O/W emulsion sets with 9.5%, 10% and 10.5% concentrations were prepared to indicate the concentration at which the gel consistency was actually appeared (in between the two concentrations of 9% and 11%). Emulsions compositions were recorded in Table 2. These O/W emulsion sets were used to determine the ESBC.
TABLE 2.
EMULSIONS COMPOSITION
The method of the determination of the ESBC was verified by applying it for more complex formulations of 2% O/W miconazole nitrate cream. These more complex formulations are composed of: 2% Miconazole nitrate was used as active ingredient, 16.5-18% Paraffin oil, 11.5-13% Soft paraffin and 5% beeswax were used as oil phase, 0.5-4.5% tween 80 and 0.5-4.5% span 80 were used as emulsifiers, 0.02% Propyl paraben base and 0.15% Methyl paraben base were used as preservatives, 5% Sorbitol and 50.83-53.83% water for injection were used as water phase. All materials are of pharmaceutical grade. These O/W emulsion sets were used to determine the ESB and ESBC of the more complex formulations of 2% O/W miconazole nitrate cream.
Preparation of emulsions:
The emulsions were prepared by the sudden phase inversion method. The water phase was heated to 80±2° and added portion wise to the oily phase containing both emulsifiers at 80±2° within 30 seconds, while stirring with RZR1 stirring paddle at speed of 664 rpm. The emulsion was mixed for 20 minute as a fixed time. Different emulsions were made in triplicate. All parameters were measured after 24 hours[4,6,7,8,9,10,11,12].
Centrifugation:
Emulsion was tested for physical stability by centrifugation using K centrifuge Harmonic series for 1 hour at speed of 3500 rpm and the emulsion was examined for any phase separation. Four centrifugation tubes were filled with 8.0 ml of emulsion and centrifuged at speed of 3500 rpm for 1 hour[5].
Conductivity and PIT range determination:
Conductivity and PIT ranges were determined by measuring the specific conductivity and temperature of 60 ml of emulsion that was continuously agitated at 100 rpm with small propeller stirrer. The emulsion was heated at a steady rate using MS-H-Pro digital hotplate magnetic stirrer. The specific conductivity of each O/W emulsion was measured directly, as it is, without dilution at room temperature (25±2), 40, 50, 60, 70 and 80°. A conductivity value lower than 10 uS/cm and essentially zero means that the continuous phase is oil, whereas the conductivity value higher than 10 uS/cm means that the continuous phase is water[6,13].
PITs range were detected as a fall of the specific conductivity between any two successive temperature values or they may be detected when two successive conductivity values are nearly equal (steady state of conductivity values). The results quoted are the means of three determinations[1,2,6,14].
RESULTS
Determination the ESB:
Nine sets of emulsions were prepared by using paraffin oil, water for injection and different blends of two nonionic surfactants, tween 80 (HLB=15.0)and span 80 (HLB=4.3). The two surfactants were used in different proportions and their ratios were fixed at 5% concentration.[4,7,8,9] This concentration does not prove the ESBC but it predicts the ESB. These surfactants blends have HLB values ranging from 5.370 to 13.930. We calculated the HLB value of the surfactants blend according to the formula:
HLB=x A+(1–x) B Eq. (1)
Where x is the proportion of a surfactant having an HLB value of A and the other surfactant has a value of B[15]. Since the HLB system predicts the optimum emulsion stability when matches the required HLB of the oil/water system[9] and as the RHLB oil/water system of paraffin-in-water emulsions stabilized by sorbitan derivatives is 10 as stated in the literature[7], so another additional emulsion set experiment 10 was prepared with surfactants blend of HLB value equal to 10.185 to verify the results. Tween 80 and span 80 with proportions 0.55:0.45 respectively have HLB value equals to 10.185. As in case of the determination of ESBC which will be discussed later in details. The maximum R2 value=0.981 of the relation which represents O/W emulsion of experiment 10 indicates that this relation has the strongest direct linear relationship between temperature and conductivity. So the O/W emulsion of experiment 10 is the most stable one of the tested emulsion sets (experiments 6, 7 and 10). Its surfactants blend with HLB value corresponding to 10.185 is the ESB (tween 80 and span 80 with proportions 0.55:0.45, respectively). The HLB value of the ESB is the RHLB value of the emulsion system. Average responses of conductivities at (25±2), 40, 50, 60, 70 and 80° were recorded in Table 3. The statistical analysis results were revealed in fig. 1. The above result was confirmed by subjecting all the O/W emulsion sets (experiments 6, 7 and 10) to physical stability centrifugation testing and by comparing the results of the PIT range measurements. The results were recorded in Table 4. The difference between the RHLB of paraffin-in-water emulsions stabilized by sorbitan derivatives in this work and the RHLB values in the literatures published by Prinderre et al.[7] and Lin TJ et al.[8] that equal to 10.0 and 10.5, respectively, may be due to the experimental errors.
TABLE 3.
CONDUCTIVITY AT DIFFERENT TEMPERATURES
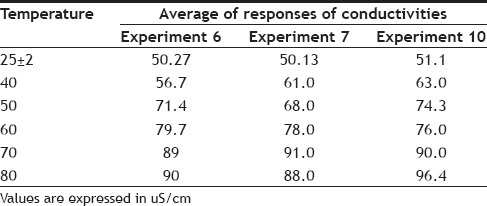
Fig. 1.
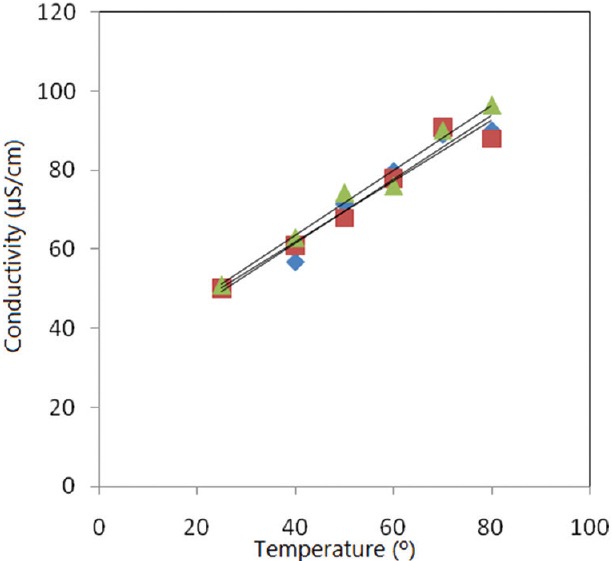
A relation between the temperatures versus conductivities for experiments 6, 7 and 10.
A relation between the temperatures versus conductivities up to 80° for each O/W emulsion set of the experiments 6, 7 and 10 (ESB determination of the simple formulae of paraffin-in-water emulsions stabilized by sorbitan derivatives). Experiment 6 ( ) y=0.807x+29.09, R2=0.958; Experiment 7 (
 ) y=0.771x+30.88, R2=0.951; Experiment 10 (
 ) y=0.824x+30.47, R2=0.981.
TABLE 4.
EMULSIONS PHYSICAL STABILITY RESULTS

Determination of the ESBC:
As mentioned before, the conductivities of each O/W emulsion set with SBC starting from 3% to 19% were measured at room temperature (25±2), 40, 50, 60, 70, 80° and a relation between the temperature vs. conductivity up to 80° was plotted by applying the simple linear regression (least squares method) statistical analysis. Temperatures and average of responses of conductivities were recorded in Table 5.
TABLE 5.
CONDUCTIVITIES OF DIFFERENT FORMULATIONS AT VARIOUS TEMPERATURES

We can find the line of best fit graphically by applying simple linear regression (least squares method) statistical analysis. The least squares regression line equation calculates the slope b (the change in Y for unit change in X), the intercept a (the predicted value of Y when X=0) and R2(known as the coefficient of determination). R2 is equal to the square of the correlation coefficient between the response variable Y and the predictor X or to the square of the correlation coefficient between the response variable Y and the fitted values Y. R2 is known as the coefficient of determination because it gives us an idea of how the predictor variable X accounts for (determines) the response variable Y. The least squares regression line is given by:
Y=a+bX...Eq. (2)
The results indicated that, the best fitting direct linear relationship up to 80° was fitted only to the data obtained from the relation which represents O/W emulsion with 5% concentration of the ESB. This linear relationship has the maximum determination coefficient R2 which is equal to 0.981. As known that, in the case of models with an intercept, R2 can be interpreted as the proportion of the variation in Y that is accounted for by the predictor variable X after adjusting Y by its mean. It runs from 0 to 1, with 1 indicating perfect Prediction of Y from X[16]. The maximum R2 value=0.981 of the relation which represents O/W emulsion with 5% concentration of the ESB indicates that 98.1% of the total variability in the response variable conductivity is accounted for by the predictor variable temperature which means that this relation has the strongest linear relationship between temperature and conductivity. Data were revealed in fig. 2.
Fig. 2.
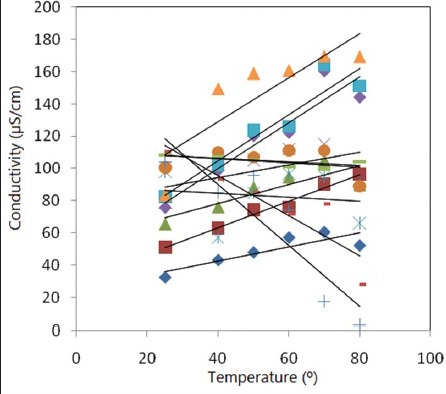
A relation between temperatures versus conductivities for emulsions with different concentrations of the ESB.
A relation between temperatures versus conductivities up to 80° for all the tested O/W emulsions with different concentrations of the ESB starting from 3% up to 19%. R2 value for each relation was recorded. Co. stands for concentration of the ESB (the figure determines the ESBC of the simple formulae of paraffin-in-water emulsions stabilized by sorbitan derivatives). 3% Co ( ) R2=0.743; 5%Co (
 ) R2=0.981; 7% Co (
 ) R2=0.711; 9% Co (
 ) R2=0.341; 11% Co (
 ) R2=0.019; 13% Co (
 ) R2=0.068; 15% Co (
 ) R2=0.811; 17% Co (
 ) R2=0.813; 19% Co (
 ) R2=0.600; 9.5% Co (
 ) R2=0.879; 10% Co (
 ) R2=0.894; 10.5% Co (
 ) R2=0.713.
So the O/W emulsion with 5% concentration of the ESB is the most stable one and consequently its 5% concentration is the ESBC. The above result was confirmed by subjecting all the O/W emulsion sets with SBC starting from 3% to 19% to the physical stability centrifugation testing for 1 hour at speed of 3500 rpm and by comparing the results of the PIT range measurements. The least squares regression line equations were revealed in figs. 3 and 4. The results were recorded in Table 6 and indicated that:
Fig. 3.
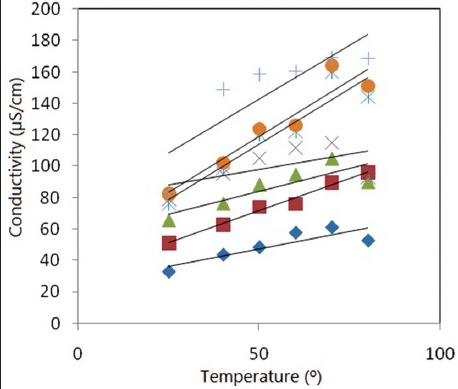
A relation between the temperatures versus conductivities with no gel consistency and concentrations of the ESB.
A relation between the temperatures versus conductivities up to 80° for each O/W emulsion with no gel consistency and with concentrations of the ESB starting from 3% up to 10.5%. The least squares regression line equation for each relation was recorded. Co. stands for concentration of the ESB. 3% Co ( ) y=0.440x+25.34, R2=0.743; 5% Co (
 ) y=0.824x+30.47, R2=0.981; 7% Co (
 ) y=0.584x+54.93, R2=0.711; 9% Co (
 ) y=0.393x+78.49, R2=0.341;9.5% Co (
 ) y=1.411x+43.76, R2=0.879; 10% Co (
 ) y=1.426x+47.70, R2=0.894; 10.5% Co (
 ) y=1.371x+74.09, R2=0.713.
Fig. 4.
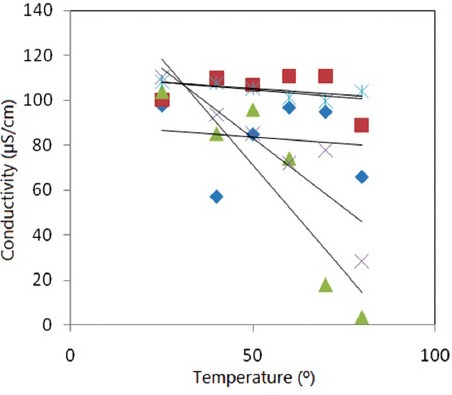
A relation between the temperatures versus conductivities with gel consistency and concentrations of the ESB.
A relation between the temperatures vs. conductivities up to 80° for each O/W emulsion with gel consistency and with concentrations of the ESB starting from 11% up to 19%. The least squares regression line equation for each relation was recorded. Co. stands for concentration of the ESB. 11% Co ( ) y=-0.12x+89.48, R2=0.0.019; 13% Co (
 ) y=-0.113x+110.8, R2=0.068; 15% Co (
 ) y=-1.889x+165.6, R2=0.811; 17% Co (
 ) y=-1.245x+145.3, R2=0.813; 19% Co (
 ) y=-0.134x+111.5, R2=0.600.
TABLE 6.
O/W EMULSIONS RESULTS
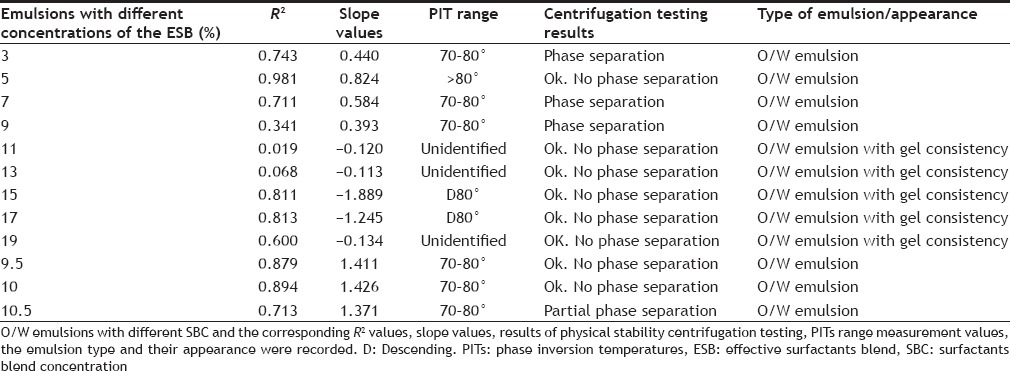
O/W emulsion with 5% concentration of the ESB has the highest PIT which is more than 80° (due to the absence of abrupt change in the conductivity up to 80°) and it has no phase separation up on applying the centrifugation testing.
O/W emulsions with SBC of 3, 7, 9 and 10.5% have a PITs ranging from 70-80° (less than 80°) and showed a phase separation when subjected to the centrifugation testing. So their results were excluded.
Although the O/W emulsions with SBC of 9.5% and 10% have not got any phase separation upon applying the centrifugation testing but their results were excluded because they have a PITs ranging from 70-80° (less than 80°) and contain much more SBC which is not acceptable.
Although the O/W emulsions with SBC starting from 11% to 19% have not got any phase separation up on applying the centrifugation testing but they have either descending PITs (DPIT) equal to D80° (less than 80°) as in the cases of O/W emulsions with SBC of 15% and 17% where the conductivity decreases by increasing the temperature or unidentified PITs as in the cases of O/W emulsions with SBC of 11%, 13% and 19% as the conductivity is not affected properly by increasing the temperature which indicates the absence of the relation between temperature and conductivity. So their results were excluded.
These results confirmed that, the O/W emulsion with 5% concentration of the ESB is the most stable one and consequently its 5% concentration is the ESBC.
Verifying the reproducibility of the method:
Because the conditions would be changed in a more complex formulations, the method of the determination of the ESBC was verified by applying it for more complex formulations of 2% O/W miconazole nitrate cream.
Proceeding in the same sequences and procedures that mentioned in the determination of the ESB of the simple paraffin-in-water emulsions, the results indicated that, the maximum R2 value=0.871 of the relation which represents O/W emulsion of experiment 5 indicates that this relation has the strongest direct linear relationship between temperature and conductivity. So the O/W emulsion of experiment 5 is the most stable one of the tested emulsion sets (experiments 5, 6 and 7). Its surfactants blend with HLB value corresponding to 9.65 is the ESB (tween 80 and span 80 in proportions equal to 0.5:0.5, respectively). The HLB value of the ESB is the RHLB value of the emulsion system. The statistical analysis results were revealed in fig. 5. Regarding the determination of the ESBC, the results indicated that, the maximum R2 value=0.935 of the relation which represents O/W emulsion with 7% concentration of the ESB indicates that this relation has the strongest direct linear relationship between temperature and conductivity. So the O/W emulsion with 7% SBC is the most stable one and consequently its 7% concentration is the ESBC. The theoretically calculated RHLB of O/W emulsion system with 7% ESBC is 9.236.
Fig. 5.
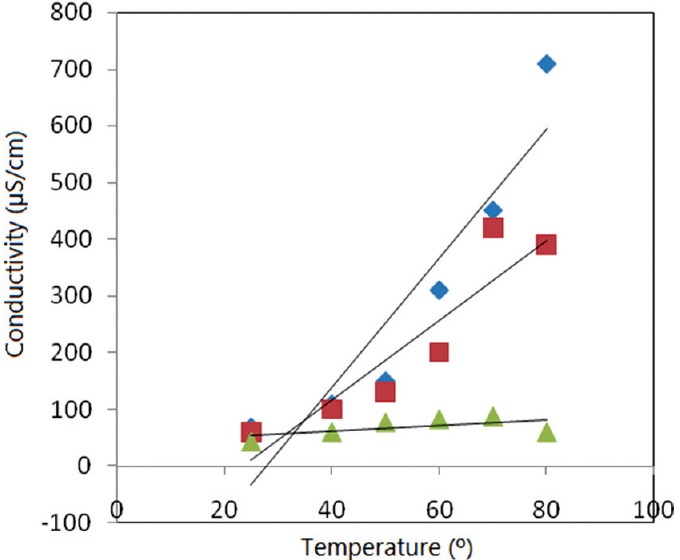
A relation between the temperatures vs. conductivities for experiments 5, 6 and 7.
A relation between the temperatures vs. conductivities up to 80° for each O/W emulsion set of the experiments 5, 6 and 7 (determination of the ESB of the complex formulae of 2% miconazole nitrate O/W creams). Experiment 5 ( ) y=11.44x-319.7, R2=0.871; Experiment 6 (
 ) y=7.033x-164.2, R2=0.850; Experiment 7 (
 ) y=0.494x+42.46, R2=0.343.
The statistical analysis results were revealed in fig. 6. The above results were confirmed by subjecting all the O/W emulsion sets of the more complex formulations to physical stability centrifugation testing and PIT measurement as mentioned before. These results confirmed the above results and indicate the reproducibility of the method in case of more complex formulations.
Fig. 6.
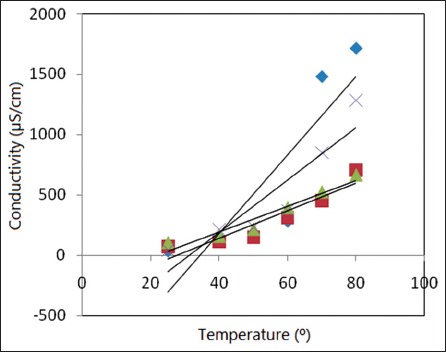
A relation between the temperatures vs. conductivities for emulsion with SBC.
A relation between the temperatures vs. conductivities up to 80° for each O/W emulsion with SBC starting from 3% up to 9% (determination of the ESBC of the complex formulae of 2% miconazole nitrate O/W creams). 3% Conc ( ) y=32.49x-1120, R2=0.752; 5% Conc (
 ) y=11.44x-319.7, R2=0.871; 7% Conc (
 ) y=10.59x-229.0, R2=0.935; 9% Conc (
 ) y=21.64x-674.5, R2=0.841.
Suitability of the linear regression analysis-Bingham model:
In the beginning let us to say that, all the tested emulsions were prepared by the same instruments and same method. Regarding the emulsions compositions, Tables 1 and 2 revealed that the two surfactants were used in different concentrations. As the R2 value is in strong dependence on the experimental condition (different concentrations of the two surfactants). Therefore, the recorded great variability of R2 values are due to the presence of a wide range of different concentrations of the two surfactants which is the principal up on which the study built. This assumption is correct because the results obtained from the linear regression analysis were confirmed practically by subjecting all the tested O/W emulsion sets to the physical stability centrifugation testing and by comparing the results of the PIT range measurements. Practical confirmation of these results represents a very important factor which indicates the suitability and precision of the R2 results.
In my opinion, it is better of using the linear regression analysis to evaluate the results of the emulsions and this is because, as known, the liquid and solid heterogeneous dispersions such as colloidal solutions, emulsions, liquid suspensions, ointments and similar products are following the Non-Newtonian’equation of flow. The Non-Newtonian plastic flow curves of emulsions do not pass through the origin but rather intersect the shear stress axis (or will if the straight part of the curve is extrapolated to the axis) at a particular point referred to as the yield value[17]. It is clear from the above mentioned criteria that the linear regression analysis is the relation that will give us the yield value which is very important factor in studying emulsions. New approach of the yield will be explained in details in my next manuscript.
The reliability of the experimental results presented in figs. 1-6 was evaluated using regression analysis. R2 runs from 0 to 1, with 1 indicating perfect Prediction of Y from X. So the trendline is most reliable when its coefficient, R2, is at or near 1[16,18]. In this work, determination of ESB and ESBC were based on the determination of the maximum R2 values which were approximately equal 1 (equal 0.981 and 0.981, respectively). In the case of more complex formulations, the determination of ESB and ESBC were based on the determination of the maximum R2 values which were approximately near 1 (0.871 and 0.935, respectively). These results mean that the trendlines are reliable and precise as their coefficient, R2 values, are at or near 1[16,18].
In addition, all the above results were confirmed practically. Rashaida AA, in his PhD discussed and studied the effect of wax concentration on the shear stress-shear rate curve. He studied also the effect of temperature on the wax-oil mixture and the shear stress-shear rate curve for the diluted gel mixtures for 12.5, 25 and 50 wt% gel concentration. He confirmed the suitability of the Bingham model and he stated that the trendline is most reliable when its coefficient, R2, is at or near 1[16,18]. It is important to denote that Rashaida does confirm his linear regression results practically. The reliability of the trendline in his work depends mainly on the high values of the R2.
DISCUSSION
The relation that represents the most stable O/W emulsion has the strongest direct linear relationship between temperature and conductivity. This relationship is linear up to 80°. The statistical analysis gives the maximum R2 value only to the data obtained from the relation which represents the most stable O/W emulsion, directly, and without any interference. The recorded maximum R2 value represents actually the true maximum R2 value and is affected by the SBC. We concluded that, the most stable O/W emulsion is determined via the determination of the maximum R2 value by applying of the simple linear regression (least squares method) to the temperature–conductivity obtained data up to 80°. Since the results of O/W emulsions with SBC of 9.5, 10 and 10.5% were excluded as mentioned before, so the slope value equal to 0.824 of the relation which represents the most stable O/W emulsion is the maximum slope. As the slope is the change in Y for unit change in X. Also, an equivalent definition is the change in Y divided by the change in X for any segment of the line. This means that, the most stable O/W emulsion has the highest predictive difference in the conductivity associated with the one unit increases in temperature or in other word we can say, it has the highest change in conductivity for unit change in temperature.
Statistical analysis does not give the maximum slope value to the data obtained from the relation that represents the most stable O/W emulsion directly; it always needs verification, confirmation and explanations. The slope values were affected by changing the SBC. The highest recorded slope value equal to 1.426 does not represent actually the true maximum slope value which is equal to 0.824. This indicates that, to judge the stability of the O/W emulsion, the maximum R2 value is more précised and is most important parameter than the maximum slope value. We concluded that, for any related sets of data the true maximum slope value is represented by the relation (equation) of set of data which has the maximum R2 value.
We can differentiate between the O/W emulsions with no gel consistency and the O/W emulsions with gel consistency by the type of linearity and also can be differentiated by PIT measurements.
The statistical analysis proved that the O/W emulsion sets with SBC stating from11% up to 19% are not a typical O/W emulsions as they have indirect linear relationship. They may be O/W emulsion gel or O/W micro emulsion gel. Which needs more investigation?
Verification of the method indicates its reproducibility in the case of the complex formulations containing drugs.
Financial support and sponsorship:
Nil.
Conflicts of interest:
There are no conflicts of interest.
Acknowlegements:
The author would like to thank Grand pharma for pharmaceutical industries Co., 10th of Ramadan city, industrial zone B4, Sharkia, Egypt.
Footnotes
Hassan: Effective Surfactants Blend Concentration
REFERENCES
- 1.Marszall L. The effective hydophile-lipophile balance and the structural modifications of nonionic surfactants. Acta Pharm Technol. 1981;27:137–44. [Google Scholar]
- 2.Enever RP. Correlation of phase inversion temperature with kinetics of globule coalescence for emulsions stabilized by a polyoxyethylene alkyl ether. J Pharm Sci. 1976;65:517–20. doi: 10.1002/jps.2600650410. [DOI] [PubMed] [Google Scholar]
- 3.Parkinson CJ, Sberman P. Measurement of phase inversion temperature above 100, and their relevance to emulsion stability at ambient temperature. Colloid Polym Sci. 1977;255:172–3. [Google Scholar]
- 4.Lin TJ. Adverse effects of excess surfactants upon emulsification. Cosmet Toiletries. 1991;106:71–81. [Google Scholar]
- 5.Tirnaksiz F, Kalsin O. A topical w/o/w multiple emulsions prepared with Tetronic 908 as a hydrophilic surfactant: Formulation, characterization and release study. J Pharm Pharm Sci. 2005;8:299–315. [PubMed] [Google Scholar]
- 6.Anton N, Gayet P, Benoit JP, Saulnier P. Nano-emulsions and nanocapsules by the PIT method: An investigation on the role of the temperature cycling on the emulsion phase inversion. Int J Pharm. 2007;344:44–52. doi: 10.1016/j.ijpharm.2007.04.027. [DOI] [PubMed] [Google Scholar]
- 7.Prinderre P, Piccerelle PH, Cauture E, Kalantzis G, Reynier JP. Formulation and evaluation of o/w emulsions using experimental design. Int J Pharm. 1998;163:73–9. [Google Scholar]
- 8.Lin TJ, Kurihara H, Ohta H. Effects of phase inversion and surfactant location on the formation of O/W emulsions. J Soc Cosmet Chem. 1975;26:121–39. [Google Scholar]
- 9.Rai N, Pandey IP. Study of some physiochemical factors determining emulsion stability with mixed emulsifiers. J Ind Res Technol. 2013;3:12–6. [Google Scholar]
- 10.Bagwe RP, Kanicky JR, Palla BJ, Patanjali PK, Shah DO. Improved drug delivery using microemulsions: Rationale, recent progress, and new horizons. Crit Rev Ther Drug Carrier Syst. 2001;18:77–140. [PubMed] [Google Scholar]
- 11.Sevcikova P, Kasparkova V, VltavskaL P, Krejci J. The Influence of Colloids on Stability and the Particle Size of O/W Emulsions in the Presence of Nonionic Surfactants. Nanocon, 4th International Conference, Brno, Czech Republic, October 23-25. 2012 [Google Scholar]
- 12.Allouche J, Tyrode E, Sadtler V, Choplin L, Salager JL. Simultaneous conductivity and viscosity measurements as a technique to track emulsion inversion by the phase-inversion-temperature method. Langmuir. 2004;20:2134–40. doi: 10.1021/la035334r. [DOI] [PubMed] [Google Scholar]
- 13.Choi E, Jin K, Rhim S, Kim M. Microemulsions with PITs near room temperature. Cosmet Toiletries. 1997;112:85–90. [Google Scholar]
- 14.Shinoda K, Saito H. The stability of O/W type emulsions as functions of temperature and the HLB of emulsifiers: The emulsification by PIT-method. J Colloid Sci. 1969;30:258–63. [Google Scholar]
- 15.Wilkinson JB, Moore RJ, editors. Great Britain: Longman Scientific and Technical; 1994. Harry's Cosmeticology. [Google Scholar]
- 16.Chatterjee S, Hadi AS. 4th ed. New Jersey: John Wiley and Sons Inc; 2006. Regression Analysis by Example. [Google Scholar]
- 17.Sinko PJ, Singh Y, editors . Baltimore: Lippincott Williams & Wilkins, Wolters Kluwer Business; 2011. Martin's Physical Pharmacy and Pharmaceutical Sciences. [Google Scholar]
- 18.Rashaida AA. Saskatchewan: Department of Mechanical Engineering, University of Saskatchewan; 2005. Flow of a non-Newtonian Bingham plastic fluid over a rotating disk. [Google Scholar]


